Identifying the effect of decoupling in major economic sectors of the Komi Republic

Author: Fomina Valentina F.
Journal: Economic and Social Changes: Facts, Trends, Forecast @volnc-esc-en
Section: Environmental economics
Article in issue: 1 т.15, 2022.
Free access
The concept of decoupling is currently recognized as a strategic basis for moving toward an environmentally sustainable economy. This fact is confirmed by a review of publications discussing the possibility of achieving an imperative distinction between economic activity, welfare, and resource utilization. In this regard, the relevance of the problem of ensuring sustainable eco-economic development of the region is increasing, which determined the purpose of the work - to obtain the evidence base proving the actual achievement of decoupling in basic industries (extractive, manufacturing, energy). In order to assess the relationship between economic activity and environmental impact at the industry level, we adapted the Tapio decoupling model known as the Decoupling Diamond, which includes eight decoupling states depending on economic growth rate, resource consumption or environmental impact and the value of the elasticity coefficient representing the growth ratio of these indicators. Determining the state of decoupling in each industry includes calculating the rate of change in gross value added (in comparable prices) and environmental indicators: water abstraction, dirty discharge, air pollutant emissions, production waste generation for the period 2010-2019. The results obtained indicate that the rates of change in gross value added, consumption of natural resources, and the negative impact on the environment are related, separated, or negatively divided. For all of the industries under consideration we have revealed a weak negative decoupling on the dirty discharge, for the energy industry - a weak decoupling on the production waste generation. We have identified a downward trend in current and investment environmental costs in the extractive and manufacturing industries, as well as an increase in the proportion of payments for negative environmental impact (NEI) and a decline in innovation activity. The results of the study indicate the need to improve the economic performance of basic industries and strengthen their environmental protection activities; subsequently, the results may be in demand for regulation of eco-economic relations.
Decoupling model, industries, economic growth rates, environmental impact, environmental costs, komi republic
Short address: https://sciup.org/147237310
IDR: 147237310 | UDC: 332.1:504.062
Text of the scientific article Identifying the effect of decoupling in major economic sectors of the Komi Republic
The relevance of resource efficiency and environmental impact reduction is outlined in a number of documents developed by the leading global environmental organization UNEP (United Nations Environment Programme) and aimed at implementing the Sustainable Development Goals in accordance with the 2030 Agenda 1 . At the second session of the UN Environment Assembly (May 23–27, 2016) 2 , states recognized that the transition to sustainable development on a global scale requires a fundamental change in the consumption and production patterns of countries.
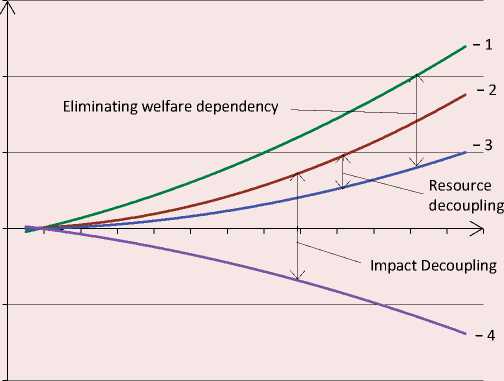
International experts in comparing scenarios for a possible future in the “Global Resources Outlook 2019” and a number of other works have shown the benefits of disseminating sustainable consumption and production models (IRP, 2017; IRP, 2019; IRP, 2020). It is important to emphasize that in the sustainable development publications discussed above, the distinction between economic activity and human well-being, on the one hand, and resource use and resource efficiency, on the other, is a key point, derived from the concept of decoupling (IRP, 2017). The essence of the decoupling concept, currently recognized as the strategic basis for the movement toward a sustainable economy, is visualized in Figure 1.
This conceptual model (Fig. 1) points to an ideal goal where economic growth and human well-being would increase while slowing resource use and environmental degradation to levels compatible with planetary boundaries, thus ensuring sustainable resource use and conservation for future generations. We should note that the theoretical foundations of decoupling are based on the assumption of economic growth and other variants of the situation are not considered. In this regard, some uncertainty and vagueness of the concept of “sustainable” gives rise to the existence of different points of view and interpretations regarding decoupling in research papers.
Thus, the authors (Wiedmann et al., 2020) acknowledge that humanity needs to reevaluate the role of growth-oriented economies and the pursuit of abundance, noting that over the past several decades (1970–2017), global growth in prosperity has consistently increased resource use and pollutant emissions at a higher rate than they have declined due to better technology. A convincing argument against continued economic growth in developed
Figure 1. The essence of the decoupling concept
-
1 - Welfare
-
2 - Economic activity
-
3 - Resource use
-
4 - Pressure and impact on the environment
Source: own compilation according to the data (IRP, 2017).
countries is made by British scientist T. Jackson in his book Prosperity Without Growth: Foundations for the Economy of Tomorrow , released in 2009 and reprinted in 2017 (Jackson, 2017). A proponent of degrowth is scientist Timothy Parrique 3 , who has investigated the economic implications of ideas of slow growth and post-growth (Parrique et al., 2019). Researchers (Eisenmenger et al., 2020) note that the question “Is economic growth sustainable?” , which has arisen in recent decades, remains controversial. A critical review of the Sustainable Development Goals (Ward et al., 2016) concluded that their progress by 2030 will not ensure the sustainability of social structures and the reduction of resource use according to planetary boundaries, as the current events of the European gas crisis attest.
The analysis of published works on the subject under consideration also showed that a significant part of the scientific papers focuses on the study of the decoupling effect and its measurement. The studies of foreign authors prevail, which focus on the analysis of the relationship between economic growth and emission rates, most often greenhouse gases and CO2, at the national level. Of greatest interest are the studies of a review type, carried out in order to present the evidence base of the real achievement of the decoupling effect. For example, in a paper by Finnish scientists (Wiedenhofer et al., 2020), the authors analyzed 179 articles published between 1990 and 2019 discussing separation at different geographic scales (from regional, national to global) based on categorization by type of separation. The authors note that cases of absolute separation of the use of land and natural waters from economy-wide GDP are not confirmed either nationally or internationally.
We should also note a systematic review in which the authors analyzed 835 empirical studies (1976–2019) related to final/utility energy, exergy, material resource use, CO2 and total greenhouse gas emissions, that is of interest. The authors conclude that examples of absolute long-term decoupling are rare and argue for more research on the interdependencies between welfare, resources, and emissions (Haberl et al., 2020; Vaden et al., 2020). In the context of sustainable resource use policies, material flow and its productivity (productivity of labor, materials, and energy) have a significant place in research (Bleischwitz, 2010). There is a general trend that material productivity in Europe has improved, the economy creates more value (by GDP) per ton of resources used, but the level of this indicator differs by a factor of 17 across the EU-274. At the same time, researchers at the Sustainable Europe Research Institute (SERI), analyzing the interaction between resources and labor productivity, point out that labor productivity has grown stronger than resource productivity, nevertheless it is important to consider their role in economic growth (Stocker et al, 2015). An analysis of global trends in material use in relation to the development of world GDP shows that relative separation was the norm throughout the twentieth century. But since 2002, material productivity has begun to decline at an average annual rate of 1.3% due to the rapid expansion of material production in many regions of the world, with production growth rates exceeding global GDP, resulting in a lack of separation (Krausmann et al., 2017).
There are few studies on this topic in Russia (Bobylev et al., 2019). In the works of Russian scientists, much attention is paid to the analysis of the relationship between trends in economic development, resource consumption and environmental pollution at the regional level (Tret’yakova, 2019; Shkiperova, 2014; Kozhevnikov, Lebedeva, 2019) or individual industries (Akulov, 2014; Yashalova, 2014; Zabelina, 2019).
An assessment of the ecological consequences of the economic development of the regions in
Russia’s Northwestern Federal District (NWFD) shows that the economic growth of the regions in NWFD is green only with respect to water use (Tret’yakova, 2019). From the analysis of the relationship between economic growth and ecological quality in the Republic of Karelia, it follows that the decoupling effect appears only in relation to air pollutant emissions from stationary sources (Shkiperova, 2014). One of the main problems hindering environmental and economic development and the emergence of a sustainable decoupling effect in the regions of the European North of Russia is the high energy and natural resource intensity of the regional economy (Kozhevnikov, Lebedeva, 2019). The paper (Akulov, 2014) investigated the impact of the coal industry on the environment in the region of industrial type (Kemerovo Oblast) during the period of dynamic growth of the industry and shows the absence of decoupling effect. In contrast, the analysis of the levels of natural resource intensity and environmental impact of major industries in the Vologda Oblast shows that in the period 2000–2012 the pollution intensity decreased with the growth of gross regional product (Yashalova, 2014). The analysis of the negative environmental impact and resource consumption in the border regions of the East of the Russian Federation and the constituent entities of the Baikal region showed heterogeneity in their manifestation of the decoupling effect for all types of economic activity (Zabelina, 2019).
In the monograph (Bobylev et al., 2019), the authors present the results of identifying the mismatch between trends in economic development and certain types of environmental impact (water use, wastewater discharge, air pollution by sulfur dioxide and particulate matter) in Russia and federal okrugs during the period 2000–2014. The decoupling effect is observed in air pollution emissions and water use in the Russian economy as a whole and in most constituent entitites. At the same time, according to the Kuznets curve) only seven regions are on the downward section5. This leaves the question of whether there is a decoupling effect at the industry level in these regions.
Thus, due to the heterogeneity of Russian regions by the level of environmental and economic development and the lack of comprehensive evidence of the sustainable effect of decoupling at the sectoral level of a particular region, the assessment of the relationship nature of economic activity, resource use and environmental impact of the basic industries of the northern region is an urgent task. The purpose of the study is revealing the decoupling effect in basic industries (extracting, manufacturing and energy) of Komi Republic. On this basis, the study involves the formation of a database of economic and environmental performance of basic industries, decoupling analysis based on an adapted Tapio model, considering the rate of change in economic growth and resource intensity and environmental impact, their comparison, visualization and synthesis of the results. The novelty of the work consists in obtaining relevant for the region results of the study of the relationship nature of economic and environmental factors broken down by industry sectors using the decoupling model.
Materials and research methods
The study was conducted in accordance with the DPSIR6 model, integrated into the process of preparing materials for the report “State of the Environment in the Russian Federation”7. We assumed that drivers are the following types of economic activity related to the use of natural resources in the Republic: extraction of mineral resources (coal, oil, gas), manufacturing, produc- tion and distribution of electricity, gas and water. The empirical basis of the study was sectoral indicators of the database Komistat8, reports on the state of the environment in the Komi Republic for 2010–2020.
It follows from the review of the literature that to identify the decoupling effect, the most widely used is the method proposed by the OECD 9 , based on the DPSIR model. According to this method the ratio of environmental and economic indicators is estimated: Df = 1 – (EP/DF) t / (EP/DF) o , where Df is the decoupling factor, EP – environmental pressure, DF – driving force (GDP, GVA), o,t – indices denoting the time period. The method is limited to estimating two states of decoupling (absolute and relative).
The method was developed in the works of J. Vehmas, where the decoupling model described six states (Vehmas et al., 2003). Subsequently this model was modified by P. Tapio and included eight decoupling states depending on the growth rate of resource consumption or environmental pressure ( ∆ EP, %), economic growth ( ∆ GDP, %) and the value of the elasticity ratio, determined by the ratio: e = ∆ EP/ ∆ GDP (Tapio, 2005). In the subsequent work P. Tapio made some amendments to the model and named it the Decoupling Diamond (Finel, Tapio, 2012) (Fig. 2) .
Adapting the Decoupling Diamond model to assess the relationship between economic activity and environmental impact at the industry level, we note that the rates of change in pollutant impact ∆ EP and gross value added ∆ GVA can either be related (expansive coupling and recessive coupling)
Figure 2. State of decoupling according to the Tapio Decoupling Diamond model
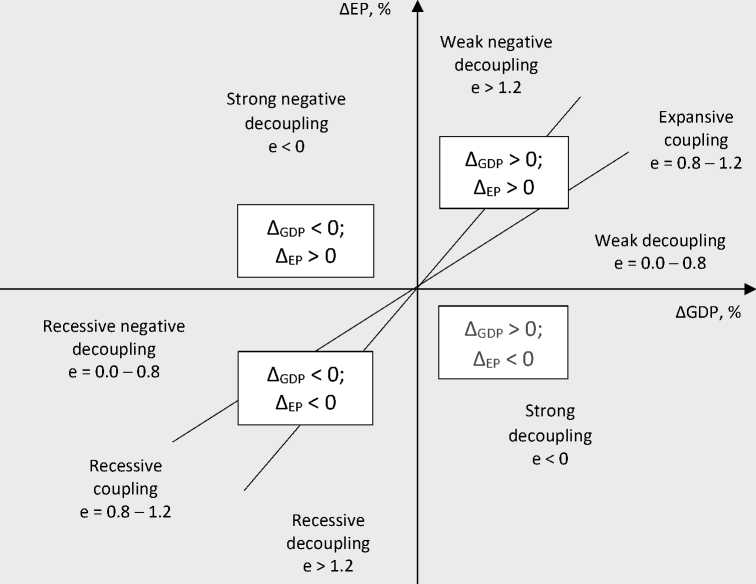
Source: compiled according to the data (Finel, Tapio, 2012).
or separated (strong dеcoupling, weak dеcoupling, recessive dеcoupling), or negatively separated (strong negative dеcoupling, weak negative dеcoup-ling, recessive negative dеcoupling) (Fig. 2) .
Assessing the decoupling effect involves the conversion of economic performance data (GVA) to comparable prices based on an index of physical volume of production for each industry. At the next stage, we determine the rate of change in economic growth (GVAi/GVAi-1, %) and environmental indicators (EPi/EPi-1, % – water abstraction, wastewater discharge, air pollutant emissions, waste generation) in the corresponding time period (ti-1 – ti). Then we calculate the value of growth of the indicators under consideration ∆GVAi, % and ∆ EPi, % and calculate the coefficient of decoupling elasticity as the ratio of changes in these indicators in the form: Kei = (∆EPi, %) / (∆GVAi, %). The results obtained for each industry are visualized by the selection of optimal diagrams, on which we base our decoupling analysis.
Research findings
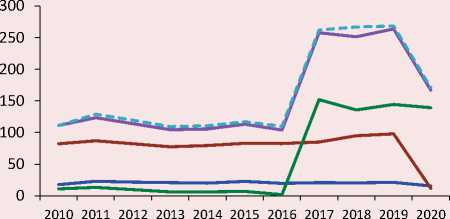
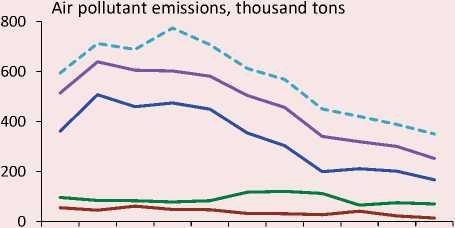
Analysis of statistical data (2010–2019) broken down by types of economic activity showed that the negative environmental impact is mainly caused by extraction of mineral resources, manufacturing, production and distribution of electricity, gas and water. The diagrams in Figure 3 give an idea of the environmental impact level of these industries over the past decade.
According to Figure 3 , in 2020, industry’s proportion of fresh water intake is 96% (including 64% of electric utilities’ contribution), 98% of polluted wastewater discharges (electric utilities’ proportion is 82%), 72% of air pollutant emissions (including 48% extraction, 20% electricity generation), 98% of waste generation (including 91% of extraction).
Water abstraction, million cubic meters

Figure 3. Dynamics of the main environmental indicators due to the activities of industrial enterprises in the period 2010–2020 (Komi Republic)
Polluted wastewater discharge, million cubic meters
2010 2011 2012 2013 2014 2015 2016 2017 2018 2019 2020
2010 2011 2012 2013 2014 2015 2016 2017 2018 2019 2020
Extractive industry
Manufacturing industry
Electricity generation
Production waste generation, thousand tons
Total by industry
Total for the Komi Republic
Source: own compilation according to the data of Komistat.
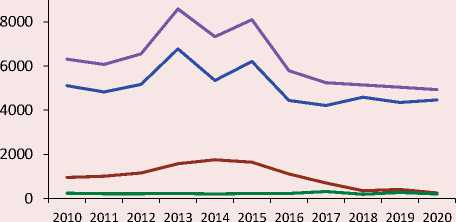
For the extractive industry this period is characterized by an increase in oil production (12%), gas (7%) and a decrease in coal (23%). The economic performance, assessed by the value of gross value added (GVA) in comparable prices, decreased to 98.3%, which is associated with the unstable activity of coal enterprises (Fig. 4).
The change in the pace of economic activity in the industry affects the features of natural resource management. Determinants of this relationship are shown in Table 1 : ∆ fresh water abstraction – to identify resource decoupling; ∆ polluted wastewater discharge, ∆ air pollutant emissions, ∆ waste generation – to register environmental impact decoupling. To visualize the nature of the relationship, we used a scatter diagram (Fig. 5).
Calculation of decoupling elasticity coefficient (Ke) on fresh water abstraction shows that strong decoupling takes place in case of GVA increase and water abstraction decrease with negative Ke value in 2011, 2013, 2018 and 2019 (see Tab. 1). On the scatter diagram in the axes “ ∆ water extraction – ∆ GVA” these years are located in the IV quarter of the coordinate plane (– +) (see Fig. 5).
With negative ∆ GVA, increased ∆ water abstraction, and Ke < 0 in 2014 and 2017, the strong decoupling carries a negative nature (Str.neg.dec.). On the scatter diagram, these years are in the II quarter (+ –). The calculated indicators of 2015 are positive, the value of the coefficient Ke > 1.2, which causes a weak negative decoupling (W.neg. dec.) with the location of the marker of the year
Figure 4. The economic performance of the extractive industry in the period 2010–2019 (Komi Republic)
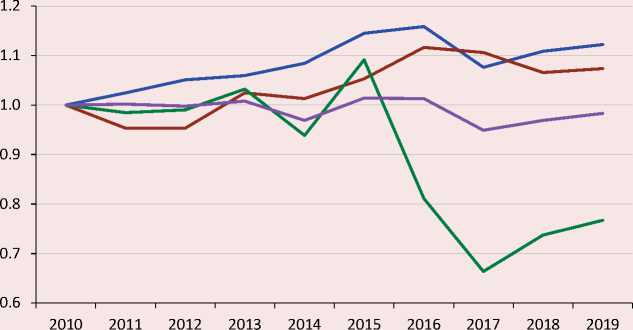
Source: own compilation according to the data of Komistat.
Figure 5. The nature of the relationship between the rate of economic growth and the environmental burden in the extractive industry in the period 2010–2019 (Komi Republic)
∆ water abstraction, % 25
∆ waste water discharge, % 40
• 2017
• 2014
-8 -6 -4 -2 0
2012 el
-10
2019 ∆GVA, %
2011 2 4
к 2010-2019
• 2013
-8
■ 2017
-6
30 p 2011
2014 -22012 ■
-10
■ 2010-2019
■ ∆GVA, %
2 2018 4
e 2016
-15
■ I 2016
-20
∆ air pollutant emissions, % 50
40 >
∆ production waste 40 generation, %
A 2013
-8 -6
-2
-10 ► 0
2013 ♦ 2018
∆GVA, %
♦ 2017
- * 2016
-20
2012 2 20194
-10 A -5
0 2011
-10
∆GVA, %
-30
-40
♦ 2010-2019
-50
5 2019
A 2010-2019
-20
-30 4 2016
-40
Source: compiled according to the calculated data in Table 1.
Table 1. Decoupling elasticity coefficient (Ke) and decoupling types in the extractive industry in the period 2010–2019 (Komi Republic)
In general, the resource decoupling by water abstraction in the period 2010–2019 relative to the base year 2010 is of a strong decoupling nature (Str.dec.), due to the indicators: ∆ WDS > 0, ∆ water abstraction < 0, Ke < 0 . On the “water abstraction” scatter diagram, the estimated point “2010–2019” as a red marker is located in the zone of strong disconnect between economic growth and water abstraction, in the fourth quarter (– +).
Calculated environmental impact data on the waste water discharge (see Tab. 1, Fig. 5) show that in 2014 the growth of ∆ WDS is negative and close to the rate of reduction of waste water discharge, Ke = 0.9, which causes a recessive coupling (Rec.cou). In 2019, with positive increases in these indicators and Ke = 0.8, their coupling becomes expansive (Rec.cou). A strong decoupling (Str.dec.) is observed in 2013 and 2018, when ∆ GVA, equals1.0 and 2.1%, respectively, and ∆ polluted wastewater discharge, -5.3 and -1.4%, respectively (Ke < 0). The period of 2010–2019 is generally characterized by positive values of ∆ GVA > 0, ∆ waste water discharge > 0, coefficient Ke > 1.2. According to this point “2010–2019” (red marker) is located in the upper part of the I quarter of the diagram (see Fig. 5), which corresponds to a weak negative state of decoupling (W.neg.dec).
Calculation of the decoupling elasticity coefficient for air pollutant emissions shows that in 2015 and 2019, the best environmental and economic results, characterized by a strong decoupling, were achieved (Str.dec.). In other years, we see an alternation of weak negative decoupling driven by emissions growth (2011, 2013, 2018) with recessive decoupling driven by the economic slowdown (2012, 2014, 2016, 2017). Assessing the studied period 2010–2019 as a whole, we can conclude that at the industry level there is a strong decoupling of economic growth from air pollutant emissions (Str. dec.). On the diagram, the point “2010–2019” is located in the IV quarter (marker in red).
The state of decoupling for production waste generation is similar to other environmental impact indicators in the industry and is variable, ranging from a strong decoupling in 2011 and 2019 to a recessive coupling in 2017. Overall, the 2010–2019 period is rated strong decoupling as a result of a significant decrease in waste generation (14.7%).
Manufacturing industry. The contribution of the industry to the gross regional product is about 10–11%. In terms of gross value added, the most important industries are wood processing and manufacturing of wood products (GVA proportion of 15–16%), paper production (30–33%), petroleum products (30–55%), chemical products (2%). Considering the dynamics of the main types of environmental impact, we should note that the volume of water abstraction of the manufacturing industry is 1.4 times greater than that of extractive companies and 3.5 times less than the volume of fresh water abstraction in the electric power industry (See Fig. 3). Over the period 2010–2020 the proportion of the industry in the water abstraction of the Komi Republic decreased from 21 to 18% due to the increase in the use of recycled water. The calculation of the decoupling elasticity coefficient (Ke) for the manufacturing industry indicators is performed similarly to Table 1, but in order to reduce the volume the results are presented only as scatter diagrams in Figure 6.
In the “water abstraction” diagram, the location of the 2011, 2013, 2017, 2018, and 2010–2019 points in the fourth quarter indicates the existence of strong decoupling as a result of reduced water abstraction and an increase in ∆ GVA, with Ke < 0. With economic decline and higher rates of water abstraction decline, when the coefficient of Ke is greater than 1.2 (2012, 2015, 2019), decoupling becomes recessive, with markers located in the third
-
Figure 6. The nature of the relationship between economic growth and environmental burden in manufacturing industry in the period 2010–2019 (Komi Republic)
∆ water abstraction, % 15
∆ waste water discharge, %
2010-2019
∆GVA, %
2011 10
-20
-25
2010-2019
∆ air pollutant emissions, %
∆ production waste generation, %
▲ 2011
∆GVA, %
∆GVA, %
2010-2019
10 15
2010-2019
Source: own compilation according to the data of the calculation similar to that in Table 1.
quarter. Strong negative decoupling was detected in 2016, which is caused by both reduction of ∆ GVA and growth of water abstraction, Ke = -3.9. Weak negative decoupling was observed in 2014.
Gross air pollutant emissions from stationary sources in the manufacturing industry are the lowest in quantitative terms, their proportion is 4.1%. We can note a trend toward a constant reduction of air pollutant emissions. For the period 2010–2019, the volume of emissions decreased by 59.6%. The diagram shows that when ∆GVA is negative, there is recessive decoupling (2015, 2016, and 2019); when GVA is positive, there is strong decoupling (2011, 2013, 2014, 2017, the whole period 2010–2019).
A relatively high contribution of the industry to environmental pollution is caused by waste water discharge due to the improper operation of the biological stage of the pulp and paper production treatment facilities, which in the period under review were under reconstruction.
According to the calculation results, the industry contribution to this type of pollutant impact in the period 2010–2019 exists in the form of a weak negative decoupling due to the increase in waste water discharges, which is 19%. In the diagram (Fig. 6), only the 2013 marker is located in the zone of strong decoupling. 2011 and 2017 are in the zone of weak decoupling, 2014 and 2018 – in the weak negative decoupling, which is due to an increase in waste water discharges with an increase in GVA. In the other years, due to declining economic growth while waste water discharges increased, the nature of decoupling is recessive (2012), recessive negative (2016), or strong negative (2015, 2019). In the nearest future (since 2020) the situation should change to the strong decoupling resulting waste water discharge reduction by 8-fold and the industry’s proportion in the total water discharge from 74% to 7% (due to the introduction of treatment facilities in the pulp and paper industry after reconstruction).
We should note that the manufacturing enterprises of the industry are also sources of waste generation , but their volume is 10-fold less compared to the extractive enterprises. The peak of waste generation was observed in 2014, relative to which at present the amount of industry waste has decreased by almost 7-fold. Calculations show that the relationship between economic growth and waste generation in the period 2010–2019 in the industry has a strong decoupling nature, due to the high rate of waste generation reduction (57%) with the growth of ∆ GVA.
Production and distribution of electricity, gas and water. In the period 2010–2019 the ratio of the industry in the gross added value of industrial production decreased gradually from 10.3% to 5%, despite the growth of electricity production from 9.3 to 10.6 billion kWh, which amounted to 14%. The production of thermal energy increased by 12.4%. In 2019, the level of electricity consumption was 9,215.7 million kWh, including the population –
850 million kWh and almost the same amount of losses in public networks. The activity of the industry enterprises is associated with the use of natural gas, coal, heating oil, diesel fuel and other resources. The industry leads in the use of water resources and waste water discharge (see Fig. 3).
The results of the calculation of the indicators determining the impact level of the industry economic growth on the environment are shown in the diagrams in Figure 7. A decoupling analysis of estimated water abstraction rates shows that in 2011, 2014, 2015, 2017, 2018 there is an increase in gross value added in the range of 0.7–6.0%, in other years there is a decline (2012, 2013, 2016, 2019) of 0.1–1.2%. At the same time, there is a decrease or increase in water abstraction. The combination of the states of these indicators (+ +; + –; – –; – +) determines the value of the elasticity coefficient Ke and the nature of the relationship. The diagram shows that the “points-years” are placed in different parts of the coordinate plane. We can say that in 2011, 2014 and 2018 there is a strong decoupling corresponding to the “+ –” position. The pattern of activity in 2012 leads to a recessive relationship, with Ke equal to 0.83, because the rate of ∆ GVA decrease is higher than the rate of water abstraction decrease. The worst state (strong negative decoupling) occurs in 2019, when the ∆ GVA decreases while water abstraction increases at a higher rate. Overall, calculations for the period 2010–2019 point to the emergence of strong decoupling of economic growth and water abstraction.
There is a weak negative decoupling (2011, 2015, 2017) in industry activity relative to waste water discharges due to high growth in wastewater discharges relative to the rate of ∆ GVA. The very high increase in the waste water discharge in 2017 suggests that it is caused by two factors: a decrease in the use of recycled water and the fact of the transition of waste water category “partially clean, without treatment” to “polluted”, requiring
-
Figure 7. The nature of the relationship between economic growth and environmental burden in the energy industry in the period 2010–2019 (Komi Republic)
∆ water abstraction, %
6ш 2019
∆ waste water discharge, % 150
2010-2019
∆GVA, %
15 20
2010-2019
∆GVA, %
15 20
∆ air pollutant emissions, %
40 J<
∆ production waste generation, %
40А 2019
∆GVA, %
2012 0 2015
2010-2019
15 20
-10
-20
0 2016 А5
2014 А
15 ∆GVA, %20
-30
-40
-50
♦ 2018
2010-2019
-30
-40
-50
Source: own compilation according to the data of the calculation similar to that in Table 1.
treatment before discharging into water bodies. As a consequence, an assessment of the period 2010–2019 shows that the nature of this type of environmental impact is a weak negative decoupling (W.neg.dec) and the development of the situation is determined by the position of the point “2010– 2019” on the coordinate plane as a red marker in the I quarter (+ +) and the value of Ke more than 1.2.
The type of relationship between economic activity and production waste generation during the study period 2010–2019 is also characterized by decoupling variability: strong (2011), strong negative (2012, 2013), strong (2014), weak negative (2015), recessive (2016), weak negative (2017), strong (2018), strong negative (2019). It is worth noting that the energy industry generates about 277 thousand tons of industrial waste, which is 5.5% of the total volume in the industry (excluding overburden waste of hazard class V). There is no statistical data on the structure of waste by industry, so a comparison of the polluting impact of industries is possible only by quantitative indicators. Because of this, it is difficult to assess the true negative impact on the environment.
The development of environmental protection activities is largely determined by the conditions of its financing, the level of technological development of industrial production, and the innovative activity of enterprises. Table 2 shows the cost of environmental protection and rational use of natural resources by the main types of economic activity, the volume of payments for negative impact on the environment (NEI).
According to Table 2 for the period 2010–2019, the proportion of the extractive industry in current environmental control costs decreased from 34.4 to 10%. In the manufacturing industry, the dynamics of this indicator is also declining, the proportion of current costs decreased by half (to 21.5%). The growing dynamics of current environmental costs in the energy industry draws attention, their proportion has increased by more than 4-fold. As a whole for the Komi Republic, current environmental costs as a percentage of GRP decreased from 0.70% to 0.53% (similar indicators of 2019 for NWFD – 0.34%, the Russian Federation – 0.36%) for the period under review.
The largest volume of investment in fixed capital environmental protection at the regional level was directed in the period 2013–2016 (1.4– 1.9% to GRP), but in subsequent years investment decreased to 0.7%. The mentioned period of high results is provided at the expense of investments in
Table 2. Environmental protection costs and rational use of natural resources by industries in 2010–2019 (Komi Republic)
|
Indicators |
2010 |
2011 |
2012 |
2013 |
2014 |
2015 |
2016 |
2017 |
2018 |
2019 |
|
Current environmental control costs |
||||||||||
|
Komi Republic, million rubles |
2,330 |
1,757 |
1,621 |
2,085 |
2,019 |
2,038 |
2,611 |
3,178 |
3,457 |
3,787 |
|
Extraction of mineral resources, % |
34.4 |
32.5 |
10.5 |
9.0 |
11.1 |
7.6 |
15.7 |
15.0 |
13.1 |
10.0 |
|
Manufacturing industries, % |
45.0 |
40.2 |
31.9 |
39.6 |
32.2 |
32.9 |
24.6 |
22.4 |
23.0 |
21.5 |
|
Production and distribution of electricity, gas and water, % |
9.0 |
15.7 |
38.4 |
47.0 |
39.6 |
43.3 |
44.2 |
44.1 |
46.6 |
38.9 |
|
Investments in fixed capital aimed at environmental protection and rational use of natural resources |
||||||||||
|
Komi Republic, million rubles |
1,519 |
384 |
2,717 |
6,963 |
6,844 |
9,937 |
8,723 |
5,867 |
9,609 |
5,117 |
|
Extraction of mineral resources, % |
10.8 |
25.3 |
68.7 |
96.1 |
90.1 |
93.8 |
85.8 |
56.1 |
18.2 |
8.0 |
|
Manufacturing industries, % |
86.6 |
66.7 |
25.1 |
2.6 |
8.5 |
4.9 |
6.2 |
38.7 |
80.7 |
79.3 |
|
Production and distribution of electricity, gas and water, % |
- |
- |
0.1 |
0.06 |
0.8 |
0.2 |
0.29 |
0.35 |
0.25 |
0.95 |
|
Payments for negative environmental impact |
||||||||||
|
Komi Republic, million rubles. |
212.8 |
248.5 |
485.1 |
883.1 |
1,316.6 |
677.9 |
588.2 |
99.6 |
67.4 |
65.4 |
|
Komi Republic, % to the volume of investments |
14.0 |
64.7 |
17.9 |
12.7 |
19.2 |
6.8 |
6.7 |
1.7 |
0.7 |
1.3 |
|
Source: compiled according to: 1 – Stat. Coll. “Industrial production in the Komi Republic” for the period 2011–2019. Komistat; 2 – reports “On the state of the environment in the Komi Republic” for the period 2010–2019. |
||||||||||
the extractive industry. According to quantitative indicators, the contribution of this industry to the investment of fixed capital for environmental purposes in 2012–2017 is 85.8–96.1%, in 2019 – 8%. The high proportion of manufacturing investment is in 2010–2011 and 2018–2019. Throughout the entire period, investments in the energy sector grew dynamically, but within a range of no more than 1%.
From 2010 to 2015 in the structure of investment costs of the Komi Republic is dominated by investments in the protection of the atmosphere, amounting to 57–93%, their proportion is significantly reduced in the subsequent 2016– 2018 years and resources are mostly directed to the protection and rational use of water resources and waste management activities. In 2019, the proportions of costs for the three main environmental areas “water–air–waste” are the most balanced and amount to 38, 30 and 32%, respectively. We should note that the main sources of financing of investments in fixed capital aimed at environmental protection and rational use of natural resources are own funds of organizations (98%).
Since production activities involve compensation for environmental damage, Table 2 provides data on the gross receipts of payments for negative environmental impact (in total to the budgets of different levels). Relative to investments, the size of these payments decreased significantly and according to 2019 data, it is 1.3%, but this does not indicate an improvement in the environmental situation, given that the amount of excess payments is higher than the impact fee within the established standards by 3–4-fold and more. Based on the fact that the funds spent from the Komi Republic budget on environmental protection are tenfold lower than the incoming payments for NEI, we can conclude that the payments do not stimulate the process of investing in fixed capital, aimed at environmental protection and rational use of natural resources.
The dynamics of innovation indicators of basic industries and the economy in the Komi Republic as a whole is characterized by a decrease in innovation activity of the proportion of enterprises engaged in technological innovation, the proportion of innovative products. Their level is lower in comparison with similar indicators in the NWFD and the RF. At the same time, one should note that the indicator “advanced production technologies used” demonstrates double growth (2010 – 550 units, 2019 – 1156 units).
In 2015–2019 innovation activities in the Komi Republic are mainly aimed at pollution abatement. The proportion of enterprises participating in this area has increased from 80.0 to 83.3%. Along with this, the proportion of enterprises, that implement environmental innovations to reduce energy costs from 80.0% to 50.0% and material costs from 60.0% to 33.3%, to reduce the emission of CO 2 into the atmosphere from 60.0% to 16.7%, decreased. A comparison of these results with data for NWFD and RF shows that the level of participation in the Komi Republic is lower for all aspects of environmental innovation (except for the reduction of environmental pollution).
From the above it follows that approaching the sustainable decoupling state of the basic industries is possible with positive economic growth accompanied by increased environmental protection and innovation activities, ensuring the reduction of the environmental burden.
Conclusion
Summarizing the results of the study, we should note that during the period under consideration 2010–2019, the economic growth of the basic industries of the republic is characterized by instability, conditioning the variable nature of resources consumption and environmental impact. Approbation of Tapio’s Decoupling Diamond method showed the possibility of using this model at the industry level to assess the state of eco-economic relations. The advantages of the model lie in the ability to perform a more in-depth analysis revealing the following forms of decoupling: strong and strong negative – with negative elasticity coefficient (Ke); weak and recessive negative – Ke within 0–0.8; weak negative and recessive decoupling – Ke more than 1.2; expansive or recessive relationship – Ke within 0.8–1.2.
In accordance with the given gradation of the elasticity coefficient, the period under study relative to 2010 for the basic industries of the republic is characterized by environmental disadvantage in relation to wastewater discharge and is characterized by the identification of a “weak negative decoupling” effect, existing as a result of higher rates of wastewater discharge growth relative to the growth of GVA. In the energy industry, there is also a “weak decoupling” effect in the direction of production waste generation, due to their growth rate, which is lower than the increase in GVA.
Decoupling analysis of the annual period intervals revealed a recessive relationship in the extractive industry in the context of a decrease in GVA and wastewater discharges at the same rate (2014), when the elasticity coefficient is within 0.8– 1.2, with a positive increase in these indicators in
2019 an expansive relationship is recorded. In other industries, no such relationship has been detected.
Analysis of the dynamics of current costs and investments in fixed capital aimed at environmental protection and the rational use of natural resources, their structure by type of economic activity and the main directions of environmental protection activities and funding sources revealed a downward trend in both current and investment costs in the mining and manufacturing industries and at the same time a slight increase in the proportion of the energy sector, not exceeding 1%. From the analysis of payments for negative impact on the environment, it follows that payments for excessive pollution are 3–4 and more times higher than charges for pollution of the environment within the established standards, which is consistent with the decoupling analysis of the unfavorable situation in the field of waste water treatment. At the same time, the funds spent from the budget of the republic on environmental protection are tenfold lower than the incoming NEI payments, which indicates the need to develop a mechanism for directing them to the maximum extent into investment in environmental protection, into the implementation of projects of transition to the best available technologies.
References Identifying the effect of decoupling in major economic sectors of the Komi Republic
- Akulov A.O. (2014). Regional environmental impacts of coal industry and development prospects according to a decoupling model. Region: ekonomika i sotsiologiya= Region: Economics and Sociology, 1(81), 272–288 (in Russian).
- Bleischwitz R. (2010). International economics and economic policy. Relevance, measurement, empirical trends, innovation, resource policies. Special issue on “The International Economics of Resources and Resource Policy” (Springer Publisher), 7(2–3), 227–244. DOI: 10.1007/s10368-010-0170-z
- Bobylev S.N., Mikhailova S.M., Kiryushin A.P. et. al. (2019). Zelenaya ekonomika i tseli ustoichivogo razvitiya dlya Rossii [Green Economy and the Sustainable Development Goals for Russia]. Moscow: MSU Faculty of Economics.
- Bringezu S., Ramaswami A., Schandl H., O’Brien M. et al. (2017). Аssessing global resource use: A systems approach to resource efficiency and pollution reduction. In: A Report of the International Resource Panel. UNEP, Nairobi, Kenya. Available at: https://www.resourcepanel.org/ reports/assessing-global-resource-use.pdf (accessed: May 12, 2020).
- Eisenmenger N. et al. (2020). The sustainable development goals prioritize economic growth over sustainable resource use: A critical refection on the SDGs from a socio ecological perspective. Sustainability Science, 15, 1101–1110. DOI: 10.1007/s11625-020-00813-x
- Finel N., Tapio P. (2012) Decoupling transport CO2 from GDP, Finland futures research center. University of Turku, 11–12. Available at: https://www.utupub.fi/bitstream/handle/10024/147511eBook_2012-1.pdf?sequence=1&isAllowed=y (accessed: April 12, 2021).
- Haberl H. et al. (2020). A systematic review of the evidence on decoupling of GDP, resource use and GHG emissions, part II: Synthesizing the insights. Environmental Research Letters, 15(6). DOI: 10.1088/1748-9326/ab842a
- Hertwich E., Lifset R., Pauliuk S., Heeren N. (2020). Resource efficiency and climate change: Material efficiency strategies for a low-carbon future. In: A report of the International Resource Panel. United Nations Environment Programme, Nairobi, Kenya. Available at: https://www.resourcepanel.
- Jackson T. (2017). Protsvetanie bez rosta: Osnovy ekonomiki budushchego [Prosperity without Growth: Foundations for the Economy of Tomorrow]. Moscow: Ast-Press.
- Kozhevnikov S.A., Lebedeva M.A. (2019). Problems of transition to green economy in the region (Based on materials of the European North of Russia). Problemy razvitiya territorii=Problems of Territory’s Development, 4(102), 72–88. DOI: 10.15838/ptd.2019.4.102.4 (in Russian).
- Krausmann F. et al. (2017). Material flow accounting: Measuring global material use for sustainable development. Annual Review of Environment and Resources, 42, 647–675. DOI: 10.1146/annurev-environ-102016-060726.
- Oberle B., Bringezu S., Hatfield-Dodds S., Hellweg S., Schandl H., Clement J. et al. (2019). Global resources outlook 2019: Natural resources for the future we want. In: Report of the International Resource Panel. United Nations Environment Programme. Nairobi, Kenya. Available at: https://www.resourcepanel.org/reports/global-resources-outlook (accessed: May 10, 2020).
- Parrique T. et al. (2019). Decoupling debunked – Evidence and arguments against green growth as a sole strategy for sustainability. European Environmental Bureau.
- Shkiperova G.T. (2014). Analysis and modeling of relationship between economic growth and environmental quality (The case of the Republic of Karelia). Ekonomicheskii analiz: teoriya i praktika=Economic Analysis: Theory and Practice, 43(394), 41–49 (in Russian).
- Stocker A., Gerold S., Hinterberger F. et al. (2015). Тhe interaction of resource and labour productivity. A scoping study. Sustainable Europe Research Institute (SERI). Available at: https://ec.europa.eu/environment/enveco/growth_jobs_social/pdf/studies/Scientific%20background%20Resource%20labour%20productivity.pdf (accessed: May 12, 2021).
- Tapio P. (2005). Towards a theory of decoupling: Degrees of decoupling in the EU and the case of road traffic in Finland between 1970 and 2001. Transport Policy, 12(2), 137–151. Available at: doi.10.1016/j.tranpol.2005.01.001
- Tret’yakova E.A. (2019). Environmental intensity of economic growth in the Baltic Sea region. Baltiiskii region=The Baltic Region, 11(1), 14–28. DOI: 10.5922/2079-8555-2019-1-2 (in Russian).
- Vadén Т. et al. (2020). Decoupling for ecological sustainability: A categorisation and review of research literature. Environmental Science & Policy, 112, 236–244. DOI: 10.1016/j.envsci.2020.06.016
- Vehmas J, Kaivo-oja J, Luukkanen J. (2003). Global Trends of Linking Environmental Stress and Economic Growth. Turku: Finland Futures Research Centre, Available at: https://www.utupub.fi/bitstream/handle/10024/147391/Tutu_2003-7.pdf?sequence=1 (accessed: May 12, 2021).
- Ward J.D. et al. (2016). Is decoupling GDP growth from environmental impact possible? PLoS ONE, 11(10): e0164733. Available at: doi.org/10.1371/journal.pone.0164733
- Wiedenhofer D. et al. (2020). A systematic review of the evidence on decoupling of GDP, resource use and GHG emissions, part I: Bibliometric and conceptual mapping. Environmental Research Letters, 15(6). Available at: doi.org/10.1088/1748-9326/ab8429
- Wiedmann T., Lenzen M. et al. (2020). Scientists’ warning on affluence. Nature Communications, 11, 3107. DOI: 10.1038/s41467-020-16941-yе
- Yashalova N.N. (2014). Analysis of the decoupling effect in ecological and economic activity of a region. Regional’naya ekonomika: teoriya i praktika=Regional Economics: Theory and Practice, 39, 55–61 (in Russian).
- Zabelina I.A. (2019). Decoupling in environmental and economic development of regions-participants of cross-border cooperation. Ekonomicheskie i sotsial’nye peremeny: fakty, tendentsii, prognoz=Economic and Social Changes: Facts, Trends, Forecast, 12(1), 241–255. DOI: 10.15838/esc.2019.1.61.15 (in Russian).
- Wiedenhofer D. et al. (2020). A systematic review of the evidence on decoupling of GDP, resource use and GHG emissions, part I: Bibliometric and conceptual mapping. Environmental Research Letters, 15 (6). Available at: doi.org/10.1088/1748-9326/ab8429
- Wiedmann T., Lenzen M. et al. (2020). Scientists’ warning on affluence. Nature Communications, 11, 3107. DOI: 10.1038/s41467-020-16941-ye
