Image Compression and Reconstruction using Discrete Rajan Transform Based Spectral Sparsing

Author: Kethepalli Mallikarjuna, Kodati Satya Prasad, Makam Venkata Subramanyam
Journal: International Journal of Image, Graphics and Signal Processing(IJIGSP) @ijigsp
Article in issue: 1 vol.8, 2016.
Free access
As a contribution from research conducted by many, various image compression techniques have been developed on the basis of transformation or decomposition algorithms. The compressibility of a signal is seen to be affected by the entropy in the signal. Compressibility is high if the energy distribution is concentrated in fewer coefficients. It is reasonable to expect that sparse signals have a highly compressible nature. Thus, sparse representations have potential uses in image compression techniques. There are many techniques used for this purpose. As an alternative to these traditional approaches, the use of Discrete Rajan Transform for sparsification and image compression was explored in this paper. The simulation results show that higher quality compression can be achieved for images using Discrete Rajan Transform in comparison with other popular transforms like Discrete Cosine Transform, and Discrete Wavelet Transform. The results of the experiment were analyzed on the basis of seven quality measurement parameters – Mean Squared Error, Peak Signal to Noise ratio, Normalized Cross-Correlation, Average Difference, Structural Content, Maximum Difference, and Normalized Absolute Error. It was observed that Discrete Rajan Transform is effective in introducing sparsity in images and thereby improving compressibility.
Average Difference, Discrete Rajan Transform, Image Compression, Maximum Difference, Normalized Absolute Error, Normalized Cross-Correlation, Structural Content
Short address: https://sciup.org/15013944
IDR: 15013944
Text of the scientific article Image Compression and Reconstruction using Discrete Rajan Transform Based Spectral Sparsing
With the advancements in communication networks, one can witness an increase in the transmission of digital multimedia and images around the world [1-2]. In general, images are considered to have a large amount of information that is redundant and thus the transmission process can be improved by implementing compression techniques. The major benefit of compression is that it reduces the data storage requirements. It also offers an attractive approach to reduce the communication cost in transmitting high volumes of data over long-haul links via higher effective utilization of the available bandwidth in the data links. This considerably aids in reducing the cost of communication due to the data rate reduction. Because of the data rate reduction, data compression also increases the quality of multimedia presentations through limited-bandwidth communication channels [3]. Compression techniques help ease image and multimedia and similar such transmissions [4-8]. This has led to a reduction in the costs involved in storage in the past few decades. However, on the consideration of the large amount data storage and transmission requirements, the pace of development is still far from our expectations [9]. In order to achieve maximum information content with minimum storage requirements for various types of data, many novel techniques have been developed and proposed. There are basically two categories of compression techniques- lossless and lossy compression. Lossless compression, as the name implies, is the technique that involves no loss of data during the compression process and the pre-compressed signal can be restored. In contrary to the Lossless compression technique, Lossy compression technique involves loss of data [10]. Lossy compression algorithms are generally developed according to contrast sensitivity function of human visual system. Lossy techniques emphasize preservation of contrast only and thus provide higher compression ratio[11].Lossy compression usually involves having a trade-off between information loss and compression ratio. These lossy techniques are widely used in signal processing applications that involve digital images or audio. The Joint Photographic Experts Group (JPEG) standardized the concept of transforming image to the frequency domain in order to filter out noise components in an effort to achieve greater compression[9][12]. The speed of computation has always been considered as a weak link in the area of data compression. However, the currently evolving technology has forced onto focusing on limitations in storage capacity. The cost of memory involved in archiving documents or photographs or multimedia is high and this has influenced the zeal of researchers to develop efficient information reduction algorithms or techniques. As the technology in image processing systems, advances, such as greater resolutions and color definitions, the information stored in image files increases dramatically [13]. There have been many image compression coding techniques that have been developed based on transformation or decomposition algorithms and are also been put into practical use [9][14-17]. However, even though the algorithms that are based on transformation techniques can help achieve compression, complex calculation and processing time is a major drawback [18].
By using image coding techniques, one can achieve high compression ratio along with low distortion characteristics. As images are complex in nature, there is no existing transform in the literature that can optimally and efficiently represent the content in the image. For example, for an image which has an oscillatory texture, the performance of Fourier transform is better in terms of providing a sparse representation. Similarly, the Discrete Wavelet Transform (DWT) gives better performance if the image has isolated singular textures [19]. This fundamental concept led to a development of many algorithms. There are many algorithms which are standard and widely used in the field of image compression. The JPEG2000 standard is the most popular among these techniques and it is based on the basic fact that the images have a certain sparsity associated with them when they are represented by wavelets [19-22]. As an alternative to these traditional approaches, the use of Discrete Rajan Transform (DRT) for sparsification and image compression has been explored. This paper presents a comparison of DRT with widely used transforms- Discrete Cosine Transform (DCT) and DWT in terms of performance in image quality measurement parameters.
-
II. Related work
The authors in [23] compared and made an analysis of image compression metrics using transform-based compression, especially the wavelet transform. They used different wavelets like Haar, Daubechies, Coiflet, Symlet and Biorthogonal wavelets etc on various grayscale and color images. Nineteen different wavelet transform basis functions were analyzed. In the case of color images, it was observed that Biorthogonal family wavelet Bior3.3 and Symlet family wavelet Sym6 produced better PSNR value of order 27.0686. It was concluded that each wavelet filter had a different performance for different fidelity metrics and different images and that the performance was related to the content in the image. Every time, for a different image, a proper wavelet function has to be the content of the image. Therefore it is appropriate to tailor chosen for achieving desired quality of reconstructed image.
DRT was previously used for sparsing speech data and compressing it in the spectral domain. It was applied to voice data and the resulting spectrum was sparsed by retaining its first component CPI (Cumulative Point Index) and forcing the other spectral components to zero. Thus, the spectrum was compressed to a maximum of 12.5% of the original data. As and when required the compressed spectrum could be synthesized using Inverse Discrete Rajan Transform and the reconstructed speech data analyzed for speaker recognition [24].
In this paper, DRT is used to sparse and compress the image data. DRT is applied to each 8-element block of the image and the resulting each 8-element spectrum is sparsed by retaining the first component (CPI-Cumulative Point Index) and a mid-spectral component. The other spectral coefficients are forced to zero. Then the compressed algorithm (Run-length encoding) is applied on the sparsed image to obtain compressed image. As and when required the compressed spectrum could be decompressed using run-length decoding and Inverse DRT.
-
III. Sparsification of Image using DRT
Rajan Transform (RT) is a variant of Hadamard Transform which was initially developed for the purpose of pattern recognition. RT has a homomorphic nature and it is permutation invariant. It is because of this property that RT has potential applications in pattern recognition algorithms like thinning, edge detection, contour detection, and detection of curves and lines in images and isolation of certain points in images [25-26]. Unlike RT, the generalized DRT has been moulded to exhibit isomorphism when the auxiliary phasor information associated with the spectrum is known apriori. The principle of DRT has been explained by the authors in [27].
With the help of DRT algorithm, both lossless and lossy sparse representation can be obtained. For several input signals, the transformed signal output obtained from DRT was observed. It was found that almost 23% of it was zero coefficients and many of the remaining coefficients were nearly zero. Thus, there is a possibility of achieving better sparse output by using DRT. However, there would have to be a trade-off between data recovery and the energy required for it. Hence, this transform was applied for images to exploit its sparsing nature. Different input grayscale images of dimension 512×512 have been considered. Each of the input images was divided into pixel blocks of size 8 and DRT was applied to it and the degree of sparsity associated with the transformed signal output has been calculated. Also, the scope of achieving the maximum possible sparsity has been analyzed by applying thresholding function, which, however, would result in loss of information in the signal. On the simulation of DRT on Lena image, out of the total 512×512 pixels, 9610 zero valued or (N-K) sparse pixels are obtained. The degree of sparsity obtained by considering just the output transformed signal of DRT is 3.7% or nearly 4%. Similarly for the ‘cameraman’ image,
103078 number of (N-K) sparse or zero valued coefficients were obtained. The degree of sparsity obtained for the cameraman image is 3.93% or nearly 4%. For the ‘pepper’ image also, a similar trend is observed. This is perfectly lossless and the original image can be recovered with infinite Peak Signal to Noise Ratio- PSNR (since no errors exist in this case). Depending upon the trade off that can be accepted by the end user, various levels of sparsity can be achieved. However, the sparsest representation possible using DRT is when only the CPI of each of the blocks is considered i.e. the information present in each of the pixels in each block is represented by only one pixel and thus the total image can be represented by only fewer numbers of pixels. In this case, for all the three images under consideration, the total number of zero coefficients possible is (512×512) – (64×64) i.e. 258048 and the maximum achievable degree of sparsity would be 98.44%. However, a considerable amount of information loss can be expected. To visualize the impact of the sparse representations, the image is reconstructed using Inverse DRT process. The PSNR (in decibels) for the lossy case mentioned above is found to be 20 and 24 respectively. There is always a scope to improve the PSNR or compress the signal by applying relevant algorithms. Application of DRT in perspective of sparse representation achievable has been focused on. Individual algorithms that help in improvising the PSNR and compressibility can always be employed. There is always a scope to improve the degree of sparsity of the signal obtained by considering only the Cumulative Point Index (CPI) values. However, the compromise would be the loss of information in the signal.
-
IV. Image Compression Using Drt
For the purpose of improving sparse representation, a special case of DRT can be used wherein the auxiliary phasor information in each stage is considered as 1. Considering the lossy case, even higher degree of sparsity can be obtained using (i) Cumulative Point Index (CPI, the first spectral component) values and (ii) CPI along with the mid-spectral component of DRT transformed output at different block lengths. But, in this case, a compromise has to be made to information loss in the signal [26]. DRT has potential applications in image processing and compression. In this paper, the application of DRT to obtain a sparse representation and compression of images is considered. Standard images have been considered and to make the DRT processing easier, the image has been divided into blocks of size 8. DRT is applied to it and the special case of DRT, as mentioned earlier, is considered.
The block diagram for image compression using sparsifying transform- DRT is shown in fig.1. The sequence of steps used in the algorithm for image compression using DRT is as given below:
-
1) Input Image (W x W)
-
2) Convert Image as a row of length W2
-
3) Scan the Image in blocks each of length 8
-
4) Apply DRT to the chosen vector and obtain the
DRT spectral sequence
-
5) Preserve the Cumulative Point Index (CPI) value
and the mid spectral component value in the spectral sequence and force other elements to zero.
-
6) Repeat the same process until the entire image is scanned and processed
-
7) Resulting sequence is the sparsified spectral
sequence
-
8) Apply Run Length Encoding (RLE) and compute
the Compression Ratio
-
9) Apply decryption algorithm to obtain the spectral sequence
-
10) Apply Inverse DRT to reconstruct the image
-
11) Calculate Mean-Squared Error (MSE), Peak Signal-to-Noise Ratio (PSNR), Normalized Cross
Correlation (NCC), Average Difference (AD), Structural Content (SC), Maximum Difference (MD), and Normalized Absolute Error (NAE) for this reconstructed image with respect to the Original Image.
A similar algorithm is used for the case of DCT and DWT. The results thus obtained have been presented in the following section.
-
V. Image Quality Measurement Parameters
In this section, a brief introduction to the quality measurement parameters used for the comparison of DRT with DCT and DWT has been discussed. It is a well-known fact that digital images can contain a variety of distortions while acquiring the image, or processing it or during compression and storage. Distortions may also be introduced during transmission and reconstruction process. In whatever way distortions occur, the outcome would be degradation in visual quality. In applications, wherein the image outcomes are to be analyzed or viewed by a human, subjective evaluation method is used. The drawback of this technique is that it is time-consuming, complex and expensive. However, in objective image quality assessment, quantitative measures are used to predict the image quality automatically. The classification in Objective image quality metrics is done based on the availability of original image which is free from any sort of distortions and comparison is made between the distorted and the original image. One such is the Full Reference approach, wherein the original or reference image is assumed to be known apriori. Practically, a reference image is not always available and a blind quality assessment approach is done. The commonly used and simplest full-reference quality metric is the MSE and PSNR. These involve simple calculations and they have a distinct physical meaning that makes logical sense. But they are not very well matched to perceive visual quality [28-37].
The seven quality measurement parameters used in this paper to assess the quality of the reconstructed image are given below:
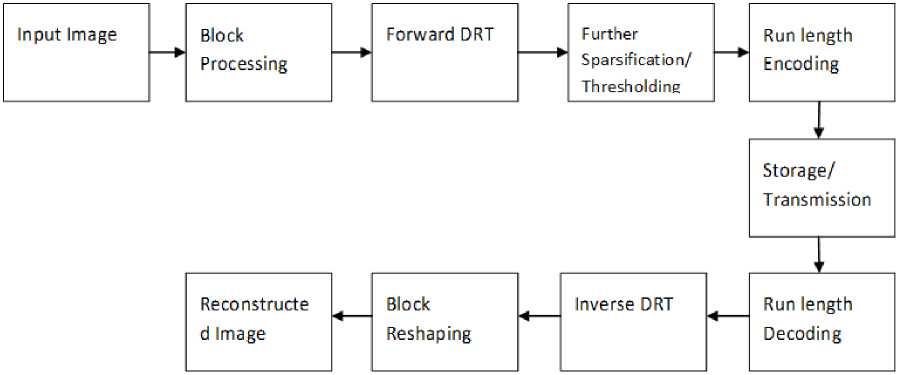
Fig.1. Block Diagram of Image Compression Using DRT
-
A. Mean-Squared Error (MSE):
Mean-squared error is the sum over all squared value differences divided by image size. For a two-dimensional image of size (M x N), MSE is given by the following equation
MN 2
MSE = MN § § f I ( x , y ) - 1 ( x , y ) ]
Here I(x, y) is the original image and I'(x, y) is the reconstructed image. If the value of MSE is lower, it implies that there is less number of errors in the reconstructed signal.
-
B. The Peak signal to noise ratio (PSNR):
It gives a measure of the peak error in the reconstructed image. The equation of PSNR is given below:
PSNR = 10iog10
' 255 2 '
v MSE v
It can be seen that there is an inverse relation between MSE and PSNR. Lower the MSE, higher is the PSNR. A higher value for PSNR is desirable as it literally means that the ratio of signal to noise is more.
-
C. Normalized Cross-Correlation (NCC):
It is a widely used metric that helps in evaluating the degree of similarity or dissimilarity between the original and reconstructed image. The value of NCC usually ranges between -1 to 1. The value 1 indicates that the alignment of the images is exact in the time series, however, the amplitude may vary [38-41]. The equation for NCC is given below:
MN gg I(x- y )• I (x, У )
NCC = ^=1 (3) MN 2
gg [ I ( x , У ) ]
x = 1 y = 1
-
D. Average Difference (AD):
It is defined as follows:
Error = (Original Image – Reconstructed Image), AD = Error / (M*N).
In other words,
MN
AD = ZZ [ 1 ( x , y ) - I ( x , y ) ] (4)
MN x = 1 y = 1
-
E. Structural Content (SC):
Structural content identifies the degree of matching in the images. The more the regions common in both the original and reconstructed images, the more is the similarity between them [37]. The equation for SC is given below:
MN 2
Ц[ I ( x , y ) ]
SC = -^=------
MN 2
ZZ [ I < x - y ) ]
x = 1 y = 1
-
F. Maximum Difference (MD):
It gives the variation of the method of paired comparisons [37].
MD = Max (| I ( x, y ) — I ( x, y )| )
-
G. Normalized Absolute Error (NAE):
This gives the numerical difference between the original and the reconstructed image [37].
NAE =
MN
ZZ| I(x, y) - I'(x, y)| x=1 y=1
MN
ZZ I ( x , y )
x = 1 y = 1
-
VI. Simulation Results
For the purpose of simulation, different input grayscale images (Lena, Cameraman, and Peppers, etc...) of dimension 512×512 have been considered. Each of the input images was divided into 1×8-pixel blocks and DRT was applied to it and the degree of sparsity associated with the transformed signal output has been calculated. Also, the scope of achieving the maximum possible sparsity has been analyzed by applying thresholding function, which, however, would result in loss of information in the signal. On the simulation of DRT on Lena image, out of the total 512×512 pixels, 9610 zero valued or (N-K) sparse pixels are obtained. The degree of sparsity obtained by considering just the output transformed signal of DRT is 3.7% or nearly 4%. Similarly for the ‘cameraman’ image, 103078 number of (N-K) sparse or zero valued coefficients were obtained. The degree of sparsity obtained for the cameraman image is 3.93% or nearly 4%. For the ‘pepper’ image also, a similar trend is observed. This is perfectly lossless and the original image can be recovered with infinite PSNR (since no errors exist). Further sparse representation of the transformed signal can be obtained by applying thresholding function. After thresholding (threshold T=0) was considered for the Lena image, 134568 samples could be approximated to zero. The degree of sparsity that could be obtained is 51.3%. Similarly for the cameraman image, the number of samples that could be approximated to zero is 180273 and the degree of sparsity achieved is 68.7% and for the pepper image, the number of zero coefficients obtained is 131959; achieved degree of sparsity being nearly 51%. However, this would lead to loss of information in the image and thus can be classed as lossy. The transformed output from DRT was sparsified as mentioned above and RLE (Run Length Encoding) encryption technique was applied. This step was introduced so as to obtain more compression. To have a visual perception of the sparsity and the amount of information loss, the decryption algorithm was applied and reconstruction using IDRT has been done. For the purpose of comparison, DCT and DWT have been considered alongside DRT.
The simulation results were analyzed on the basis of seven quality measurement parameters – Mean-Squared Error (MSE), Peak Signal to Noise ratio (PSNR), Normalized Cross-Correlation (NCC), Average Difference (AD), Structural Content (SC), Maximum Difference (MD), and Normalized Absolute Error (NAE).
These seven parameters were analyzed for a set of 7 images and it was found that DRT gives better image quality in comparison with other candidate transforms. The observations for the seven different bench mark images have been tabulated in Table 1.
From the table 1, it can be noticed that the compression ratio obtained by using DRT for all the images is consistent and numerically higher compare to other candidate transforms considered in the experiment. Lower MSE can directly imply higher PSNR. It can be observed that the MSE for DRT is least compare to other transforms. Since the MSE for DRT is least, a high PSNR is observed. The NCC for DRT has the values closer to the ideal value of 1. Hence, it can be considered that the performance of DRT is better. The average difference in the coefficients obtained with DRT is least compare to the other transforms. Structural Content is closer to unity in case of DRT compare to other transforms. The metric of Maximum Difference in the coefficients is least for DRT compare to other transforms. The normalized absolute error is least for DRT compare to other transforms.
The simulation results illustrate that the proposed compression algorithm based on DRT is superior to the DCT and DWT both in the visual quality and all seven quality measurement parameters.
The reconstructed images with three different transforms are displayed in fig. 2.
-
VII. Conclusion
As an alternative to these traditional approaches, the use of Discrete Rajan Transform (DRT) for sparsification and image compression was explored. The Inverse Discrete Rajan transform (IDRT) can be used to retrieve the input image. DRT displays invariance to cyclic shifts, dyadic shifts graphical inverse of input signals. DRT has some limitations.
The performance of DRT is dependent on the correlation value of the data set i.e., if the samples in the input data are more correlated (eg. image), the performance of DRT is better. The performance of DRT is a linear function of the degree of correlation in input data.
Our results illustrate that we can achieve higher quality compression of images with DRT. We also observe that although RLE is lossless method and keeps the image quality well but it cannot be applied to all types of images as it lowers compression ratio to a certain extent.
For a slightly poor compression ratio, DRT yielded higher quality image than the other candidate transforms used.
Table 1. Simulation Results
|
Mean Square Error |
Peak Signal to Noise Ratio |
Normalized CrossCorrelation |
Average Difference |
Structural Content |
Maximum Difference |
Normalized Absolute Error |
Compression Ratio |
||
|
Lena Image |
DWT |
1.3269e+04 |
6.9023 |
0.1267 |
193.3192 |
12.3267 |
255 |
0.8809 |
48.2468 |
|
DCT |
129.5269 |
27.0072 |
0.5073 |
100.2788 |
3.1080 |
227 |
0.5226 |
48.9304 |
|
|
DRT |
55.0869 |
30.7203 |
0.5079 |
100.1467 |
3.0904 |
227 |
0.5226 |
49.3568 |
|
|
Boat Image |
DWT |
1.4255e+04 |
6.5912 |
0.2499 |
97.3150 |
4.0021 |
255 |
0.7503 |
49.0181 |
|
DCT |
243.1366 |
24.2723 |
0.9876 |
0.0037 |
1.0122 |
151 |
0.0727 |
49.3683 |
|
|
DRT |
103.2301 |
27.9927 |
0.9954 |
-0.1242 |
1.0037 |
120 |
0.0467 |
49.6521 |
|
|
Zelda Image |
DWT |
7.4625e+03 |
9.4019 |
0.2503 |
68.3464 |
3.9950 |
185 |
0.7497 |
48.3963 |
|
DCT |
61.7036 |
30.2277 |
0.9939 |
0.0080 |
1.0061 |
108 |
0.0532 |
48.8831 |
|
|
DRT |
24.1837 |
34.2956 |
0.9987 |
-0.1246 |
1.0001 |
72 |
0.0333 |
49.5102 |
|
|
Baboon Image |
DWT |
1.3833e+04 |
6.7218 |
0.2510 |
96.7626 |
3.9839 |
230 |
0.7492 |
49.5232 |
|
DCT |
657.3608 |
19.9528 |
0.9687 |
0.0013 |
1.0278 |
161 |
0.1358 |
49.7063 |
|
|
DRT |
421.6507 |
21.8813 |
0.9780 |
-0.1249 |
1.0215 |
128 |
0.1074 |
49.7986 |
|
|
Cameraman Image |
DWT |
2.4370e+04 |
4.2623 |
0.2518 |
125.0226 |
3.9710 |
255 |
0.7489 |
48.0988 |
|
DCT |
503.7334 |
21.1088 |
0.9853 |
0.0066 |
1.0140 |
208 |
0.0645 |
48.9868 |
|
|
DRT |
266.3418 |
23.8764 |
0.9924 |
-0.1212 |
1.0070 |
159 |
0.0446 |
49.1974 |
|
|
Barbara Image |
DWT |
1.2563e+04 |
7.1399 |
0.2506 |
87.9941 |
3.9911 |
245 |
0.7496 |
48.7633 |
|
DCT |
348.1860 |
22.7127 |
0.9804 |
0.0049 |
1.0187 |
132 |
0.0973 |
49.2279 |
|
|
DRT |
183.6054 |
25.4919 |
0.9899 |
-0.1235 |
1.0093 |
103 |
0.0672 |
49.5750 |
|
|
Peppers Image |
DWT |
1.0642e+04 |
7.8607 |
0.2482 |
78.2574 |
4.0290 |
229 |
0.7510 |
48.7129 |
|
DCT |
184.9679 |
25.4598 |
0.9874 |
0.0045 |
1.0123 |
160 |
0.0691 |
49.2165 |
|
|
DRT |
82.4123 |
28.9709 |
0.9951 |
-0.1234 |
1.0040 |
115 |
0.0450 |
49.4339 |
|
While the DCT gives better compression ratio compared to DRT, image quality degrades because of the artifacts that result from the transform. Though the DWT provides better compression ratio compared to DCT and DRT but the image quality degrades with very poor PSNR. Thus DRT is superior to the DCT and DWT both in the visual quality and all seven quality measurement parameters.
Acknowledgment
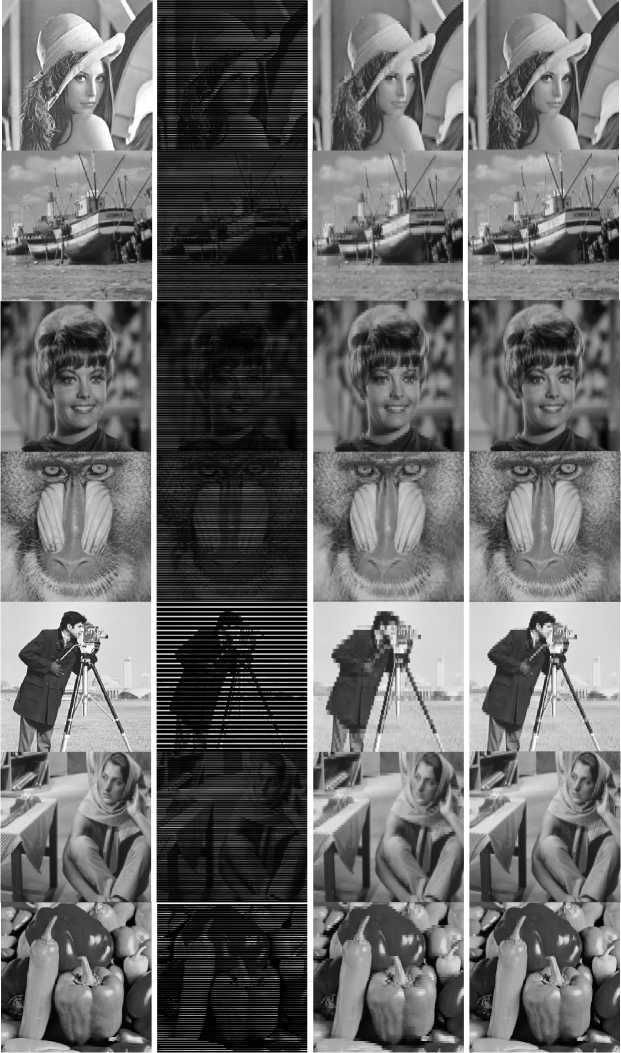
(a) (b) (c) (d)
Fig.2. Simulation Results: Column (a): Original Images; Column (b): DWT Reconstructed Images; Column(c): DCT Reconstructed Images; Column (d): DRT Reconstructed Images
References Image Compression and Reconstruction using Discrete Rajan Transform Based Spectral Sparsing
- Guibin Zhu, Changxiu Cao, Zhongyu Hu, Shibiao He, Sen Bai, " Digital image scrambling encryption algorithm based on affine transformation[J]", Aided Design and Computer Graphics, Vol.15, No.6,2003, pp. 711-713.
- K.S.Thyagarajan, "Still Image and Video Compression with MATLAB", A John Wiley & Sons, INC., Publication, 2011. ISBN: 978-0-470-48416-6.
- Omid Nali, "High-speed Image Compression based on the Combination of Modified Self-Organizing Maps and Back-Propagation Neural Networks", International Journal of Image, Graphics and Signal Processing, 2014, 5, 28-35.
- En-hui Yang, Longji Wang, " Joint Optimization of Run-Length Coding, Huffman Coding, and Quantization Table With Complete Baseline JPEG Decoder Compatibility[J]", IEEE Transaction on Image Processing,2009,18(1):63-74. Available: http://dx.doi.org/10.1109/TIP.2008.2007609.
- Xia, X Li, L Zhou, K M Lam, "Visual sensitivity-based low-bit-rate image compression algorithm[J]", IEEE Transaction on Image Processing,2012,6(7):910-918. Available: http://dx.doi.org/10.1049/iet-ipr.2011.0174.
- Zhiwei Xiong, Xiaoyan Su, Feng Wu, "Block-Based Image Compression with Parameter-Assistant Inpainting [J]", IEEE Transactions on image processing, 2010, 19(6):1651-1657.Available: http://dx.doi.org/10.1109/TIP.2010.2044960
- D. S. Taubman and M. W. Marcellin, "JPEG2000: Image Compression Fundamentals Standards and Practice", Norwell, MA, USA: Kluwer Academic Publishers, 2002.
- M. Zhang, G. Shao and K. Yi, " T-matrix and Its Applications in Image Processing [J]", Electronics Letters, Vol.40, No.25, 2004, pp.1583-1584. Available: http://dx.doi.org/10.1049/el:20046517
- Huibin Chang, Michael K. Ng, and Tieyong Zeng, "Reducing Artifacts in JPEG Decompression Via a Learned Dictionary", IEEE Transactions On Signal Processing, Vol. 62, No. 3, February 1, 2014, 718-728. Available: http://dx.doi.org/10.1109/TSP.2013.2290508
- Li Zhiqianga, Sun Xiaoxin, Du Changbin, Ding Qun, "JPEG Algorithm Analysis and Application in Image Compression Encryption of Digital Chaos," Instrumentation, Measurement, Computer, Communication and Control (IMCCC), 2013 Third International Conference on, vol., no., pp.185,189, 21-23 Sept. 2013. Available: http://dx.doi.org/10.1109/IMCCC.2013.46
- Ashok Kumar, Rajiv Kumaran, "Implementation of Multi-Linear Gain Prior to Image Compression System in Remote Sensing Electro-Optical Payloads", International Journal of Image, Graphics and Signal Processing, 2015, 3, 51-57.
- Skodras A, Christopoulos C, Ebrahimi T, "The JPEG 2000 still-image compression standard," Signal Processing Magazine, IEEE Volume: 18, Issue: 5, 2001, Page(s): 36 - 58. Available: http://dx.doi.org/10.1109/79.952804
- Jackson .J.D Hannah S.J, "Comparative analysis of image compression techniques", System Theory, 1993, Proceedings SSST '93, Twenty-Fifth Southeastern Symposium on, pp.513-517, 7-9 Mar 1993. Available: http://dx.doi.org/10.1109/SSST.1993.522833
- Guangqi Shao, Yanping Wu, Yong A, Xiao Liu, and Tiande Guo, "Fingerprint Compression Based on Sparse Representation", IEEE Transactions On Image Processing, Vol. 23, No. 2, February 2014, 489-501. Available: http://dx.doi.org/10.1109/TIP.2013.2287996
- Tanaya Guha, Rabab K. Ward, "Image Similarity Using Sparse Representation and Compression Distance", IEEE Transactions on Multimedia, Vol. 16, NO. 4, June 2014, 980-987. Available: http://dx.doi.org/10.1109/TMM.2014.2306175
- Jing-Ming Guo, and Yun-Fu Liu, "Improved Block Truncation Coding Using Optimized Dot Diffusion", IEEE Transactions On Image Processing, Vol. 23, NO. 3, March 2014, 1269-1275. Available: http://dx.doi.org/10.1109/TIP.2013.2257812
- Chuan Qin, Chin-Chen Chang, and Yi-Ping Chiu, "A Novel Joint Data-Hiding and Compression Scheme Based on SMVQ and Image Inpainting", IEEE Transactions On Image Processing, Vol. 23, NO. 3, March 2014, 969-978. Available: http://dx.doi.org/10.1109/TIP.2013.2260760
- Shengli Chen; Xiaoxin Cheng; Jiapin Xu, "Research on image compression algorithm based on Rectangle Segmentation and storage with sparse matrix," Fuzzy Systems and Knowledge Discovery (FSKD), 2012 9th International Conference on, vol., no., pp.1904, 1908, 29-31 May 2012. Available: http://dx.doi.org/10.1109/FSKD.2012.6233969
- Elad Michael, 2010, "Sparse and Redundant Representations: From Theory to Applications in Signal and Image Processing", USA: Springer ISBN 978-1-4419-7011-4.
- Starck J.L, Murtagh F, Fadili J. M, 2010, "Sparse Image and Signal Processing: Wavelets, Curvelets, Morphological Diversity", New York: Cambridge University Press, ISBN-13: 978-0521119139 ISBN-10: 0521119138.
- W. Pennebaker and J. Mitchell, "JPEG Still Image Data Compression Standard", Norwell, MA: Kluwer, 1993.ISBN 0-442—01272-1.
- D. S. Taubman and M. W. Marcellin, "JPEG2000: Image Compression Fundamentals Standards and Practice", Norwell, MA, USA: Kluwer Academic Publishers, 2002.
- S.Sridhar, P.Rajesh Kumar, K.V.Ramanaiah, "Wavelet Transform Techniques for Image Compression-An Evaluation", I.J. Image, Graphics and Signal Processing, 2014, 2, 54-67.
- Prashanthi.G, Singh.S, Rajan.E.G, Krishnan.P. "Sparsification of voice data using Discrete Rajan Transform and its applications in speaker recognition", Systems, Man, and Cybernetics (SMC), 2014 IEEE international Conference on, pp 429-434, 2014.
- Ekambaram Naidu Mandalapu, Rajan E. G. 2009, "Rajan Transform and its Uses in Pattern Recognition", Informatica 33, pp. 213-220, 2009. http://www.informatica.si/PDF/33-2/22_Mandalapu %20%20Rajan%20Transform%20and%20its%20uses%20in%20Pattern%20R.pdf
- Govindarajan Prashanthi, 2012. "Signal Sparsification with Discrete Rajan Transform (DRT): Principles, Properties, and Applications", MSc, Staffordshire University, UK.
- Kethepalli Mallikarjuna, Kodati Satya Prasad, M.V.Subramanyam, "Sparse Representation Based Image Compression using Discrete Rajan Transform", International Journal of Applied Engineering Research", Vol. 10, No. 13, pp 33424-33429, 2015.
- B. Girod, "What's wrong with mean-squared error, in Digital Images and Human Vision", A. B. Watson, Ed. Cambridge, MA: MIT Press, 1993, pp. 207–220.
- P. C. Teo and D. J. Heeger, "Perceptual image distortion," in Proc. SPIE, vol. 2179, 1994, pp. 127–141.
- A. M. Eskicioglu and P. S. Fisher, "Image quality measures and their performance", IEEE Trans. Commun., vol. 43, pp. 2959–2965, Dec. 1995.
- M. P. Eckert and A. P. Bradley, "Perceptual quality metrics applied to still image compression," Signal Processing, vol. 70, pp. 177–200, Nov. 1998.
- S. Winkler, "A perceptual distortion metric for digital color video", in Proc. SPIE, vol. 3644, 1999, pp. 175–184.
- Z. Wang, "Rate scalable Foveated image and video communications", Ph.D. dissertation, Dept. Elect. Comput. Eng., Univ. Texas at Austin, Austin, TX, Dec. 2001.
- Z. Wang and A. C. Bovik, "A universal image quality index", IEEE Signal Processing Letters, Vol. 9, pp. 81–84, Mar. 2002.
- Z. Wang, "Demo Images and Free Software for a Universal Image Quality Index". [Online]. Available: http://anchovy.ece.utexas.edu/~zwang/research/quality_index/demo.html
- Z. Wang, A. C. Bovik, and L. Lu, "Why is image quality assessment so difficult," in Proc. IEEE Int. Conf. Acoustics, Speech, and Signal Processing, vol. 4, Orlando, FL, May 2002, pp. 3313–3316.
- Z. Wang, A. C. Bovik, H. R. Sheikh and E. P. Simoncelli, "Image quality assessment: From error visibility to structural similarity", IEEE Transactions on Image Processing, vol. 13, no. 4, pp. 600-612, Apr. 2004.
- J.P. Lewis, "Fast Normalized Cross-Correlation", Industrial Light and Magic.
- Shou-Der Wei and Shang-Hong Lai," Fast template matching algorithm based on normalized cross correlation with adaptive multilevel winner update", IEEE Transactions on Image Processing, Vol. 17, No. 11, Nov. 2008.
- Barbara Zitova, Jan Flusser, "Image registration methods: a survey", Image and Vision Computing 21 (2003), 977–1000.
- Raghavender Rao Y, Prathapani Nikhil, Nagabhooshanam E, "Application of Normalized Cross Correlation to Image Registration", International Journal of Research in Engineering and Technology (IJRET), Volume: 03 Special Issue: 05, May-2014.
