Image Fault Area Detection Algorithm Based on Visual Perception

Author: Peng-Lu, Yongqiang-Li, Yuhe-Tang, Eryan-Chen
Journal: International Journal of Image, Graphics and Signal Processing(IJIGSP) @ijigsp
Article in issue: 1 vol.3, 2011.
Free access
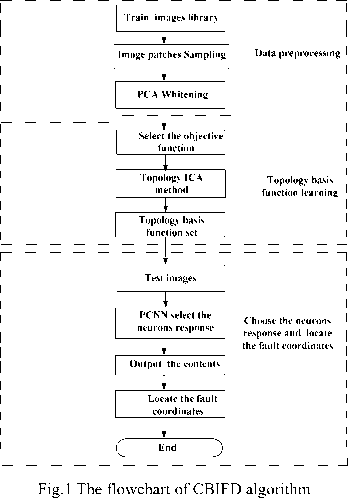
If the natural scenes decomposed by basic ICA which simulates visual perception then the arrangement in space of its basis functions are in disorder. This result is contradicted with physiological mechanisms of vision. So, a new compute model is proposed to simulate two important mechanisms of vision which are visual cortex receptive field topology construct and synchronous oscillation among neuron group. To solve the problem of train image fault detection, a novel algorithm was proposed based on above compute model. The experiment results show that, the algorithm can increase fault detection rate effectively compared with traditional methods which absence of above two important mechanisms of vision.
Visual perception, topology basis function, neuron response, fault detection
Short address: https://sciup.org/15012084
IDR: 15012084
Text of the scientific article Image Fault Area Detection Algorithm Based on Visual Perception
Published Online February 2011 in MECS
Animals’ vision system has high efficiency and characteristics of real-time in image fault detection which is incomparable with traditional methods such as based on gray, shape and texture characteristics [1-3] , image segmentation [4] , wavelet transform and neural network [5-6] , etc. So, it has great significance to simulate the visual perception mechanism as far as possible to accomplish a series of faults detection tasks, such as cracks, flaws, defects and so on that based on image faults.
From the view of natural image statistics, Independent Component Analysis (ICA) is one of the main methods to model early computational vision.
However, the space arrangement of basic functions (independent components of natural image) decomposed by basic ICA is chaotic and their amplitudes are uncertainty. This decomposition result is contradicted with physiological mechanisms of vision. To solve the image fault area detection problem; we put up a new model which based on topology mechanism [7] and synchronous oscillation mechanism [8-9] . We take the normal and fault images of the train as training data, and use topology ICA method to learn basic functions of images, thus we can obtained the independent components coefficient, and take them as neurons response. After that, we simulate synchronous oscillation mechanism for selecting the neurons that respond strong, and output its corresponding contents. Finally, we achieved image fault area location rapidly through automatic comparing.
-
II. THE TOPOLOGY BASIS FUNCTION
LEARNING AND NEURONS RESPONSE
SELECTING
A. The topology basis function learning
The main algorithm for features extracting of image is topology ICA. We chose the method proposed by Hyvarinen [10] to learn topology basic functions. The algorithm is motivated as follows: Allows the components correlate in a small area of h ( i , j ) , and independent outside the area. The correlation of basic functions is definite by energy correlation.
This work is supported by National Natural Science Foundation of
h ( i , j ) = 11
I 0 ,
if\* - j\ ^ m otherwise
m is area width. It definite an area of 3×3 when m=2, the components correlate in the area, and independent outside the area.
cov( s i 2 , s j 2 ) = E { s i 2 s j 2 } - E { s i 2 E { s j 2 } (2)
When cov(si2, Sj2) * 0 , the neurons response of si ands j are topology adjacent.
The optimum objective function is as follows:
Tn ( n^
logL(W) УУGI £h(i,j)(wTx(t))2 I i=1 j=1 I i=1
+ T log|det W | + cons tan t
Where G(•) is the nonlinear adjustment function, wi is the separate basic vectors, x (t) is the samples and T is the number of samples.
The i-th vector wi is updated as
A w i « E
{ z ( w T z ) i }
where n ( n , .
r = X h ( i , k ) g I S h ( k , j ) ( w T z ) k = 1 ( j = 1
B. The neurons response selecting
The synchronous oscillation mechanism which exists among neurons groups is another performance of visual system to adapt environment. We use pulse coupled neural network (PCNN) to simulate the synchronous oscillation mechanism [11]. When the internal activity Uij[n] is greater than dynamic threshold θij[n] , we set the activated neurons to 1 and output its corresponding content for fault detection.
Algorithm 1: topology basic functions learning algorithm
Input: Samples of train images
Output: Response matrix W and its corresponding basic functions A
Steps:
-
1) Random sampling to the images for obtains the training samples;
-
2) Whiten the samples by the principal component analysis (PCA) method, and takes the whitened data as the input data;
-
3) Calculate x according to the basic ICA model u = Wx ;
-
4) Update W according to formula (4), and make normalizes each base into a unit vector;
-
5) If norm ( A W ) < £ (error threshold), stop iteration;
-
6) Stop learning, output W and its corresponding original image space basic functions A.
Algorithms2: Fault area detection Algorithm
Input: A normal image and its corresponding fault image
Output: The contents expressed in the neurons which respond strongly
Steps:
-
1) Sequential and translational sampling to the images;
-
2) Whiten the sampled image patches using PCA ;
-
3) Compute W using the formula u = Wx ;
-
4) use PCNN to filter the response coefficients, and find out the best neural response;
-
5) Output the contents expressed in the neuron;
-
6) Compare the contents expressed by the neurons from normal image and its corresponding fault image and locate fault area.
the others to 0.
Y j [n] =
1,Uy[n] > 9 j [n]
0,U j [n] < 9 y [n]
-
III. IMAGE FAULT AREA DETECTION ALGORITHM
Based on the model of visual perception, we proposed a CBIFD (content-based image fault area detection) algorithm for image fault area detection. The new algorithm is motivated as follows: First, learn neurons receptive fields from the image sequence of the train. Then calculate the neural response of normal image and fault image, and use PCNN to filter the response coefficients for find out the best neural response. Finally,
B. Topology basis functions
-
IV. EXPERIMENTS
A. Data sampling and pretreatment
-
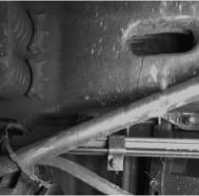
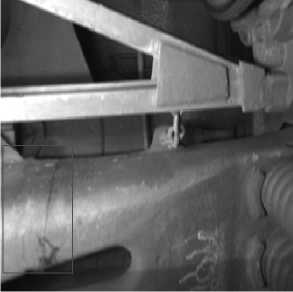
1) Random sampling. Select 10 512 x 512 pixels train bolster images as the training sample images. Fig.2 shows two images of them. We use the32 x 32sliding space sub windows for each image random sampling. A set U of the 1024 x 50000 input data is acquired. Then, whiten the samples using PCA and reduce dimensions to 160. The 160 x 50000 sample matrix can be obtained in the end and it is used as input sample for the learning algorithm of base function.
(a)
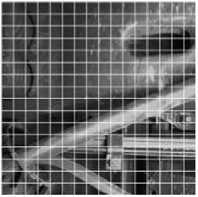
Fig.3 Sequential sampling (a) Original image (b) sampling result
(b)
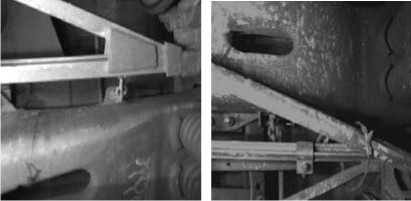
Fig.2 Two swings bolster images in training samples
2) Sequential sampling. Selected 512 x 512 pixels train bolster image to do sequential sampling, which is shown in Fig.3 (a).Firstly, starting from the top left-hand corner apex of the image and adopting 32 x 32 pixels space sub window to do sampling, we can get the first small image patch, and then shift to the right of 32 pixels followed by a second collection. It can get 16 image patches. Secondly, shift downward from the apex coordinate position for 32 pixels and collect 16 image patches of the second line. Thus, we could gathered 256 image patches of the same size and position continuous which was shown in Fig.3(b)
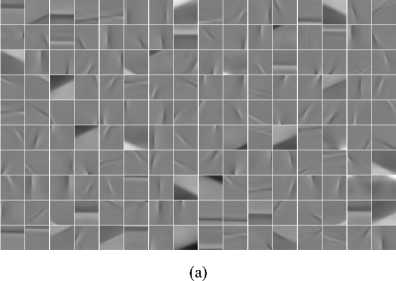
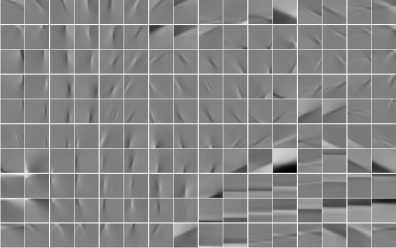
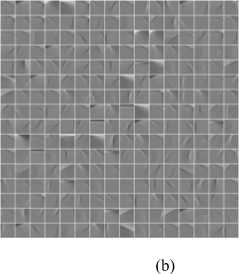
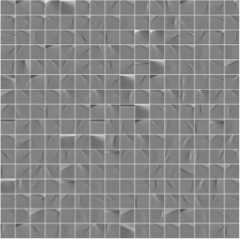
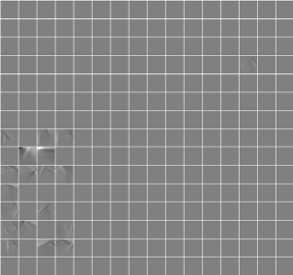
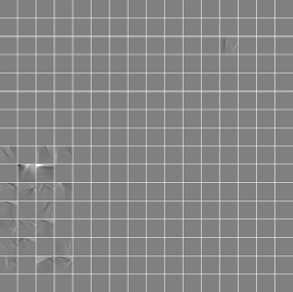
Fig.4 shows the ICA basis function and topology ICA basis function. In Fig.4, we found that the basis functions decomposed by topology ICA have topology structure and the receptive fields of neighborhood neurons have similar features. It has similar or gradient of orientation and frequency which is consistent with the physiological results.
(b)
Fig.4 The basis functions. (a)The basis functions obtained from ICA. (b)
The basis functions obtained from Topology
-
C. Neurons response selecting
Fig.5 shows the neurons respond to an image. Most neurons respond weakly, a larger number of neurons respond near zero, and there is redundancy.
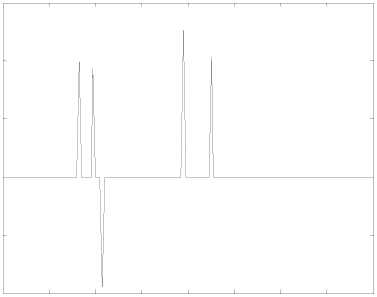
The result of neurons synchronous integration was shown in Fig. 6. It shows that the numbers of activated neurons are reduced visibly. The abscissa represents 160 neurons response and the ordinate represents response intensity. The response of weak neurons was removed and the best response was selected.
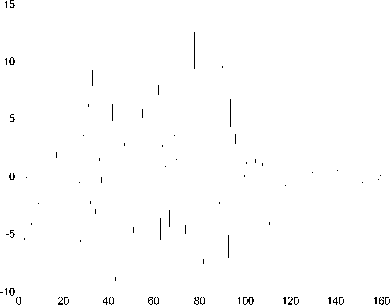
Fig.5 The neurons response of an image
-10
-5
0 20 40 60 80 100 120 140 160
Fig.6 The result of PCNN selected
D. Fault area detection
We start to do fault detection after we get the
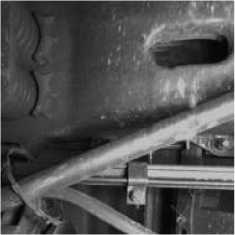
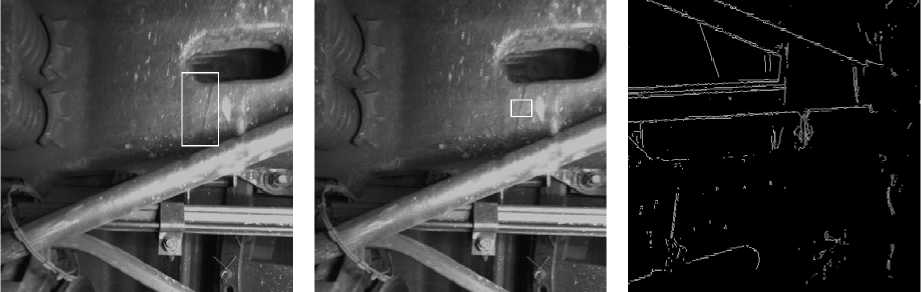
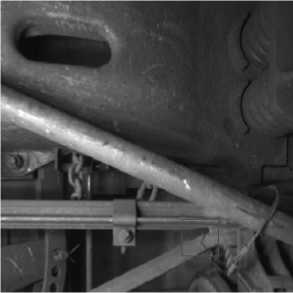
Take a normal image and the corresponding fault image as the test image to do the fault perception. Neurons would respond more strongly when they received the stimulus from the test images. Take these neurons as the output, their receptive fields perceived stimulus image content, the results showed in Fig. 7.
perception results of normal image and fault image. Firstly, find out the content expressed in the fault region neurons, locate the fault area according to the image coordinate representation method, and then locate the fault area in practical train fault image. The result is shown in Fig. 8.
(a)

(c)
(d)
Fig.7 Content perception results. (a)Normal image (b) Normal image content perception result(c) Fault image (d) Fault image content perception result
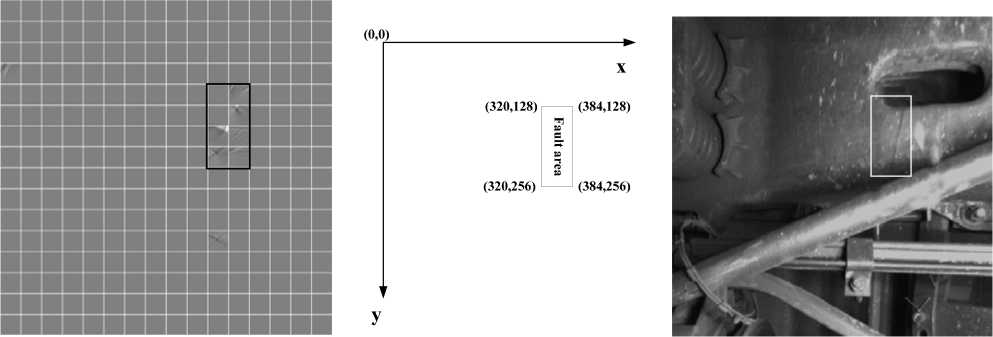
(a) (b) (c)
Fig.8 Image fault area detection. (a)Fault perception result (b) Fault area location(c) The detection result of Image fault area
E. Experimental comparison accurately; Template matching method can not detect completely, Hough transform is very difficult to identify the specific location of cracks. The detect results of 126 fault images are shown in Table 1.
Fig. 9 shows the fault detection results of CBIFD, Template matching and Hough transform. In Fig. 9, CBIFD method can detect the train crackle fault
(a)
(b)
(c)
Fig.9 Results contrast. (a)CBIFD detect result (b) Template matching detect result(c) Hough transform detect result
Table.1 the statistical results after detect 126 fault images
|
Image numbers |
Detected correctly (number) |
Undetected (number) |
False detection (number) |
Detection rate (%) |
|
|
visual perception |
126 |
124 |
1 |
1 |
98.41 |
|
Template matching |
126 |
93 |
8 |
25 |
73.81 |
|
Hough transform |
126 |
53 |
27 |
46 |
42.06 |
Fig. 10 shows the contrast results of CBIFD and basic ICA method. The experiment was divided into four groups: big crackle fault, small crackle fault and multi-crackle fault.
(a1)

(b1)
(c1)
result
I HHIHIII:
:::::::::::::::
II ■■III
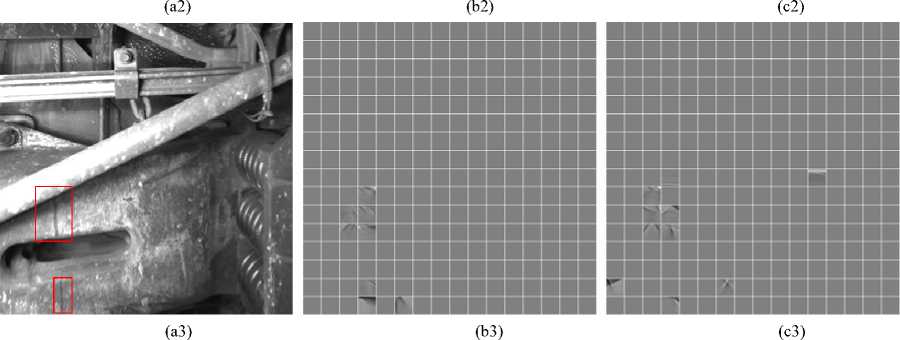
Fig.10 Results contrast. (a1) big crackle fault (a2) small crackle fault (a3) multi-crackle fault (b1-b3) CBIFD detect result (c1-c3) ICA detect
-
F. Analysis
We can see from the table 1, the detection rate of CBIFD is higher than the template matching and Hough transform. Because of simulating the visual information integrates mechanism fully; it is more effective for fault detection, and it can do fault detection to a large number of images with the basic functions samples which trained by small samples. Template matching method needs a large number of templates and the matching process caused a large amount of storage capacity and computing. It will lead to erroneous identification if the template deformation. Hough transform method can detect a straight line cracks, but it is difficult to find non-linear cracks location and the complexity of computational is high.
We can see from Fig.10, the CBIFD method and ICA method can both obtain good detection result to big crackle fault. This is because the two are both carry on the simulation to visual perception mechanism which is incomparable with traditional methods. However, the CBIFD method simulates the visual perception mechanism fully than the basic ICA method, thus, the detection result is better than the basic ICA method when regarding the small crackle fault and multi-crackle fault.
-
V. CONCLUSIONS
The CBIFD algorithm based on visual information integrate model which simulates receptive fields integrate mechanism and synchronous integration mechanism in visual system can improve fault detection rate efficiently. Follow-up work is to study fault classification method for images with various types
References Image Fault Area Detection Algorithm Based on Visual Perception
- L.Tomczak.Image Defect Detection Methods for Visual Inspection Systems[J].CAD Systems in Microelectronics, 2007,24(20):454-456
- Lin Jie, Luo Siwei.Real-time Rail Head Surface Defect Detection: a Geometrical Approach [J]. IEEE International Symposium on Industrial Electronics.2009,8(5):769-774
- Marcela X. Ribeiro.An Association Rule-Based Method to Support Medical Image Diagnosis with Efficiency [J]. IEEE Transactions on Multimedia,2008,10(2):277-285
- Guang-Hua GU, Dong Cui, “Automatic segmentation algorithm for leukocyte images”, Chinese Journal of Scientific Instrument, Vol.30, No.9, pp874-1879, 2009.(in Chinese)
- Xiu-Yong WU, Ke XU, Jin-Wu XU, “Automatic Recognition Method of Surface Defects Based on Gabor Wavelet and Kernel Locality Preserving Projections”, ACTA AUTOMATICA SINICA, Vol.36, No.3, pp438-441, 2010.(in Chinese)
- Wei Sun, Yao-Nan Wang, Hang Xu,“Segmentation Method for Magnetic Resonance Image Based on Self-organization Wavelet Neural Network”, Journal of Electronic Measurement and Instrument, Vol.22,No.4,pp26-29, 2008.(in Chinese)
- Shou Tiande.Visual information processing in the brain mechanisms[M].Shanghai: Shanghai Science and Technology Education Press.1977(in Chinese)
- Eckhorn R, Reitboeck H J, Arndt M, et al.Feature Linking via Synchronization among DistributedAssemblies: Simu- lation of results from cat cortex. Neural Computation, 1990,2(3):293~307
- JohnL.Johnson. Pulse Coupled Neural Net: Translation, rotation, seale, distortion and Intensity signal invariance for images. APPl.OPt.1994,33(26):6239~6253
- A.Hyvarinen, P.Hoyer and Inki.Topographic independent component analysis [J].Neural Computation, 2001,13(7): 1525-1558
- JohnL.Johnson, Mary Lou Padgett. PCNN Models and Applications,IEEE Trans.Neural Networks,1999,(10)3: 126-142
