Image Segmentation Method for Identifying Convective and Stratiform Rain using MSG SEVIRI Data

Author: Mounir Sehad, Mourad Lazri, Soltane Ameur, Jean Michel Brucker, Fethi Ouallouche
Journal: International Journal of Image, Graphics and Signal Processing(IJIGSP) @ijigsp
Article in issue: 7 vol.6, 2014.
Free access
This paper provides a new method for the classification of rainfall areas in convective and stratiform rain using MSG/SEVIRI (Spinning Enhanced Visible and Infrared) data. The proposed approach is based on spectral and temporal properties of clouds. The spectral parameters used are: brightness temperature (BT) and brightness temperature differences (BTDs), and the temporal parameter (RCT10.8) is the rate of change of (BT) in the 10.8µm channel over two consecutive images. The developed rain area classification technique (RACT-DN) is based on two multilayer perceptron neural networks (MLP-D for daytime and MLP-N for nighttime) which relies on the correlation of satellite data with convective and stratiform rain. The two algorithms (MLP-D and MLP-N) are trained using as reference data from ground meteorological radar over northern Algeria. The results show that RACT-DN classifier gives accurate discrimination between convective and stratiform areas during daytime and nighttime.
Classification, Artificial neural network, Radar, MSG image
Short address: https://sciup.org/15013362
IDR: 15013362
Text of the scientific article Image Segmentation Method for Identifying Convective and Stratiform Rain using MSG SEVIRI Data
Published Online June 2014 in MECS DOI: 10.5815/ijigsp.2014.07.04
The detection of rainfall by means of optical sensors aboard geostationary (GEO) weather satellites has a long tradition as they provide information about the spatiotemporal distribution of this key parameter of the global water cycle in a high spatial and temporal resolution. Most retrieval techniques developed so far for GEO systems are based on the relationship between cloud top temperature in the infrared channel and rainfall probability.
The high spectral resolution of the Spinning Enhanced Visible and Infrared Imager (SEVIRI) on board the Meteosat Second Generation (MSG) satellites, with eleven 3-km-resolution channels and one 1-km resolution visible channel, offers the possibility of extracting the microphysical and dynamic structure of precipitating clouds allowing for an enhanced discrimination between convective and stratiform rain areas, and thus contributing to the improvement of the satellite rainfall estimation [1].
In this context, several techniques have been developed for rainfall process separation as a part of a satellite-based rainfall retrieval scheme in the mid-latitudes using multispectral satellite data [2, 3]. In a more recent study, developed schemes classify convective and stratiform precipitation areas based on the high infrared spectral resolution of the MSG–SEVIRI [4, 5].
The spectral features due to their physical importance have proved effective and simple in cloud classification [6]. However, they also encounter some drawbacks due to the spectral similarities of certain cloud features.
Moreover, the incorporation of the rate of change in brightness temperature T10.8 over time provides information on cloud stage development.
The aim of this paper is to propose a new technique for rain area discrimination in the Mediterranean region on a 15 min basis for MSG/SEVIRI daytime and nighttime data. The developed scheme is based on spectral and temporal parameters. It is calibrated by instantaneous meteorological radar data using multilayer perceptron neural networks (MLPs). Artificial neural networks are widely used in precipitation remote sensing [7, 8, 9], and comparing to other statistical classification methods, the MLP algorithm does not require any a priori knowledge of the statistical distribution of the data [10]. The MLP is the statistical tool chosen to define the correlations between satellite measurements and classes of ground precipitation as estimated by weather radars.
In order to take into account the variation of the diurnal cycle of clouds, the dataset is divided into daytime and nighttime data.
The overall organization of the paper is as follows. Section II presents the study region and data sets used for the training and validation of the developed technique. In section III, the methodology of the developed rain classification method is presented. In section IV, we exhibit our experimental results with discussions. Finally, section V concludes the paper.
-
II. Study region and data sets
-
A. Study Region
The training and validation of the developed technique are performed using SEVIRI/MSG and ground meteorological radar data for northern Algeria (Fig. 1).
Algeria is located on the South shore of the Mediterranean region; it is bordered on the East by Tunisia and Libya, on the South by Niger and Mali, South-West by Mauritania and Western Sahara and West by Morocco. This region has a particular orographic structure and special characteristics of the sea-land coast. Due to these geographical properties, its climate has a very complex spatio-temporal feature [11]. Indeed, it is influenced by both the subtropical climate and the climate of mid-latitude systems [12, 13]. The spatial distribution of precipitation is characterized by a very marked NorthSouth gradient and a very low East-West gradient. The rainy season extends from October to March, with maximum rainfall occurring during November-December. In the north, the climate is Mediterranean transit, marked by seasonal oscillations.
The average annual rainfall is estimated at about 600 mm. The minimum rainfall is recorded in the southern regions. It is about 50 mm while the maximum is observed in the Djurdjura massif located in Kabylia and the massif of Edough located a little farther East, where it exceeds 1500 mm. The study area in this work is located in the north of Algeria, on domain with a radius of 250 km (Fig. 1). In Fig. 1, the red circle shows the domain of radar which coincides with the study area.
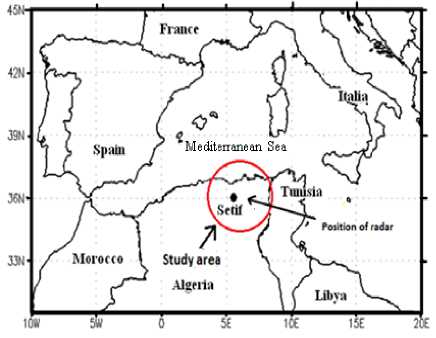
Fig 1: The study area and the position of the weather radar of Setif. The red circle shows the radar domain with a radius of 250 km.
For this study, MSG/SEVIRI data together with corresponding ground-based radar data are required.
-
B. SEVIRI and Radar Data
The dataset used in this work provided by the SEVIRI radiometer of Meteosat-8 in different frequency bands, the dataset are collected from November 2006 to March
2007 and November 2009 to March 2010. The MSG is a spinning stabilized satellite that is positioned at an altitude of about 36,000 km above the equator at 3.4°W. The SEVIRI radiometer gives every 15 minutes 12 images in the 12 available channels. We selected the channels sensitive to optical and microphysical properties of clouds (optical thickness, droplet size, cloud phase) as well as to the temperature of cloud tops, and those located in the spectral absorption bands mainly affected by the water vapor. These channels correspond to bands: visible (VIS0.6), near infrared (NIR1.6), water vapor (WV6.2, WV7.3) and infrared (IR3.9, IR8.7, IR10.8 and IR12.0). The raw image (Level 1.5) has a size of 3712 × 3712 pixels in each channel [14]. This corresponds to a spatial resolution at the image center of about 3 km. Each pixel is coded on 10 bits. All pixels are geolocalized on a common grid in geostationary projection. The subsatellite point corresponds to the pixel position (1856, 1856) on the image. For our case, we have predefined an area in the image of the Earth's surface; it corresponds to our study region (Fig. 1).
The radar data are provided by the ground-based C band radar network of The National Office of Meteorology (ONM). The Setif radar is installed near to the town of Setif, at 36 ° 11 'N, 5 ° 25' E and 1700 m of altitude, is one of seven Algerian meteorological radars. This is a Radar AWSR 81C in C-band, its operational frequency is 5.6 GHz. The displacement in azimuth is between 0 to 360 degrees in continuous and the movement in inclination is of -1° to 90°. Its polarization is linear and horizontal. The effective domain of radar is a radius of 250km.
Meteorological radar data are collected at a temporal resolution of fifteen minutes and a spatial resolution of 1km in a format of 512x512 pixels. Each pixel is coded on four bits. Thus, it consist of 15 classes representing different reflectivity intensities which are all together considered as raining in the comparison with collocated satellite pixels and one class representing no raining.
The physical parameter of the radar is the reflectivity factor, referred to as Z and expressed in (mm6m-3). The conversion of reflectivity factor Z into rainfall intensity R(mm/h) is obtained using the equation(1) adapted to our Radar and can also be converted into dBZ:
Z = 300. R 1.5 (1)
The scan interval for both data sets is 15 minutes. For the spatial comparison the radar data with an original spatial resolution of 1 by 1 km were projected to the viewing geometry of SEVIRI with a spatial resolution of 4 by 5 km in the study area.
Because of discrepancies between the SEVIRI data and radar data, due to differences in observation time, parallax errors and collocation errors [15], the comparison of these types of data may be hampered. To reduce the imbalances mentioned above and find a better correlation, we performed a repositioning to SEVIRI data to coincide spatially with radar data. We also applied a resampling to radar data in order to have the same resolution as resolution of satellite data. The resolution is 4x5km in the study region and is assumed constant due to low overlapped area observed by both sensors. Therefore, each SEVIRI pixel is collocated with 4×5 radar pixels. The time lag between the radar and the satellite is about 3 min. This small time difference does not require synchronization between the two data types.
-
III. Methodology
The developed rain classification method is based on spectral and temporal parameters. These parameters are given as follows:
-
A. Spectral Parameters
Brightness temperature ΤIR10.8 is an indication of the vertical extent of the cloud because, in general, brightness temperature of the system depends on the cloud-top height [2, 16, 17, 18, 19, 20].
The brightness temperature difference TIR10.8-TIR12.1 being a good indicator of the cloud optical thickness, is very effective in discriminating optically thick cumuliform clouds from optically thin cirrus clouds [16, 21, 22]. Optically thick cumulus type cloud shows the smaller TIR10.8-TIR12.1 due to their black-body characteristics, while optically thin cirrus cloud shows the larger TIR10.8-TIR12.1 due to the differential absorption characteristics of ice crystals between the two channels[23]. It is expected that optically thick and deep convective clouds are associated with rain [24]. Even though the split window technique is very effective in detecting and removing optically thin cirrus clouds with no precipitation, it sometimes incorrectly assigns optically thick clouds like cumulonimbus in place of optically thin clouds [25].
The temperature difference TWV6.2-TIR10.8 is effective in distinguishing between high-level and low-level/mid-level clouds [26]. The 6.2-μm channel is dominated by atmospheric water vapor absorption. Low-level clouds produce temperatures at the 6.2-μm channel lower than their actual cloud top temperatures due to the absorption from water vapor above them. In contrast, their cloud-top temperatures at the 10.8-μm window channel are representative of actual cloud-top temperature since the atmosphere is transparent to this wavelength. As a result, TWV6.2-TIR10.8 tends to be very negative in sign for low-level clouds. In contrast, upper level thick clouds (being above most of this vapor and having absorption similar for both wavelengths due to ice crystals) produce temperatures at the 6.2-μm channel close to their actual cloud-top temperatures. In this case, TWV6.2-TIR10.8 usually takes very small negative values. Semitransparent ice clouds, such as cirrus, constitute an exception to this rule since their differential transmission cause larger negative differences. Positive differences may occur when water vapor is present in the stratosphere above the cloud top, which is a sign of convective cloud tops [27, 28] as opposed to mere cirrus clouds.
The brightness temperature difference TIR8.7-TIR10.8 can be utilized to gain information about the cloud phase [2, 20, 29, 30]. The imaginary (absorption) component of the index of refraction, which is a direct indicator of absorption/emission strength, differs for ice and water at these two wavelengths [31, 32]. More specifically, the difference in water particle absorption is small between the two wavelengths, but very large for ice particles [26, 33]. Radiative transfer simulations show that for ice clouds, TIR8.7-TIR10.8 tends to be positive in sign, whereas for low-level water clouds TIR8.7-TIR10.8 tends to be small negative [32]. This simple parameter is adequate for classifying the cloud phase as either “ice” or “water”. We can expect ice cloud phase to be more associated with rain.
The effective droplet radius (re) and the optical thickness (τ) of clouds are directly related to rainfall probability of a cloud; it is function to. The effective particle radius (re) defined by the ratio between the third to the second power of the droplet spectrum is taken in place of the actual droplet spectrum. The cloud optical thickness (τ) defined by the integration of the extinction coefficient integrated over the cloud geometrical thickness is considered representatively for the cloud geometrical thickness.
During day-time, the values of re and τ considered for a rainfall intensity differentiation can be retrieved on a pixel basis using a combination of two solar channels, namely the VIS0.6 and NIR1.6 channel of MSG [4, 20, 34]. High values of reflectance RVIS0.6 correspond to high optical depth of cloud and low values of reflectance RNIR1.6 indicate large particles in the cloud. This means that a large re and τ is obtained when high values of RVIS0.6 coincide with low values of RNIR1.6. It should be noted that the retrievals are limited to satellite and solar viewing zenith angles smaller than 72°.
During night-time, combinations of brightness temperature differences TIR3.9-TIR10.8 and TIR3.9-TIR7.3 are used to infer implicit information about of (re) and (τ) [2, 4, 34]. Indeed, for thin clouds with small or large particles, respectively (small or medium re and τ), brightness temperature differences reach the highest values. Thick clouds with small particles (medium re and τ) lead to small values of brightness temperature differences. In contrast, large particles together with a high optical thickness (high re and τ) results medium values of brightness temperature differences. Therefore, a raining cloud indicates mean values of brightness temperature differences.
-
B. Temporal Parameter
The temporal parameter is the rate of change of brightness temperature in the 10.8µm channel over two consecutive images (RCT 10.8 ), this parameter provides information on cloud stage development [35] and is defined as:
RCT 10.8 ( t ) =
T IR 10.8 ( t ) - T IR 10.8 ( t - 1) ∆ t
Where Δt is the time difference between two consecutive images (i.e., 15 min for MSG).
-
C. Developed Scheme
The technique used to delineate rain areas in the MSG image is an artificial neural network multilayer perceptron (MLP).
-
1) Multilayer perceptron algorithm
A multilayer perceptron is a feed forward artificial neural network model that maps sets of input data onto a set of appropriate outputs. An (MPL) consists of three or more layers (an input and an output layer with one or more hidden layers) of nonlinearly-activating nodes. Each node in one layer connects with a certain weight (wi) to every node in the following layer. Generally, the activation function used is the sigmoid (Fig. 2).
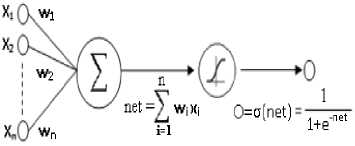
Fig 2: Sigmoïde unit
MLP utilizes a supervised learning technique called back propagation algorithm. For each training example (d) in (D) the error between the target value (td) and the value produced by the perceptron (O d ) is given by the following relation:
E d [ W ] = 1(t d - O d ) 2 (3)
Then, the weights of the nodes are corrected by using the following equation:
w —— w — n V E d [ W ] (4)
Where η is the learning rate, this parameter typically ranges from 0.2 to 0.8.
-
2) Back-propagation algorithm
X d = input; t d = target output; O d = observed unit output
-
1. Initialize all weights to small random numbers.
Until satisfied, do:
-
• For each training example, do
-
2. Input the training example to the network and compute the network output
-
3. For each output unit ( k) :
-
4. For each hidden unit (h) :
-
5. Update each network weight ( w i,j )
w ← w + ∆ w
i , j i , j i , j
δk ← Ok( 1 - Ok)(tk - Ok ) (5)
δ h ← Oh( 1 - Oh ) ∑ wh , k δ k (6)
k = outputs
Where
∆w =ηδ x i, j j i
-
3) Application of MLP for rain areas delineation
Two MLPs are created for the classification of the rain areas in the MSG/SEVIRI data. The first one (MLP-D) is used during the daytime and the second one (MLP-N) is applied during the nighttime.
The daytime MLP-D scheme uses as input spectral data (T IR10.8, T IR10.8 -T IR12.1 , T IR8.7 -T IR10.8 , T WV6.2 -T IR10.8 , R VIS0.6 , and R NIR1.6 ), and the rate of change in T IR10.8 over time (RCT 10.8 ) as temporal parameter.
The nighttime MLP-N algorithm uses as input spectral data (T IR10.8 , T IR10.8 -T IR12.1 , T IR8.7 -T IR10.8 , T WV6.2 -T IR10.8 , T IR3.9 -T IR10.8 , and T IR3.9 -T WV7.3 ), and (RCT 10.8 ) as temporal parameter.
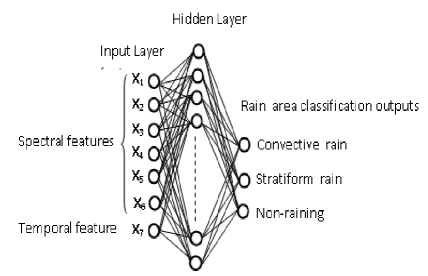
The number of the hidden layer neurons was selected using the network growing method [36] for the training phase. Therefore, the number of 15 neurons for both MLP-D and MLP-N minimized the network’s error functions (RMSE) after 800 iterations. Therefore, each MLP contains 7 neurons in input layer, 15 neurons in the hidden layer and 3 output neurons representing the three classes for convective rain, stratiform rain and no-rain (Fig. 3).
In this study, MLP-D and MLP-N were trained using SEVIRI data set over north Algeria for 2109 precipitation scenes from November 2006 to March 2007.
X 7 = RCT 10.8
a) MLP-D: Daytime: (X1, X2, X3, X4, X5, X6) = (TIR10.8, TIR10.8-TIR12.1, T IR8.7 -T IR10.8 , T WV6.2 -T IR10.8 , R VIS0.6 , R NIR1.6 )
b) MLP-N: Nighttime: (X 1 , X 2 , X 3 , X 4 , X 5 , X 6 ) = (T IR10.8, T IR10.8 -T IR12.1 , T IR8.7 -T IR10.8 , T WV6.2 -T IR10.8 , T IR3.9 -T IR10.8 , T IR3.9 -T WV7.3 )
Fig 3: Structure of MLPs convective/ stratiform rain classification algorithms: a) MLP-D; b) MLP-N
-
IV. Results and evaluation of the new scheme
Radar
Satellite
Raining
Non-Raining
Total
Raining
S Y R Y
S N R Y
R Y
Non-Raining
S Y R N
S N R N
R N
Total
S Y
S N
T SR
Models are validated against independent rainy days during November 2010 to March 2011, not used for training the rain area delineation algorithms. The evaluation was performed by comparison with instantaneous ground-based radar data collocated with SEVIRI data. The observation scenes made by the radar and satellite at a rhythm of 15 minutes are 14580, most of which are non-raining situations.
To evaluate the potential improvement by the developed Rain Area Classification Technique during Daytime and Nighttime (RACT-DN), the validation scenes were also classified by the Enhanced Convective Stratiform Technique (ECST)[37] which is similar to the Convective Stratiform Technique(CST)[38] but additionally includes the water vapor channel temperature for a more reliable deep convective/cirrus clouds discrimination[39].
Standard verification scores such as, Probability Of Detection (POD), Probability Of False Detection (POFD), False Alarm Ratio FAR, Frequency BIAS index (Bias), Critical Success Index (CSI), equitable threat score (ETS) are used to evaluate the developed scheme.
The verification scores calculated from Table I correspond to the results of discriminating raining from non-raining clouds, and the scores computed from Table II correspond to the results of the convective/stratiform rain area classification.
-
• The Probability Of Detection (POD) Y gives the fraction of pixels that have been correctly identified as raining by the satellite technique according to the radar product:
SR
(POD) v=---- Yr---
Y SYRY + Snry
SR
= Y Y e [0 1],optimal: 1
RY
-
• The Probability Of False Detection (POFD) Y indicates the fraction of the pixels incorrectly identified as raining by the satellite algorithm :
SR SR
(POFD) v=---—---= -Y-N e
Syrn + Snrn rn
[0 1], optimal: 0
-
• The False Alarm Ratio ( FAR) Y describe the fraction of the satellite pixels that have been wrongly classified as raining pixels :
(FAR) Y =
SYRN
Syry + SYRN
SR
= -LNL e [0 1], optimal: 0
SY
-
• The Equitable Threat Score( ETS)Y indicate how well the classified pixels by the satellite technique correspond to chance S Y R Y random :
TABLE I: Contingency Table for raining/non-raining area discrimination, (sY=SC+SS) and sN: number of estimated raining and non-raining pixels, respectively . rY and rN: number of observed raining and non-raining pixels by radar, respectively.
(ETS) Y
With
SVRV - SVRV , 1
---------Y Y Y Yandom --------e [ - 1 1],optimal: 1
SvRv + S„Rv + SvR, , + SvRv , 3
Y Y N Y Y N Y Yrandom
-
TABLE II: Contingency Table for convective / STRATIFORM rain CLASSIFICATION , S C AND S S : NUMBER OF ESTIMATED CONVECTIVE AND stratiform pixels, respectively. rC and rS: number of observed convective and stratiform pixels by radar, respectively.
|
Radar |
Satellite |
||
|
Convective |
Stratiform |
Total |
|
|
Convective |
S C R C |
S S R C |
R C |
|
Stratiform |
S C R S |
S S R S |
R S |
|
Total |
S C |
S S |
T SR |
-
A. Statistical Analysis
The verification scores [(Bias) Y , (POD) Y , (POFD) Y , (FAR) Y , (ETS) Y , (CSI) Y ] for discriminating raining from non-raining clouds are given as follows :
-
• The Bias (Bias) Y describe the ratio between the estimated and the observed rain events :
SyRy + SVRNSV
(Bias)Y = 9WN = YT ' [0 ”[’ oPtimal: 1
SyRy + SN^Y Ry
Syry + Snry + Syry + Syrn ry + Sy
^Yirandom т т(14)
TSR TSR
-
• The Critical Success Index (CSI)Y which enclose all pixels that have been identified as raining by either the radar or the satellite technique :
SR SR
( I) Y = S R R R = R R e[0 11, o’ 1 (15)
SyRy + SnRy + SYRf Ry + SYRN
The verification scores [(Bias) C , (POD) C , (POFD) C , (FAR) C , (ETS) C , (CSI) C ] corresponding to the convective/stratiform rain area classification are computed from the similar equations described above by replacing S Y with S C , R Y with R C , S N with S S and R N with R S . It should be noted that the number of the estimated and observed raining pixels are given by SY=SC+SS and RY=RC+RS, respectively.
-
B. Results and Discussions
The verification scores computed for the 1936 daytime and nighttime validation scenes are summarized in 2 tables: (Table III) for discriminating raining from nonraining clouds, and (Table IV) for the classification of the precipitation areas into convective and stratiform regions.
-
1) Discriminating raining from non-raining clouds results
The scores of discriminating raining from non-raining areas are represented in Table III, the daytime bias of 96% and nighttime bias of 94% indicate that the RACT-DN slightly underestimates the rain areas detected by the radar compared to the ECST bias (daytime: 83%; nighttime: 83%). Moreover, 79% of the radar observed raining pixels are identified by RACT-DN during daytime and 75% during nighttime which indicates a best performance compared to the POD (daytime: 65%; nighttime: 62%) for ECST. The improvement in POFD and FAR during daytime and nighttime is more notable. Indeed, the POFD indicates that a lower fraction of the observed non rain events were misclassified as rain events by RACT-DN (daytime: 3%; nighttime: 4%) than by ECST (daytime: 6%; nighttime: 7%). Furthermore, the FAR denotes that a lower fraction of the pixels were wrongly classified as rain by RACT-DN (daytime: 20% nighttime: 24%) than by the ECST (daytime: 29%; nighttime: 31%).
The overall good performance of RACT-DN during daytime and nigttime indicated by the good range of the verification scores is further supported by the CSI(daytime:71% ; nighttime:69%) and the ETS(daytime:24% ; nighttime: 22% ) which outperform the result of the ECST ( CSI daytime:58%, CSI nighttime: 56%, ETS daytime: 15%, and ETS nighttime : 12%).
TABLE III: Standard Verification Scores computed for raining/non-raining area discrimination techniques
|
Test |
RACT-DN |
ECST |
||
|
Daytime |
Nighttime |
Daytime |
Nighttime |
|
|
(BIAS) Y |
0.96 |
0.94 |
0.83 |
0.83 |
|
(POD) Y |
0.79 |
0.75 |
0.65 |
0.62 |
|
(POFD) Y |
0.03 |
0.04 |
0.06 |
0.07 |
|
(FAR) Y |
0.20 |
0.24 |
0.29 |
0.31 |
|
(CSI) Y |
0.71 |
0.69 |
0.58 |
0.56 |
|
(ETS) Y |
0.24 |
0.22 |
0.15 |
0.12 |
-
2) Convective/stratiform rain area classification results
By analysing the validations scores of the classification of the rainy areas into convective and stratiform regions represented in Table IV, the developed scheme (RACT-DN) performs better than ECST by exhibiting during daytime and nighttime higher POD, ETS, and CSI values as well as lower false alarms scores( FAR and POFD) .
More detailed, 79% (daytime POD) and 76% (nighttime POD) of the convective rain occurrences are identified by RACT-DN, while 32 % (daytime FAR) and 33% (nighttime FAR) of the estimated events are wrongly classified as convective. Moreover, 19 %
(daytime POFD) and 21% (nighttime POFD) of the observed stratiform events are misclassified as convective rain cases. ECST indicates lower value of POD (daytime: 62%, nighttime: 61%), and higher scores of FAR and POFD (daytime: FAR= 46%, POFD= 24%, and nighttime: FAR=46%, POFD=25%) than RACT-DN. The outperformance of RACT-DN to classify the rainy areas into convective and stratiform regions during daytime and nighttime is supported by the good range of CSI and ETS values compared to the ECST scores.
TABLE IV: Standard Verification Scores computed for CONVECTIVE / STRATIFORM AREA CLASSIFICATION TECHNIQUES
|
Test |
RACT-DN |
ECST |
||
|
Daytime |
Nighttime |
Daytime |
Nighttime |
|
|
(BIAS) C |
1.12 |
1.14 |
0.83 |
0.83 |
|
(POD) C |
0.79 |
0.76 |
0.62 |
0.61 |
|
(POFD) C |
0.19 |
0.21 |
0.24 |
0.25 |
|
(FAR) C |
0.32 |
0.33 |
0.46 |
0.46 |
|
(CSI) C |
0.58 |
0.56 |
0.53 |
0.53 |
|
(ETS) C |
0.23 |
0.22 |
0.18 |
0.15 |
To gain a visual impression of the performance of the proposed scheme, we presented in Fig. 4 the results of the classification of stratiform and convective clouds. The classification is performed for a scene of 06 January 2011 (11:45 UTC). Fig. 4(a) shows the brightness temperature in the channel IR10.8. Fig. 4(b) shows areas classified together by RADAR and RACT-DN and Fig. 4(c) shows the regions identified simultaneously by RADAR and ECST.
The number of misclassified pixels is more important for the ECST technique compared to RACT-DN technique. This visual results support the statistics results obtained previously.
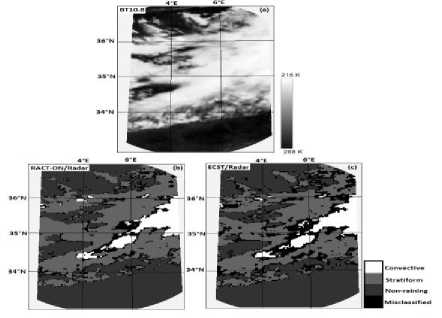
Fig 4: Delineated rain area for the scene from 06 January 2011 (11:45 UTC): (a) BT10.8 image, (b) rain area delineated by RADAR and RACT-DN, (c) rain area detected by RADAR and ECST.
-
V. Conclusions
The potential of the MSG–SEVIRI high infrared spectral resolution for discriminating between convective, advective/stratiform and non-precipitating clouds was analyzed. The proposed technique (RACT-DN) considers as spectral information 6 parameters: 2 parameters characterizing the optical and microphysical cloud properties (VIS0.6 and, NIR1.6 channels for daytime or both channel differences T3.9-T10.8 and T3.9-T7.3 during nighttime), and 4 other parameters give information about the cloud phase (T10.8, T8-7-T10.8, T10.8-T12.1, and TWV6.2-TIR10.8). Moreover, the temporal feature gives the rate of change of brightness temperature over two consecutives images. The parameters are merged and incorporate into the developed rain classification algorithm by using two daytime and nighttime multilayer perceptron MLP-D and MLP-N, respectively.
MLP-D and MLP-N were trained using SEVIRI data set over north Algeria for 2109 precipitation scenes from November 2006 to March 2007 and the models are validated against 1936 independent precipitation scenes during November 2009 to March 2010 which are not used for training the rain area delineation algorithms. The results of the developed scheme were compared with both corresponding ground based radar and ECST algorithm.
The validation scores have shown the performance of the developed method during the daytime and nighttime for the discriminating of the raining from non-raining clouds, as well for the classification of the rainy areas into convective and stratiform regions.
One of the main advantages of the developed method is the best performance of the rain area classification algorithms (MLP-D and MLP-N) during daytime and nighttime. Indeed, during night time the visible channel information (VIS0.6) and the near-infrared channel (NIR 1.6 ) are replaced by the infrared parameters to gain the optical and microphysical cloud properties.
In general, the results of this study showed that the combined use of spectral and temporal features in the MSG-SEVIRI can be beneficial for the classification of convective and stratiform precipitating clouds. A potential application of a new rainfall retrieval technique based on MSG/SEVIRI data is the improved rainfall detection in a high spatial and temporal resolution during daytime and nighttime.
References Image Segmentation Method for Identifying Convective and Stratiform Rain using MSG SEVIRI Data
- E.E. Ebert, M.J. Manton, "Performance of satellite rainfall estimation algorithms during TOGA COARE". J Atmos Sci,vol. 55, pp.1538–1557, 1998.
- B. Thies, T. Nauss, J. Bendix, "Discriminating raining from non-raining cloud areas at mid-latitudes using Meteosat Second Generation SEVIRI nighttime data". Meteorological Applications,vol.15, pp. 219–230, 2008.
- M. Lazri, S. Ameur, Y. Mohia, "Instantaneous rainfall estimation using neural network from multispectral observations of SEVIRI radiometer and its application in estimation of daily and monthly rainfall" Advances in Space Research, vol.53, no.1, pp. 138-155, 2014.
- M.Lazri, Z. Ameur, S. Ameur, Y. Mohia, J.M. Brucker, J. Testud, "Rainfall estimation over a Mediterranean region using a method based on variou s spectral parameters of SEVIRI MSG", .Advances in Space Research, vol.52, pp. 1450-1466,2013, http://dx.doi.org/10.1016/j.asr.2013.07.036
- H. Feidas, A. Giannakos, "Classifying convective and stratiform rain using multispectral infrared Meteosat Second Generation satellite data". Theor Appl Climatol , vol. 108, no. 3pp.613–630, 2012.
- R. Kaur, A. Ganju, "Cloud classification in NOAA AVHRR imageries using spectral and textural features". J Indian Soc Remote Sens,vol. 36, pp. 167–174, 2008.
- T. Bellerby, M. Todd, D. Kniveton, C. Kidd, "Rainfall estimation from a combination of TRMM precipitation radar and GOES multispectral satellite imagery through the use of an artificial neural network". J. Appl. Meteor, vol. 39, pp. 2115–2128, 2000.
- D.I.F. Grimes, E. Coppola, M. Verdecchia, G. Visconti, "A neural network approach to real-time rainfall estimation for Africa using satellite data". J. Hydrometeor, vol. 4, pp. 1119–1133, 2003.
- F.J. Tapiador, C. Kidd, V. Levizzani, F.S. Marzano, A neural networks–based fusion technique to estimate halfhourly rainfall estimates at 0.18 resolution from satellite passive microwave and infrared data. J. Appl. Meteor., vol. 43, pp. 576–594, 2004.
- Y. Hong, K. Hsu, S. Sorooshian, X. Gao, "Precipitation estimation from remotely sensed imagery using an artificial neural network cloud classification system". J Appl Meteor, vol. 43, pp.1834–1852, 2004.
- Lionello P, Malanotte-Rizzoli P, Boscolo R ,Alpert P, Artale V, Li L, Luterbacher J, May W, Trigo R, Tsimplis M, Ulbrich U, Xoplaki E, "The Mediterranean climate: an overview of the main characteristics and issues", Mediterranean Climate Variability. Elsevier B.V, pp. 1–26, 2006.
- R.M. Trigo, E. Xoplaki, J. Lüterbacher, S.O. Krichak, P. Alpert, J. Jacobeit, J. Sàenz, J. Fernàndez, J.F. Gonzàlez-Rouco, "Relations between variability in the Mediterranean region and mid-latitude variability", Mediterranean Climate Variability. Elsevier B.V, pp. 179–226, 2006.
- P. Alpert, M. Baldi, R. Ilani, S. Krichak, C. Price, X. Rodό, H. Saaroni, B. Ziv, P. Kishcha, J. Barkan, A. Mariotti, E. Xoplaki, "Relations between climate variability in the Mediterranean region and the tropics: ENSO, South Asian and African monsoons, hurricanes and Saharan dust", Mediterranean Climate Variability. Elsevier B.V, pp. 149–177, 2006.
- EUMETSAT, "Applications of Meteosat Second Generation - Conversion from Counts to Radiances and from Radiances to Brightness Temperatures and Reflectance",2004, http://oiswww.eumetsat.org/WEBOPS/msg_interpretation/index.html.
- G.A. Vicente, J.C. Davenport, R.A. Scofield, "The role of orographic and parallax corrections on real time high resolution satellite rainfall rate distribution". Int. J. Rem. Sens, vol. 23, no. 2, pp. 221–230), 2002.
- H. Feidas, "Study of a mesoscale convective complex over the eastern Mediterranean basin with Meteosat data". Eumetsat Meteorological Satellite Conference, Oslo, Norway, 5-9 September, 2011.
- H. Feidas, A. Giannakos, "Classifying convective and stratiform rain using multispectral infrared Meteosat Second Generation satellite data, 2011. Theor.Appl.Climatol.doi:10.1007/s00704-011-0557-y.
- H. Feidas, A. Giannakos, Identifying precipitating clouds in Greece using multispectral infrared Meteosat Second Generation satellite data..Theor.Appl.Climatol, 2010. doi:10.1007/s00704-010- 0316-5.
- H. Feidas, G. Kokolatos, A. Negri, M. Manyin, N. Chrysoulakis, Y. Kamarianakis, "Validation of an infrared-based satellite algorithm to estimate accumulated rainfall over the Mediterranean basin". Theor. Appl. Climatol.,2008, http://dx.doi.org/10.1007/s00704-007-0360-y.
- B. Thies, T. Nauss, J. Bendix, Discriminating raining from non-raining cloud areas at mid-latitudes using Meteosat Second Generation SEVIRI daytime data. Atmospheric Chemistry and Physics,vol.8,pp.2341–2349,2008, http://dx.doi.org/10.1029/22008JD010464.
- T. Inoue, "On the temperature and effective emissivity determination of semi-transparent cirrus clouds by bi-spectral measurements in the 10-mm window region". J. Meteorol. Soc. Japan, vol. 63, pp. 88–99, 1985.
- T. Inoue, "A cloud type classification with NOAA-7 split-window measurements". J. Geophys. Res, vol. 92, pp. 3991–4000, 1987.
- T.Inoue, X. Wu, K. Bessho, "Life cycle of convective activity in terms of cloud type observed by split window", 11th Conference on Satellite Meteorology and Oceanography, Madison, WI, USA, 2001.
- T. Inoue, "An instantaneous delineation of convective rainfall areas using split window data of NOAA-7 AVHRR". J. Meteorol. Soc. Japan, vol. 65, pp. 469–481, 1987.
- T. Inoue, Day-to-night cloudiness change of cloud types inferred from split window measurements aboard NOAA polar-orbiting satellites. J Meteor Soc Japan ,vol. 75, pp. 59–66, 1997.
- H.J. Lutz, T. Inoue, J. Schmetz, "NOTES AND CORRESPONDENCE Comparison of a split-window and a multi-spectral cloud classification for MODIS observations". J Meteor Society of Japan vol. 81, no. 3, pp. 623–631, 2003.
- S. Fritz, I. Laszlo, "Detection of water vapor in the stratosphere over very high clouds in the tropics". J Geophys Res vol. 98, no. D12, pp. 22959–22967, 1993.
- J. Schmetz, S.A. Tjemkes, M. Gube, L. van de Berg, "Monitoring deep convection and convective overshooting with Meteosat". Advances in Space Research, vol.19, no. 3, pp. 433–441, 1997.
- S.A. Ackerman, K.I. Strabala, W.P. Menzel, R.A. Frey, C.C. Moeller, L.E. Gumley, "Discriminating clear sky from clouds with MODIS". Journal of Geophysical Research, vol. 103, no. D24, pp. 32141–3215, 1998 . http://dx.doi.org/10.1029/1998JD200032.
- K.I. Strabala, S.A. Ackerman, W.P. Menzel, "Cloud properties inferred from 8–12 μm data". Journal of Applied Meteorology, vol.33, pp. 212–229, 1994.
- B.A. Baum, P.F. Soulen, K.I. Strabala, M.D. King, S.A. Ackerman, W.P. Menzel, P. Yang, "Remote sensing of cloud properties using MODIS airborne simulator imagery during SUCCESS: 2. Cloud thermodynamic phase". J Geophys Res , vol. 105, no. D9, pp. 11,781-11,792, 2000.
- B.A. Baum, S. Platnick, "Introduction to MODIS cloud products". Earth Science Satellite Remote Sensing, pp. 87–108, 2006.
- M.J. Pavolonis, A.K. Heidinger, T.Uttal, "Daytime global cloud typing from AVHRR and VIIRS: Algorithm description, validation, and comparisons". J. Appl. Meteor., Vol. 44, Issue 6, pp. 804–826, 2005.
- M. Lazri, S. Ameur, J.M. Brucker, J. Testud, B. Hamadache, S. Hameg, F. Ouallouche, Y. Mohia, "Identification of raining clouds using a method based on optical and microphysical cloud properties from Meteosat second generation daytime and nighttime data", Appl Water Sci, 2013. DOI 10.1007/s13201-013-0079-0.
- G.A. Vicente, R.S. Scofield, W.P. Menzel, "The operational GOES infrared rainfall estimation technique". Bull. Am. Meteorol. Soc. 79, pp. 1883–1898, 1998.
- B. Krose, P. van der Smagt, "An introduction to neural networks". University of Amsterdam, pp. 44–45, 1996.
- C. Reudenbach, G. Heinemann, E. Heuel, J. Bendix, M. Winiger, "Investigation of summertime convective rainfall in Western Europe based on a synergy of remote sensing data and numerical models". Meteorol.Atmos.Phys, vol. 76, pp. 23–41, 2001.
- R. Adler, A.J. Negri, "A satellite infrared technique to estimate tropical convective and stratiform rainfall". Journal of Applied Meteorology, vol. 27, pp. 30–51, 1988.
- S.A. Tjemkes, L. van de Berg, J. Schmetz, "Warm water vapour pixels over high clouds as observed by Meteosat". Beiträge zur Physik der Atmosphäre, vol.70, no. 1, pp.15–21, 1997.
