Imbalances in the spatial development of Russia and its economic regions: choosing an accurate and adequate assessment method and levelling-off ways

Author: Pyankova Svetlana G., Kombarov Mikhail A.
Journal: Economic and Social Changes: Facts, Trends, Forecast @volnc-esc-en
Section: Regional economy
Article in issue: 3 т.15, 2022.
Free access
One of the factors determining the structure of the expenditure part of Russia’s federal budget is represented by considerable imbalances in the spatial development of the country. The impact of this factor consists in the annual need to allocate funds to non-self-sufficient regions in the form of subsidies, which can be directed, for example, to the development of business in prosperous entities. The aim of the research is to carry out an accurate and adequate quantitative assessment of the degree of such an imbalance over a long retrospective period of time. Practical significance of the assessment is due to the fact that it will allow us to see which decisions of the authorities aggravated the problem under consideration, and therefore to develop recommendations for levelling off these imbalances. When choosing a method to achieve the goal, we decided to use the Herfindahl - Hirschman index that contains a modification proposed by Professor S.G. Svetunkov, which eliminates its disadvantage consisting in the dependence of the final value on the number of units included in the set under consideration. The use of this indicator has become the main element of the scientific novelty of the study. Having assessed the degree of heterogeneity of the Russian economic space on the basis of information retrieved from the official website of the Federal State Statistics Service, we use regression analysis to derive an equation describing its impact on the structure of the expenditure part of the federal budget. According to the viewpoint that we share, the key tool consists in smoothing out the imbalances within the economic regions that form the country. Their assessment is carried out in a similar way and is also an element of the scientific novelty of the study. Guided by the results obtained, we identify regions where the elimination of vulnerabilities can reduce the heterogeneity of the economic space of the respective economic regions and Russia as a whole. The indicator tested in the study can be used in the future, for example, to assess the degree of uneven distribution of various resources (material, financial, etc.) on the territory of Russia.
Economic space, assessment of the degree of heterogeneity, svetunkov index, subsidies, federal budget, economic district
Short address: https://sciup.org/147238055
IDR: 147238055 | UDC: 332.14 | DOI: 10.15838/esc.2022.3.81.4
Text of the scientific article Imbalances in the spatial development of Russia and its economic regions: choosing an accurate and adequate assessment method and levelling-off ways
The term “dynamics of the economic development process in the country” is one of the key ones in economics and denotes, in the most general interpretation, the process of improving the state of social production and, consequently, people’s welfare. The successful course of such a process depends on the presence and impact of many factors, one of which is the phenomenon of heterogeneity of the economic space. Its essence lies in the fact that each administrative-territorial unit of a country has its own economy, which can be developed better or worse than the national economy. This phenomenon is inherent in all countries: developed, as well as developing ones. For example, Italy, a G7 member, is a developed country whose southern provinces, in particular those forming the Mezzogiorno macroregion, are noticeably inferior in economic indicators to other regions and do not have a high standard of living (Bigoni et al., 2016; Lagravinese, 2015). The United States also is a developed country which has a region with a telling name the “Rust Belt” (Hassink, Kiese, 2021) that is included by the UN in the group of least developed regions. Another example is the Democratic Republic of the Congo, in which, simultaneously with territories characterized exclusively negatively, there are regions (in particular Haut-Katanga) with a relatively developed transport system, industry and research. Besides, there are countries that, due to their area and location on the planet, can be compared to tiny clouds lost in the blue sky, for example, Mauritius, whose tourist-attractive territories (for example, Riviere Noire) noticeably dominate over territories that do not have such a feature (Dirksmeier, 2017).
The German economist I. von Thunen was the first to show interest in this phenomenon. In his work The Isolated State in Relation to Agriculture and Political Economy he explained its root cause. It lies in the fact that even in a country with the simplest state structure, i.e. having only one city located in its geographical center, with uniform natural and climatic conditions and with an economy represented by only one industry – agriculture, several types of economic activities are carried out (animal husbandry and crop production, represented by forestry, grain and other types of economy), the effectiveness of which is determined by two factors: land rent and transportation costs (Thunen, 1842). Later, the
Swedish economist G. Myrdal expressed a slightly different version. In his opinion, the heterogeneity of the country’s economic space is generated by the uneven distribution of economic activity across its territory (Myrdal, 1957). Combining these views and applying them to a country with a diversified economy existing in the modern world, we can say that its administrative-territorial units that attract labor due to the high efficiency of many types of economic activities on their territory will be more developed.
As for the influence of this phenomenon on the dynamics of economic development in the country, it depends entirely on the degree of its manifestation, according to the view adopted by the academia. Thus, in 2006, I.I. Kuznetsova expressed the opinion that the weak heterogeneity of the economic space contributes to the acceleration of this process (Kuznetsova, 2006). Thirteen years later, candidates of sciences (Economics) M.A. Dugarzhapova, E.A. Zhalsaraeva and E.Ts. Chimitdorzhieva cited this opinion (Dugar-zhapova et al., 2019). Also I.I. Kuznetsova and S.G. Pyankova1 pointed out significant manifestation of the phenomenon under consideration in Russia, which is incompatible with the effective development of the national economy (Kuznetsova, 2006). The essence of this incompatibility was explained by A.G. Granberg, who noted that the allocation of subsidies from the federal budget to many lagging regions due to their lack of selfsufficiency, infringes on the interests of the population and business of prosperous subjects (Granberg, 2011).
In May 2017, Presidential Decree 208 officially recognized the heterogeneity of Russia’s economic space as a threat to national economic security. The decree entrusted the authorities with the task of reducing its scale. One of the manifestations of considerable efforts undertaken in this direction was the development and approval of the Spatial Development Strategy of the Russian Federation for the period up to 2025, where for each region of Russia there is a list of economic activities, the development of which can strengthen the region’s position in the country’ s national economy. However, this task seems to be very problematic. The greatest concern is the lack of an opportunity to reliably determine the effectiveness of the actions taken by the authorities and establish which of the previous decisions aggravated this circumstance. This state of affairs is due to the fact that to date economists have not been able to accurately and correctly assess the degree of heterogeneity of Russia’s economic space and its enlarged administrative-territorial units, for example, major economic regions, including the dynamics of this heterogeneity over the past decades. The purpose of our study is to carry out such an assessment, which will serve as a basis for developing recommendations for smoothing out heterogeneity.
Referring to the current research, it is easy to notice that one of the common mistakes when trying to give such an assessment is to implement it using the polar value gap coefficient, which implies the “utilization” of 83 regions of the country. It is noteworthy that such a mistake is made both by young researchers, for example A.K. Gubanova, who speaks about the excessively high degree of heterogeneity of the Russian economic space only on the basis that “GRP of the Altai Republic is 310 times less than GRP of Moscow” (Gubanova, 2019), and by experienced scientists, in particular employees of the World Bank, M. Bussolo, M.E. Davalos, V. Peragine, R. Sundaram, who expressed the opinion that Russia is among the world leaders in terms of the scale of regional development imbalances, since “the standard of living in the Sakhalin Oblast is similar to that of Singapore, and in the Republic of Ingushetia it is imperceptibly different from that of Honduras”2, the correctness of this statement was fully supported by Candidate of Sciences (Economics) V.S. Fedolyak (Fedolyak, 2019). Among the economists who have chosen a more competent approach, first of all I would like to mention E.A. Kolomak. She assessed the degree of heterogeneity of the Russian economic space using the Theil index calculated by the formula:
T = HU^ In ^ . (1)
where:
Yi – GRP volume of any region;
-
Y – total GRP volume of Russian regions;
-
n – number of regions in Russia.
The formula (1) implies consideration of all Russian regions, but E.A. Kolomak took into account only 77 of them. In addition, her work has two other very serious drawbacks. First, it presents the results of calculating the Theil index only for individual time points (1995, 2000, 2005 and 2009) included in the time interval covered by the author (1995–2009). Second, the study was conducted in 2013, and therefore there is no information about the extent of heterogeneity of the economic space Russia for the nearest retrospective (Kolomak, 2013). One of the more relevant is the study conducted by G.Yu. Gagarina and R.O. Bolotov. It should rightfully be recognized as one of the best in this field, because in addition to estimating the degree of heterogeneity of the economic space of Russia as a whole, the authors assess the degree of heterogeneity of the economic space of the federal districts (Gagarina, Bolotov, 2021). However, we have to admit that their research is not ideal either, because the use of the Theil index in this case is not entirely correct due to the dependence of the maximum value of the individual index for each federal district on the number of regions covered. Moreover, this negative feature of the indicator obliges the researchers to assess the degree of heterogeneity of Russia’s economic space either for the period beginning in 2014 or for the period ending in 2013, due to the increase in the number of regions in the country in 2014. Failure to comply with such a restriction reduces the accuracy of conclusions about the dynamics of the magnitude of imbalances in the regional development of the Russian economy.
Some researchers, for example, R.F. Turovsky and K.Yu. Dzhavatova, attempted to estimate the degree of heterogeneity of Russia’s economic space using the coefficient of variation (Turovsky, Dzhavatova, 2019), calculated as follows:
-
V= ( 2 ) X 100 , (2)
where:
-
σ – standard deviation;
µ – average GRP volume by regions of Russia.
As follows from the equation (2), the maximum value of the coefficient of variation, unlike the maximum value of the Theil index, does not depend on the number of Russia’s regions; however, the final value of the coefficient is quite closely dependent on the average volume of their GRP; this fact also reduces the accuracy and correctness of the obtained assessment of the degree of heterogeneity of Russia’s economic space.
Our research is designed to eliminate all of the above gaps in this area of economic science. We will conduct the research in four main stages. At the first stage, it is necessary to assess the degree of heterogeneity of the Russian economic space for the period from 2000 to 20193 using a special coefficient, the formula for its calculation was developed by Professor S.G. Svetunkov (hereinafter referred to as the Svetunkov index) in 20034:
I _ (n^d f )-!
n-1
where:
n – number of units forming the set under consideration;
di – share of the i-th unit in the indicator of the set under consideration.
According to the equation (3), the coefficient used in the course of our study is a modified version of a well-known indicator called the Herfindahl-Hirschman index. This modification eliminates a significant disadvantage of the specified index, which consists in its high sensitivity to the number of units included in the studied population, which makes it difficult to interpret its values. Thus, the advantages due to which the Svetunkov index can be used accurately to assess the degree of heterogeneity of the economic space of Russia and its economic regions, in addition to a very simple calculation, are as follows:
– it takes into account all territorial entities that are part of Russia or that form a particular economic region;
-
– it helps to find the final value in a strictly defined numerical range from 0 to 1 and interpret it fairly simply (the closer to 1, the higher the degree of heterogeneity of the economic space);
-
– independence of the final value from the average GRP volume in the territorial entities that are part of Russia or that form an economic region;
– it helps to take into account GRP of territorial entities that are part of Russia or that form an economic region, not in absolute terms, but in fractions of a unit, which is more correct, since with an increase in GRP of one entity, the
size of the share of all other regions in the volume of GRP changes at the aggregated level.
Despite the fact that the Svetunkov index was developed to assess the degree of monopolization of the market, its use in order to assess the extent of heterogeneity of the economic space of Russia is also appropriate, because this space resembles a market that unites 85 firms, among which there are both strong and weak players. The economic space of many economic regions of the country can be characterized similarly.
The information base for assessing the degree of heterogeneity of the Russian economic space is the data presented on the official website of the Federal State Statistics Service5. At the second stage, it is advisable to carry out a regression analysis of the dependence of the Svetunkov index on the indicator, which should be called the level of subsidized orientation of the federal budget:
LSF = (Y) X100, (4)
where:
s – the amount of allocated subsidies to equalize the budgetary provision of RF constituent entities and municipalities;
Y – the total amount of federal budget expenditures.
The results of the analysis will serve as a clear proof of the importance of the authorities solving the task of smoothing the heterogeneity of Russia’s economic space.
At the third stage of the study, the Svetunkov index will be used to assess the degree of heterogeneity of the economic space of all economic districts of Russia, which are understood as large economic regions, with the exception of the Kaliningrad economic region. It consists of only one subject – the Kaliningrad Oblast, which
-
5 National Accounts. Official website of the Federal State Statistics Service. Available at: https://rosstat.gov.ru/accounts (accessed: January 24, 2022).
makes it meaningless to apply such a procedure to it and impossible to apply the formula (3) to it. At the fourth stage, recommendations will be developed, which will probably help to smooth out the heterogeneity of the economic space of multisubject Russian economic districts and the country as a whole, and therefore, fulfill the task set for the authorities by Presidential Decree 208, dated May 13, 2017.
To assess the degree of heterogeneity of the Russian economic space using the formula (3), it is necessary, first of all, to determine what contribution each region makes to the total GRP. The sample results of these calculations are presented in Table 1 .
A detailed calculation of the Svetunkov index is given in Table 2.
In order for the Svetunkov index to be reliably recognized as the most accurate and correct, its values (see Tab. 2) should be compared with the values of all indicators used to assess the degree of heterogeneity of Russia’s economic space (Tab. 3) , including a correlation analysis of the relationship between them.
The results of the correlation analysis of the relationship between the indicators presented in Table 3 are reflected in Table 4 .
The data in Tables 3 and 4 indicate that the dynamics of the Svetunkov index are almost completely synchronous with the dynamics of the Theil index and the coefficient of variation; and the dynamics of the polar value gap coefficient are markedly different from the dynamics of all three of these indicators. But if the polar value gap
Table 1. Share of some regions* in the total GRP of Russia in 2000–2019
|
Year |
Region |
||||||||||||
|
1 |
2 |
3 |
4 |
5 |
6 |
7 |
8 |
9 |
10 |
11 |
12 |
13 |
|
|
200 0 |
0.2014 |
0.0702 |
0.0373 |
0.0327 |
0.0324 |
0.0307 |
0.0271 |
0.0252 |
0.0244 |
0.0238 |
0.0216 |
0.0210 |
0.0204 |
|
2001 |
0.1911 |
0.0694 |
0.0334 |
0.0351 |
0.0298 |
0.0328 |
0.0279 |
0.0233 |
0.0251 |
0.0250 |
0.0233 |
0.0199 |
0.0257 |
|
2002 |
0.2022 |
0.0632 |
0.0264 |
0.0385 |
0.0287 |
0.0358 |
0.0269 |
0.0215 |
0.0236 |
0.0249 |
0.0204 |
0.0197 |
0.0300 |
|
2003 |
0.2037 |
0.0668 |
0.0254 |
0.0381 |
0.0284 |
0.0384 |
0.0265 |
0.0226 |
0.0239 |
0.0231 |
0.0195 |
0.0205 |
0.0264 |
|
2004 |
0.2043 |
0.0685 |
0.0262 |
0.0388 |
0.0280 |
0.0383 |
0.0261 |
0.0223 |
0.0234 |
0.0225 |
0.0191 |
0.0209 |
0.0255 |
|
2005 |
0.2293 |
0.0776 |
0.0244 |
0.0370 |
0.0268 |
0.0393 |
0.0264 |
0.0212 |
0.0223 |
0.0207 |
0.0181 |
0.0194 |
0.0245 |
|
2006 |
0.2339 |
0.0709 |
0.0260 |
0.0367 |
0.0269 |
0.0415 |
0.0291 |
0.0225 |
0.0217 |
0.0215 |
0.0171 |
0.0199 |
0.0243 |
|
2007 |
0.2395 |
0.0618 |
0.0263 |
0.0400 |
0.0271 |
0.0463 |
0.0294 |
0.0211 |
0.0209 |
0.0232 |
0.0171 |
0.0206 |
0.0213 |
|
2008 |
0.2433 |
0.0571 |
0.0218 |
0.0422 |
0.0273 |
0.0485 |
0.0272 |
0.0219 |
0.0206 |
0.0237 |
0.0179 |
0.0196 |
0.0212 |
|
2009 |
0.2227 |
0.0556 |
0.0234 |
0.0461 |
0.0277 |
0.0475 |
0.0258 |
0.0202 |
0.0182 |
0.0269 |
0.0169 |
0.0174 |
0.0203 |
|
2010 |
0.2222 |
0.0523 |
0.0280 |
0.0451 |
0.0266 |
0.0486 |
0.0278 |
0.0201 |
0.0185 |
0.0273 |
0.0165 |
0.0173 |
0.0208 |
|
2011 |
0.2192 |
0.0538 |
0.0258 |
0.0461 |
0.0288 |
0.0480 |
0.0284 |
0.0207 |
0.0184 |
0.0274 |
0.0185 |
0.0171 |
0.0213 |
|
2012 |
0.2137 |
0.0542 |
0.0237 |
0.0457 |
0.0288 |
0.0472 |
0.0297 |
0.0230 |
0.0188 |
0.0292 |
0.0172 |
0.0169 |
0.0239 |
|
2013 |
0.2184 |
0.0504 |
0.0232 |
0.0460 |
0.0287 |
0.0471 |
0.0290 |
0.0215 |
0.0194 |
0.0307 |
0.0163 |
0.0163 |
0.0254 |
|
2014 |
0.2159 |
0.0483 |
0.0238 |
0.0450 |
0.0281 |
0.0463 |
0.0280 |
0.0213 |
0.0194 |
0.0302 |
0.0165 |
0.0168 |
0.0276 |
|
2015 |
0.2056 |
0.0480 |
0.0254 |
0.0515 |
0.0284 |
0.0484 |
0.0277 |
0.0200 |
0.0192 |
0.0294 |
0.0162 |
0.0184 |
0.0273 |
|
2016 |
0.2040 |
0.0422 |
0.0246 |
0.0553 |
0.0278 |
0.0568 |
0.0285 |
0.0192 |
0.0184 |
0.0305 |
0.0155 |
0.0180 |
0.0274 |
|
2017 |
0.2074 |
0.0446 |
0.0248 |
0.0537 |
0.0284 |
0.0538 |
0.0283 |
0.0187 |
0.0182 |
0.0304 |
0.0156 |
0.0178 |
0.0308 |
|
2018 |
0.2082 |
0.0500 |
0.0263 |
0.0530 |
0.0291 |
0.0515 |
0.0269 |
0.0193 |
0.0180 |
0.0277 |
0.0158 |
0.0169 |
0.0338 |
|
2019 |
0.2075 |
0.0481 |
0.0284 |
0.0540 |
0.0295 |
0.0541 |
0.0267 |
0.0191 |
0.0178 |
0.0271 |
0.0158 |
0.0163 |
0.0327 |
|
* Due to the limited scope of this article, 13 subjects are represented, the total GRP of which is more than 55% of the all-Russian GRP.
Compiled according to Federal State Statistics Service data. |
|||||||||||||
Table 2. Assessment of the degree of heterogeneity of Russia’s economic space for 2000–2019
|
Year |
n |
∑in=1 d i2 |
n ∑in=1 d i2 |
(n Z P=1 d f ) - 1 |
n – 1 |
IRF |
|
2000 |
83 |
0.0578 |
4.7976 |
3.7976 |
82 |
0.0463 |
|
2001 |
0.0539 |
4.4751 |
3.4751 |
0.0424 |
||
|
2002 |
0.0573 |
4.7539 |
3.7539 |
0.0458 |
||
|
2003 |
0.0582 |
4.8276 |
3.8276 |
0.0467 |
||
|
2004 |
0.0587 |
4.8725 |
3.8725 |
0.0472 |
||
|
2005 |
0.0700 |
5.8107 |
4.8107 |
0.0587 |
||
|
2006 |
0.0714 |
5.9279 |
4.9279 |
0.0601 |
||
|
2007 |
0.0734 |
6.0894 |
5.0894 |
0.0621 |
||
|
2008 |
0.0748 |
6.2064 |
5.2064 |
0.0635 |
||
|
2009 |
0.0654 |
5.4314 |
4.4314 |
0.0540 |
||
|
2010 |
0.0652 |
5.4156 |
4.4156 |
0.0538 |
||
|
2011 |
0.0642 |
5.3285 |
4.3285 |
0.0528 |
||
|
2012 |
0.0620 |
5.1453 |
4.1453 |
0.0506 |
||
|
2013 |
0.0636 |
5.2823 |
4.2823 |
0.0522 |
||
|
2014 |
85 |
0.0623 |
5.2927 |
4.2927 |
84 |
0.0511 |
|
2015 |
0.0588 |
4.9941 |
3.9941 |
0.0475 |
||
|
2016 |
0.0587 |
4.9885 |
3.9885 |
0.0475 |
||
|
2017 |
0.0599 |
5.0955 |
4.0955 |
0.0488 |
||
|
2018 |
0.0605 |
5.1445 |
4.1445 |
0.0493 |
||
|
2019 |
0.0603 |
5.1293 |
4.1293 |
0.0492 |
||
|
Source: own calculation. |
||||||
Table 3. Svetunkov index and other indicators used to assess the degree of heterogeneity of the Russian economic space
|
Year |
Svetunkov index |
Polar value gap coefficient |
Theil index |
Coefficient of variation |
|
2000 |
0.0463 |
442.63 |
0.7554 |
194.87 |
|
2001 |
0.0424 |
380.15 |
0.7224 |
186.42 |
|
2002 |
0.0458 |
493.42 |
0.7385 |
193.75 |
|
2003 |
0.0467 |
460.04 |
0.7478 |
195.64 |
|
2004 |
0.0472 |
459.43 |
0.7617 |
196.79 |
|
2005 |
0.0587 |
557.35 |
0.8554 |
219.33 |
|
2006 |
0.0601 |
582.30 |
0.8616 |
221.99 |
|
2007 |
0.0621 |
443.21 |
0.8699 |
225.60 |
|
2008 |
0.0635 |
441.08 |
0.8740 |
228.17 |
|
2009 |
0.0540 |
376.03 |
0.7952 |
210.51 |
|
2010 |
0.0538 |
420.28 |
0.7993 |
210.13 |
|
2011 |
0.0528 |
377.12 |
0.7973 |
208.05 |
|
2012 |
0.0506 |
350.37 |
0.7812 |
203.60 |
|
2013 |
0.0522 |
354.66 |
0.7890 |
206.94 |
|
2014 |
0.0511 |
423.88 |
0.7905 |
207.19 |
|
2015 |
0.0475 |
320.66 |
0.7712 |
199.85 |
|
2016 |
0.0475 |
318.78 |
0.7720 |
199.71 |
|
2017 |
0.0488 |
341.59 |
0.7854 |
202.37 |
|
2018 |
0.0493 |
347.29 |
0.7982 |
203.58 |
|
2019 |
0.0492 |
347.76 |
0.7949 |
203.21 |
|
Source: own calculation. |
||||
Table 4. Indicators used to assess the degree of heterogeneity of the Russian economic space: correlation matrix
All of the above indicates that the assessment of the degree of heterogeneity of the Russian economic space, presented in Table 2, is as accurate as possible and extremely correct. It allows us, first, to see that the economic recovery in the 2000s was experienced not by the whole country, but only by its individual subjects, as evidenced by the dynamically growing value of the Svetunkov index during 2000–2008; second, it helps to establish which actions of the authorities aggravated the problem under consideration. Thus, a sharp surge in the index in 2005 may be a consequence of the completion of the policy of centralization of budget revenues at the federal level (Kulikov, Kulikov, 2017), and its growth in 2017–2018 is probably associated with an increase in the share of corporate income tax and the share of excise taxes on petroleum products credited to the federal budget (Yushkov et al., 2017).
In addition, Table 2 serves as a source of information necessary for conducting a regression analysis regarding the dependence of the level of subsidized orientation of the federal budget on the degree of heterogeneity of Russia’s economic space. Its results will show that addressing the problem of leveling the spatial development of the country is very important for the authorities. Table 5 presents a complete information base upon which an analysis will be carried out, namely, the values of the first of the parameters just listed, calculated by the formula (4) are provided and the values of the Svetunkov index are duplicated.
Table 5. Svetunkov index and the level of orientation of the federal budget toward subsidies
|
Year |
IРФ |
LSF, % |
Year |
I RF |
LSF, % |
|
2000 |
0.0463 |
9.83 |
2011 |
0.0528 |
3.63 |
|
2001 |
0.0424 |
17.40 |
2012 |
0.0506 |
3.08 |
|
2002 |
0.0458 |
14.34 |
2013 |
0.0522 |
3.14 |
|
2003 |
0.0467 |
14.74 |
2014 |
0.0511 |
2.97 |
|
2004 |
0.0472 |
13.14 |
2015 |
0.0475 |
3.12 |
|
2005 |
0.0587 |
10.20 |
2016 |
0.0475 |
3.13 |
|
2006 |
0.0601 |
9.67 |
2017 |
0.0488 |
3.74 |
|
2007 |
0.0621 |
9.90 |
2018 |
0.0493 |
3.86 |
|
2008 |
0.0635 |
5.16 |
2019 |
0.0492 |
3.71 |
|
2009 |
0.0540 |
5.99 |
2020 |
- |
3.15 |
|
2010 |
0.0538 |
5.17 |
|||
|
Source: own calculation. |
|||||
The data in Table 5 indicate that there is a relationship between the Svetunkov index for the i-th year and the level of subsidized orientation of the federal budget for the i + 1 year; this relationship emerged in 2007–2008. In other words, an increase in the Svetunkov index based on the results of a given year by x units leads to an increase in the LSF index by y percentage points in the following year. The regression analysis, which must be carried out taking into account the fact that the level of subsidized orientation of the federal budget cannot take negative values and will be zero if Russia’s economic space is absolutely homogenous, will confirm or refute the existence of such a relationship (Fig. 1) .
Figure 1 shows that the relationship between the two parameters under consideration really exists. The only case when the actual level of subsidized orientation of the federal budget, recorded at the end of 2010, deviated significantly from what was expected, can be explained by the desire of the authorities to support the regions affected by the crisis. The equation describing this dependence is as follows:
y= 1435.6843x2 - 3.0206x , (5)
where:
y – level of subsidized orientation of the federal budget in the i-th year, %;
x – value of the Svetunkov index in the i – 1 year.
The equation (5) shows that with the value of the Svetunkov index equal to 0.0424 points, the possibility of achieving which is shown in Tables 2, 3 and 5, the level of subsidized orientation of the federal budget for the year following the year of the statement of such a fact will be equal, with a probability of 90%, from 2.12 to 2.78%. That is, even under an unfavorable scenario, the volume of subsidies for equalizing the budgetary provision of RF constituent entities and municipalities will, in this case, have a noticeably smaller share in the total expenditure of the federal budget,
Figure 1. Results of the regression analysis of the dependence of the level of subsidized orientation of the federal budget on the Svetunkov index
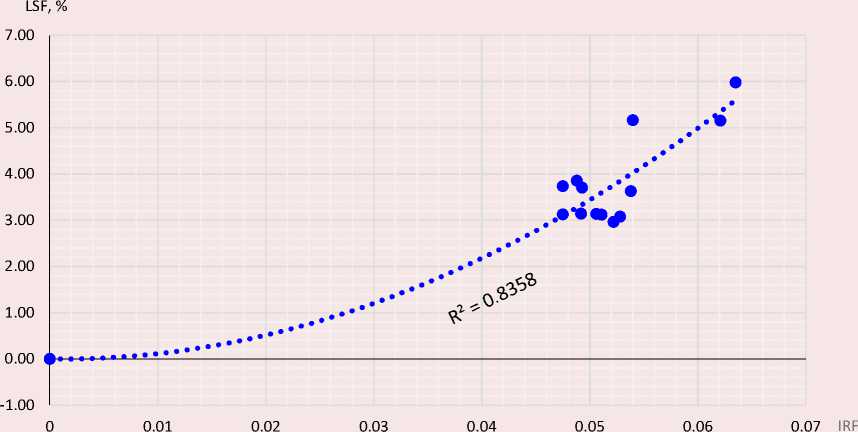
Source: own compilation.
which explains that for the Russian authorities it is important to fulfill the task of reducing the degree of heterogeneity of the country’s economic space.
When choosing the tools for solving this problem, one important point must be taken into account: Russian regions form, in addition to the country as a whole, various enlarged administrative-territorial units, for example, economic districts. The main principle of the formation of such units is the similar economic specialization of their constituent entities, which creates favorable conditions for the homogeneity of their economic space. Table 1 contains 13 regions that form seven multi-subject economic districts of Russia. In the majority of these regions, the condition of economic space is far from homogeneous. Smoothing out the disproportions in the spatial development of Russia’s economic regions by taking measures aimed at supporting the relatively weak entities is a key tool for fulfilling the task of reducing the degree of heterogeneity of the country’s spatial development; the task was set by the May presidential decree signed a year before Vladimir Putin’s fourth inauguration. To determine the right directions for the implementation of such a tool, it is necessary to calculate the Svetunkov index for 2000–2019 for all 11 multi-subject economic districts of Russia (Tab. 6).
Table 6. The degree of heterogeneity of the economic space of multi-subject economic districts of Russia in 2000–2019*
|
Year |
I CED |
I CChED |
I ESED |
I FEED |
I NED |
I NCED |
I NWED |
I VED |
I UED |
I VVED |
I WSED |
|
2000 |
0.4686 |
0.0175 |
0.3293 |
0.0572 |
0.0367 |
0.1763 |
0.3280 |
0.1080 |
0.0376 |
0.1975 |
0.1714 |
|
2001 |
0.4366 |
0.0131 |
0.3165 |
0.0509 |
0.0373 |
0.1703 |
0.3345 |
0.0998 |
0.0392 |
0.2290 |
0.1485 |
|
2002 |
0.4457 |
0.0181 |
0.2704 |
0.0504 |
0.0321 |
0.1686 |
0.3633 |
0.0950 |
0.0390 |
0.2138 |
0.1228 |
|
2003 |
0.4446 |
0.0197 |
0.2712 |
0.0475 |
0.0328 |
0.1574 |
0.3548 |
0.0971 |
0.0403 |
0.2148 |
0.1301 |
|
2004 |
0.4604 |
0.0227 |
0.2885 |
0.0482 |
0.0354 |
0.1583 |
0.3555 |
0.1028 |
0.0413 |
0.1964 |
0.1159 |
|
2005 |
0.5052 |
0.0213 |
0.2854 |
0.0498 |
0.0342 |
0.1544 |
0.3550 |
0.1041 |
0.0412 |
0.2193 |
0.1409 |
|
2006 |
0.5061 |
0.0215 |
0.2924 |
0.0459 |
0.0288 |
0.1537 |
0.3506 |
0.1059 |
0.0442 |
0.2118 |
0.1323 |
|
2007 |
0.5010 |
0.0215 |
0.2988 |
0.0497 |
0.0221 |
0.1602 |
0.3961 |
0.1037 |
0.0450 |
0.2068 |
0.1195 |
|
2008 |
0.4962 |
0.0259 |
0.2780 |
0.0500 |
0.0302 |
0.1582 |
0.4026 |
0.0983 |
0.0419 |
0.2070 |
0.1099 |
|
2009 |
0.4643 |
0.0235 |
0.2665 |
0.0507 |
0.0219 |
0.1557 |
0.3880 |
0.0942 |
0.0382 |
0.1976 |
0.1050 |
|
2010 |
0.4621 |
0.0314 |
0.3015 |
0.0567 |
0.0234 |
0.1623 |
0.3938 |
0.0941 |
0.0435 |
0.2049 |
0.0963 |
|
2011 |
0.4620 |
0.0398 |
0.2922 |
0.0576 |
0.0251 |
0.1640 |
0.4053 |
0.1028 |
0.0444 |
0.2093 |
0.1002 |
|
2012 |
0.4523 |
0.0425 |
0.2663 |
0.0570 |
0.0293 |
0.1675 |
0.3939 |
0.1000 |
0.0479 |
0.2001 |
0.1014 |
|
2013 |
0.4571 |
0.0385 |
0.2618 |
0.0588 |
0.0244 |
0.1665 |
0.4128 |
0.0949 |
0.0452 |
0.2080 |
0.0912 |
|
2014 |
0.4576 |
0.0353 |
0.2611 |
0.0628 |
0.0215 |
0.1533 |
0.4113 |
0.0925 |
0.0445 |
0.2002 |
0.0885 |
|
2015 |
0.4390 |
0.0353 |
0.2770 |
0.0597 |
0.0200 |
0.1485 |
0.4377 |
0.0951 |
0.0438 |
0.1997 |
0.0890 |
|
2016 |
0.4160 |
0.0338 |
0.2638 |
0.0568 |
0.0172 |
0.1429 |
0.4614 |
0.0919 |
0.0474 |
0.2098 |
0.0807 |
|
2017 |
0.4274 |
0.0361 |
0.2631 |
0.0573 |
0.0173 |
0.1457 |
0.4624 |
0.0948 |
0.0481 |
0.2180 |
0.0854 |
|
2018 |
0.4395 |
0.0338 |
0.2730 |
0.0653 |
0.0168 |
0.1403 |
0.4649 |
0.0993 |
0.0446 |
0.2231 |
0.0991 |
|
2019 |
0.4320 |
0.0363 |
0.2856 |
0.0595 |
0.0161 |
0.1352 |
0.4658 |
0.1002 |
0.0440 |
0.2276 |
0.1002 |
|
* The results of the correlation analysis of the relationship between the values of the Svetunkov index and the polar value gap coefficient, the Theil index and the coefficient of variation for all multi-subject economic districts presented in the Table are similar to the results of the correlation analysis conducted with respect to the values of these indicators for Russia (see Tab. 4), which confirms the maximum accuracy and correctness of the Svetunkov index. Economic districts: CED – Central, CChED – Central Chernozem, ESED – East Siberian, FEED – Far Eastern, NED – Northern, NCED – North Caucasus, NWED – Northwestern, VED – Volga, UED – Ural, VVED – Volga-Vyatka, WSED – West Siberian. Source: own calculation . |
|||||||||||
The calculation of the indicators presented in Table 6 for any economic district was based on the shares contributed by each of its constituent region to its gross district product, which should be understood as the total GRP of the entities forming the economic district. The table clearly reflects the picture that developed in 2000–2019 in all multisubject economic districts of the country. Only two of them (Central Chernozem and Northern) are characterized by a degree of heterogeneity of the economic space, noticeably inferior to the all-Russian indicator. Since the Svetunkov index calculated in relation to them has no upward trend, they are not of interest in the context of this study. The remaining nine economic districts need to be considered in detail.
The economic space of the Central Economic District is one of the most heterogeneous. This is due to the presence of the Moscow agglomeration in its composition, which attracts labor resources from all over the country, and therefore is a given property of this area. But at the same time, smoothing out the imbalances in its spatial development is a key way to reduce the degree of heterogeneity of the economic space of Russia (Tab. 7) .
According to Table 7, the Central Economic District is the only economic district where the dynamics of the Svetunkov index in 2000–2019 had a direct and strong impact on the dynamics of the Svetunkov index of the country as a whole. This state of affairs indicates the need for the authorities to pay increased attention to this area as part of the solution of their task. Considering the contribution of all the regions forming it to the volume of its gross district product during the studied time period, it is easy to notice that the Ivanovo, Kostroma and Oryol oblasts require increased support, since the share of each of which in gross district product of this economic district in the near retrospect was less than 1%, while showing a downward trend.
The value and dynamics of the Svetunkov index in the North Caucasus Economic Disrtict are also of interest. In 2000–2019, its index showed a decline, and in the coming years, with a high degree of probability, this trend may continue (Fig. 2).
According to the forecast presented in Figure 2, the value of the Svetunkov index for the North Caucasus Economic District will no longer exceed 0.14 points, and in 2024 it will update the “historical minimum” reached in 2019. However, the authorities have an opportunity to accelerate this trend. The process of its implementation implies a tough fight against the shadow economy in a number of regions that are part of the economic district, in particular in the subjects forming the federal
Table 7. Degree of heterogeneity of the economic space of Russia and its economic districts: results of correlation analysis of the relationship
|
Economic district |
Correlation coefficient between IRF and IED |
Economic district |
Correlation coefficient between IRF and IED |
|
Central |
0.8388*** |
Northwestern |
-0.0117 |
|
Central Chernozem |
0.0082 |
Volga |
0.2561 |
|
East Siberian |
-0.0210 |
Ural |
0.1686 |
|
Far Eastern |
-0.3108 |
Volga-Vyatka |
-0.1521 |
|
Northern |
-0.0889 |
West Siberian |
-0.0352 |
|
North Caucasus |
-0.0598 |
||
|
Notes: a) the IED indicator means the Svetunkov index for the corresponding economic district; b) *** – absence of asterisks means that this correlation coefficient is not statistically significant. Compiled with the use of data from Table 2 and Table 6. |
significance at 1% level; c) the |
||
Figure 2. The degree of heterogeneity of the economic space of the North Caucasus Economic District
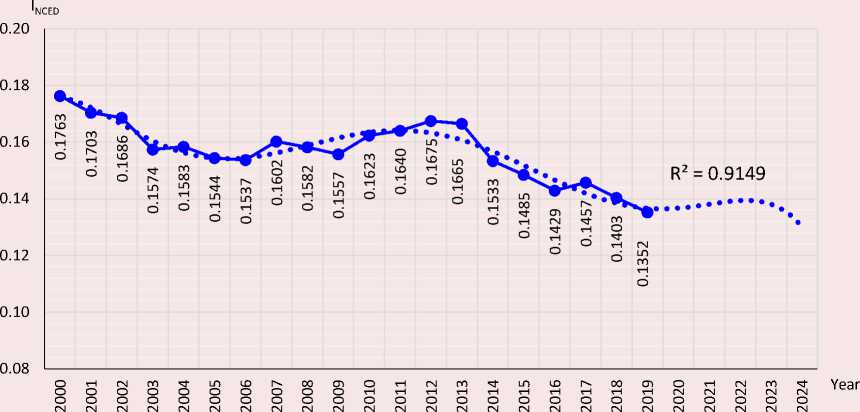
Source: own compilation.
district of the same name, in each of which, with the exception of Stavropol Krai, the level of the shadow economy in 2015 exceeded 50% of GDP (Balog, 2017), and the situation has not improved so far. The negative side of this state of affairs is that the consolidated budgets of these regions do not receive the tax revenues in the fullest amount (Berkovich, Shurygin, 2017; Alimuradov et al., 2021), and therefore, they are limited in the implementation of such an instrument to stimulate economic growth as an increase in budget expenditures.
A universal way to reduce the degree of heterogeneity of economic space in both Siberian economic districts is the implementation of an investment project for the construction of a railway that will connect the East Siberian Republic of Tyva with the West Siberian Republic of Altai. It will satisfy the need of these subjects for new jobs, the acute shortage of which often encourages residents to commit various illegal acts, and will eliminate one of the key problems of the Republic of Tyva associated with its lack of railway communication with other regions of Russia, which does not allow it to effectively use the rich mineral resource potential represented by fresh water deposits, mineral groundwater, solid minerals (gold, polymetallic ores, asbestos, etc.).
The huge unevenness of the economic space of the Northwestern Economic District is due to the fact that it includes the following regions: a) Saint Petersburg, whose share of GRP in the volume of gross district product in 2000–2006 exceeded 65%, in 2007–2015 it overcame the threshold of 70%, and in 2016–2019 it was slightly more than 75%; b) the Leningrad Oblast, characterized by relatively moderate economic development; c) the Novgorod and Pskov oblasts, which are depressed regions of Russia. Due attention on the part of the authorities to the last two oblasts will probably reduce the value of the Svetunkov index for this economic district, and therefore for the country as a whole. In the
Far Eastern Economic district, such attention is required, first of all, by the Jewish Autonomous Oblast and Chukotka Autonomous Okrug, in the Volga Economic District – the Republic of Kalmykia, the Penza and Ulyanovsk oblasts, in the Volga-Vyatka Economic District – the Republic of Mari El and the Republic of Mordovia, in the Ural Economic District – the Kurgan Oblast and the Udmurt Republic.
The degree of heterogeneity of Russia’s economic space (see Tab. 2) and many of its multisubject economic districts (see Tab. 6) increased due to the policy of concentrating budget revenues at the federal level; thus, one of the key measures to support all of the above entities may be the transfer of certain taxes to their budgets. We are talking about VAT and part of the corporate income tax currently credited to the federal budget. The introduction of appropriate amendments to the Tax and Budget codes will allow 14 entities to increase budget expenditures; this will help to increase their GRP. The effectiveness of such support is easily proved by the example of constituent entities of the Central and Ural economic districts (Tab. 8, 9).
The results of calculation of the potential GRP volumes of these entities in 2019, i.e. the volumes that these regions would probably have reached by the end of 2019 if they were provided with support during the specified year, are shown in Table 9.
Table 8. Dependence of the GRP volume of some regions in need of support on the volume of expenditure of their budgets
|
Region |
Equation describing the dependence |
R2 |
|
Ivanovo Oblast |
y = 10-10x2 + 0.0008x + 20548.4065 |
0.9403 |
|
Kostroma Oblast |
y = 3 x 10-11x 2 + 0.0053x + 5740.4499 |
0.9615 |
|
Oryol Oblast |
y = 2 x 10-10x 2 + 0,0009x + 34783.7296 |
0.9746 |
|
Kurgan Oblast |
y = 0.0051x + 5814.5667 |
0.9808 |
|
Udmurt Republic |
y = 7 x 10-11 + 0.0027x + 53026.1594 |
0.9774 |
|
Source: own calculation based on information on the volume of expenditures of regional budgets and the volume of their GRP for 2000–2019. |
||
Table 9. Budget expenditures and GRP volume of some regions of Russia in 2019: actual and potential values
|
Indicator |
Ivanovo Oblast |
Kostroma Oblast |
Oryol Oblast |
Kurgan Oblast |
Udmurt Republic |
|
Actual amount of budget expenditures, thousand rubles |
41945693.8 |
33440857.5 |
35207250.8 |
47832043.2 |
82948883.0 |
|
Actual volume of GRP, million rubles |
254968.9 |
203821.4 |
265672.7 |
233468.6 |
721345.1 |
|
Paid to the federal budget, thousand rubles: |
|||||
|
- VAT |
7507743 |
9853240 |
5765626 |
8930007 |
45108435 |
|
- corporate income tax |
553731 |
2915129 |
586820 |
390475 |
3108472 |
|
Potential budget expenditures, thousand rubles (p. 2 + p. 5 + p. 6) |
50007167.8 |
46209226.5 |
41559696.8 |
57152525.2 |
131165790.0 |
|
Potential volume of GRP, million rubles |
357485.5 |
324410.1 |
355540.2 |
294785.3 |
1600020.8 |
|
(312622.9; |
(283817.1; |
(325375.4; |
(279442.2; |
(1498197.7; |
|
|
402348.1)* |
365003.1) |
385704.9) |
310128.3) |
1701843.9) |
* 95% confidence intervals are given in parentheses. Source: own calculation.
They allow us to determine what the degree of heterogeneity of the economic space of the Central and Ural economic districts would be in 2019 if the recommended measure were to take effect during this year. So, according to a realistic forecast, the value of the Svetunkov index for them would be 0.4213 and 0.03 points, respectively, which is 0.0107 and 0.014 points lower than the actual value, and with a favorable combination of circumstances, i.e. if all the regions considered in Table 9 reached the GRP volume equal to the upper limit of the confidence interval, the value would drop to 0.4175 and 0.0293 points respectively. This proves the effectiveness of the proposed recommendation. As for the losses of the federal budget that will occur as a result of the authorities following such a recommendation, the way to compensate them is the possibility of increasing the external state debt, advocated by Academician A.G. Aganbegyan. He emphasizes that “Russia can borrow 30–40 billion US dollars annually from China, Saudi Arabia and some other countries” (Aganbegyan, 2019).
In the course of the study, we considered methods used by the academia to assess the degree of heterogeneity of Russia’s economic space, including their shortcomings. We propose to carry out such an assessment, taking into account the shortcomings, using the Svetunkov index, a modified version of the Herfindahl – Hirschman index, named after Professor S.G. Svetunkov who developed this modification. Using the Svetunkov index to assess the degree of heterogeneity of the economic space of Russia and all its multi-subject economic districts (economic regions consisting of more than one subject), and having carried out a correlation analysis of the relationship between the values of this index and such popular indicators as the polar value gap coefficient, the Theil index and the coefficient of variation, we have established that the Theil index and the coefficient of variation are closely related to the Svetunkov index. Since their shortcomings are not serious, and the Svetunkov index is devoid of these shortcomings, it was the Svetunkov index that was recognized as the most accurate and correct one.
In practice, the Svetunkov index will allow us to reliably determine which actions of the authorities can have a significant impact, both positive and negative, on the degree of heterogeneity of the economic space of Russia and its economic districts. The results of the study show that this heterogeneity was reinforced by the policy of concentrating budget revenues at the federal level. Therefore, our recommendations to reduce heterogeneity are related to the transfer of VAT and the part of the corporate income tax credited to the federal budget to the budgets of some entities, namely those that make a small contribution to the volume of the gross district product of the corresponding economic district. The effectiveness of such recommendations is proved by the example of constituent entities of the Central and Ural economic districts.
References Imbalances in the spatial development of Russia and its economic regions: choosing an accurate and adequate assessment method and levelling-off ways
- Aganbegyan A.G. (2019). On urgent measures to resume socio-economic growth. Problemy prognozirovaniya=Studies on Russian Economic Development, 1(172), 3–15 (in Russian).
- Alimuradov M.K., Midov A.Z., Odintsov S.V. (2021). Strategic analysis of highly subsidized regions’ budget efficiency. Ekonomicheskoe vozrozhdenie Rossii=Economic Revival of Russia, 2(68), 113–129. DOI: 10.37930/1990-9780-2021-2-68-113-129 (in Russian).
- Balog M.M. (2017). Assessing the shadow economy in the regions of Russia. Vestnik Pskovskogo gosudarstvennogo universiteta. Seriya: Ekonomika. Pravo. Upravlenie, 6, 49–56 (in Russian).
- Berkovich M.I., Shurygin A.A. (2021). Shadow economy in Russia: Economic and statistical assessment of its scale and the ways of its reduction in the country and regions. Ekonomicheskie i sotsial'nye peremeny: fakty, tendentsii, prognoz=Economic and Social Changes: Facts, Trends, Forecast, 14(5), 70–84. DOI: 10.15838/esc.2021.5.77.4 (In Russian).
- Bigoni M., Bortolotti S., Casari M., Gambetta D., Pancotto E. (2016). Amoral familism, social capital, or trust? The behavioural foundations of the Italian North-South divide. The Economic Journal, 126(594), 1318–1341. DOI: 10.1111/ecoj.12292
- Dirksmeier P. (2017). Regional development in a postcolonial island state in the Global South: An empirical analysis of the Republic of Mauritius using census and survey data. Journal of Economic Geography, 61(3–4), 119–134. Available at: https://doi.org/10.1515/zfw-2017-0012
- Dugarzhapova M.A., Zhalsaraeva E.A., Chimitdorzhieva E.Ts. (2019). Analyzing uneven indicators of the dynamics of economic development of Russian regions using statistical methods. Gorizonty ekonomiki, 5(51), 71–78 (in Russian).
- Fedolyak V.S. (2019). Interregional disproportions of socio-economic development as seen through the prism of basic theories of regional economy. Izvestiya Saratovskogo universiteta. Novaya seriya. Seriya: Ekonomika. Upravlenie. Pravo=Izvestiya of Saratov University. New Series. Series Economics. Management. Law, 19(1), 16–20. DOI: 10.18500/1994-2540-2019-19-1-16-20 (in Russian).
- Gagarina G.Yu., Bolotov R.O. (2021). Valuation of inequality in the Russian Federation and its decomposition using the Theil index. Federalizm=Federalism, 26(4)(104), 20–34. DOI: 10.21686/2073-1051-2021-4-20-34 (in Russian).
- Granberg A.G. (2011). Disintegration of Russia: Is it possible?. Region: Ekonomika i Sotsiologiya=Region: Economics and Sociology 2, 9–18 (in Russian).
- Gubanova A.K. (2019). Problems of economic inequality of Russia’s regions. Vestnik nauki, 4(8)(17), 9–14 (in Russian).
- Hassink R., Kiese M. (2021). Solving the restructuring problems of (former) old industrial regions with smart specialization? Conceptual thoughts and evidence from the Ruhr. Review of Regional Research, 41(3), 131–155. DOI: 10.1007/s10037-021-00157-8
- Kolomak E.A. (2013). Uneven Spatial development in Russia: Explanations of new economic geography. Voprosy ekonomiki, 2, 132–150. DOI: 10.32609/0042-8736-2013-2-132-150 (in Russian).
- Kulikov N.I., Kulikov A.N. (2017). The difference of socio-economic development of the Russian regions: Evaluation and conditions for alignment. Regional'naya ekonomika: teoriya i praktika=Regional Economics: Theory and Practice, 15(12), 2190–2209. DOI: 10.24891/re.15.12.2190 (in Russian).
- Kuznetsova I.I. (2006). The problem of territorial differentiation in the regional economy and the possibilities of its research at the urban level. Trudy Instituta sistemnogo analiza Rossiiskoi akademii nauk, 22, 261–268 (in Russian).
- Lagravinese R. (2015). Economic crisis and rising gaps North-South: Evidence from the Italian regions. Cambridge Journal of Regions, Economy and Society, 8(2), 331–342. DOI: 10.1093/cjres/rsv006
- Myrdal G. (1957). Economic Theory and Under-developed Regions. London: Gerald Duckworth & Co Ltd.
- Thünen I. von (1842). Der isolierte Staat in Beziehung auf Landwirtschaft und Nationalökonomie. Rostock.
- Turovskii R.F., Dzhavatova K.Yu. (2019). Regional disparity in Russia: Can centralization become a remedy? Politicheskaya nauka=Political Science, 2, 48–73. DOI: 10.31249/poln/2019.02.03 (in Russian).
- Yushkov A.O., Oding N.Yu., Savul'kin L.I. (2017). The trajectories of donor regions in Russia. Voprosy ekonomiki, 9, 63–82. DOI: 10.32609/0042-8736-2017-9-63-82 (in Russian).
