Impact of Cognitive and Emotional Intelligence on Quality Education

Author: Shilpi Saxena, Sharad Saxena
Journal: International Journal of Modern Education and Computer Science (IJMECS) @ijmecs
Article in issue: 10 vol.4, 2012.
Free access
At present school and colleges are expanding very much quantitatively but less attention is being paid at the quality of education. In order to improve the quality of any course, the present study will be conducted, and this study is related to the improvement of the selection criterion of candidates by introducing the significance of testing emotional intelligence also. Till now the gold standard of selection the candidates for any course, has been cognitive intelligence tests. Previous researches had proved that emotional intelligence is much more important than cognitive intelligence. Then it should also be measured or tested. In other words if a student is cognitively intelligent, will he/she also be emotionally intelligent relatively or not. Is it different according to sex, locality etc. so in order to find out the difference between cognitive and emotional intelligence of students we have performed this study.
Emotional Intelligence, Cognitive Intelligence, Quality Education
Short address: https://sciup.org/15014496
IDR: 15014496
Text of the scientific article Impact of Cognitive and Emotional Intelligence on Quality Education
Emotional intelligence is understanding own emotions and those of others, and ability to use this information to achieve best outcome for all consent [3][4]. Knowing their emotions come from and being able to manage your own and those of others, being able to work well with others as well as alone. As a result it is fundamental for better adjustment and better adjustment is fundamental to improve a person’s efficiency in work. That is why one cannot neglect the importance of EI. Essentially it is the competence to identify and express, understand, assimilate emotions into thought and regulate both positive and negative emotions in the self and others. As a concept, emotional intelligence has been discussed by various researchers in the literature as a consequence of the work of Goleman [5]. They have used the concept in terms of its role in more effective leadership in the workplace. Goleman has claimed that emotional intelligence “can be as powerful and at times more powerful than IQ”.
Cognitive Intelligence contains intellectuals’ ability such as logic, reasoning, reading-writing, analyzing and prioritizing. They go on simply utilizing only the neocortex, not the emotional centers of the brain which also provide crucial information. These abilities do not requires any social skills i.e., a mathematic equation can be solved itself or write an essay or balance a business book by yourself. The classical behavioral biologist definition of intelligence is, “Intelligence is the ability to adapt new condition and to successfully cope with life situations” , and seems to be the best. Intelligence, here depends on available physical tools and specific life experience (individuals hidden knowledge, preference and excess to information) therefore it’s not enough selective to be measured, compared or designed.
The recognition of the role of emotions in learning and teaching in higher education is long overdue. The role of educators in educational institutions is not confined to imparting knowledge and skills, but also encouraging students to express and manage their emotions well as part of their character and personality development [6].
Teaching skills, like self-awareness, managing distressing emotions and empathy to the students makes them better learners. To use emotional intelligence in teaching means that to be able to recognize and respond to one’s own feelings and those of the learners studying in the classroom so as to make both more effective in their respective roles and encourage an emotional state in the learners on the course, which is conducive to learning. EI should be recognized as an essential component of what all teachers offer rather than being an extra quality that a minority of teachers offers to learners. A comparison between EI and CI is shown in Table I.
The rest of the paper is organized as:- Section II gives an overview of role of emotional intelligence I teaching and learning. Section III provides the objectives and related hypothesis of the work. A brief of related work is discussed in Section IV. The research methodology of the work is shown in Section V. The results and discussions pertaining to the work are depicted in Section VI. Finally Section VII concludes the paper.
TABLE I. EMOTIONAL INTELLIGENCE VS COGNITIVE INTELLIGENCE
|
Emotional Intelligence |
Cognitive Intelligence |
|
|
-
II. ROLE OF EMOTIONAL INTELLIGENCE IN TEACHING AND LEARNING
The role of educators in educational institutions is not confined to imparting knowledge and skills, but also encouraging students to express and manage their emotions well as part of their character and personality development [6]. A major part of student’s life is spent in educational institution. EI skills can be better nurtured and developed during this phase of life. In the day-to-day interaction with the students, teachers will be in a better position to notice students’ various feelings as well as they can encourage them to express their emotions in accordance to different situations. An anxious or worried student should be given attention before he/she becomes psychologically depressed. Once aware of students’ negative state of emotions, teachers should encourage students to communicate their problems with others so that they can be helped or referred to other sources of support. In addition, educators need to manage their own emotions positively. Not only can they function as role models and show students by example which feeling (and how much of) is appropriate to express depending on the situation, but they also need to be sensitive to colleagues in order to maintain effective working relationships. If teachers are responsible for assisting others to learn, then they need to recognize this emotional component of the teaching-learning exchange, and to be able to work with it; in short, teachers need to use emotional intelligence. To use emotional intelligence in teaching means that to be able to recognize and respond to one’s own feelings and those of the learners in the classroom in order to make both more effective in their respective roles and encourage an emotional state in the learners on the course, which is conducive to learning [7].
-
III. OBJECTIVE AND HYPOTHESIS OF STUDY
In this paper, we have studied and proved that, when the cognitive intelligence is measured, in any way, emotional intelligence is also being measured automatically. In other words if a student is cognitively intelligent, will he/she also be emotionally intelligent relatively or not. Is it different according to sex, locality etc. so in order to find out the difference between cognitive and emotional intelligence of students we performed some observations and analyzed the data. Following are the objectives of the study:
-
• To find out the difference between cognitive intelligence and emotional intelligence of graduate students .
-
• To find out the difference between cognitive intelligence and emotional intelligence of graduate male students.
-
• To find out the difference between cognitive intelligence and emotional intelligence of graduate female students.
-
• To find out the difference between cognitive intelligence and emotional intelligence of students belonging to Urban Locale.
-
• To find out the difference between cognitive intelligence and emotional intelligence of students belonging to Rural locale .
Following are the hypothesis of the study:
-
• There is no difference between cognitive intelligence and emotional intelligence of graduate students.
-
• There is no difference between cognitive intelligence and emotional intelligence of Graduate male students.
-
• There is no difference between cognitive intelligence and emotional intelligence of Graduate female students.
-
• There is no difference between cognitive intelligence and emotional intelligence of Graduate students belonging to Urban locale.
-
• There is no difference between cognitive intelligence and emotional intelligence of Graduate students belonging to Rural locale.
-
IV. RELATED WORK
Derksen et al. specifically explore the relationship between general intelligence and emotional intelligence among a Dutch community sample (N=873) [11]. Among the entire sample, the correlation between general intelligence (General adult mental ability scale) and emotional intelligence (Barton’s EQ-I), while statistically significant at .05, is nonetheless very small (r=.081). Among men (n=489), the correlation is r=.066, among women (n=384), it is r=.095. Neither of these correlations is statistically significant. On the basis of their data, Derksen et al. conclude that general intelligence and emotional intelligence are “psychometrically independent” [11].
Okech, studied to examine the relationships among emotional intelligence, teacher self-efficacy, length of teaching experience, and study examined difference in emotional intelligence between male teachers and female teachers [12]. Differences are found significant. Lorna L, carried out a research and findings revealed that multiple factors are involved and that a combination of attributes, including knowing how to instruct, motivate, manage and asses diverse students, along with strong verbal ability, sound subject matter knowledge and knowledge of effective teaching methodology, shows the greatest promise for producing teacher quality [12].
Romanelli, Cain, and Smith reviewed a study conducted by Pau et al. in which the EI of dental students and the effect of stress were examined [13]. Students with high EI scores were found to have more adaptive coping strategies and better time management skills; whereas students who had low EI scores also reported engaging in unhealthy behaviors such as smoking, procrastinating, and withdrawing socially. Meyer and Fletcher reviewed studies that reported similar findings among college student athletes [14]. Unfortunately, each of these studies was limited by a number of factors, including sample size and make-up, use of self report measures or qualitative analysis.
Suresh, K.J. and Joshith. V.P., found that a significant negative relationship between variables, emotional intelligence and stress for the total sample and subsamples [15]. So it can be stated that the two variables are inversely related and that individuals having high emotional intelligence may have low stress and this will directly contribute to the positive development of the individual and society. H. Indu, found that majority of Coimbatore district posses average Emotional Intelligence [16]. It was seen from the results that male and female teacher trainees did not differ in their emotional intelligence. The results also showed that there is no significant difference between the emotional intelligence of teacher trainees based on the sub-samples; type of family and type of institution.
-
V. RESEARCH METHODOLOGY
-
A. Method of the Study
In order to achieve the objectives of the study ex-post facto method was used. The choice of this method was mainly governed by its intrinsic value in comparing study group with regard to their characteristics and in ascertaining the relationship between the various sets of variables involved in the study.
-
B. Population and Sample
The population for the present study has been defined as the students studying in degree colleges of Meerut city. Hence, the findings of our study will apply to the population only.
The list of all degree colleges:-
-
1. Dr. Ambedkar Degree College, Meerut
-
2. Kishan Mahila Degree College, Kankarkhera, Meerut
-
3. Laxmi Devi Arya Kanya Degree College, Meerut
-
4. D.N. College, Meerut
-
5. Meerut College, Meerut
-
6. N.A.S. College, Meerut
-
7. R.G. College, Meerut
-
8. Kanohar Lal Mahila Mahavidylaya,Meerut
-
9. Navjeevan Kishan degree College, Mawana, Meerut
-
10. College of Professional Education, Sisauli, Garh Road, Meerut
-
11. Adharshila College of Education, Partapur Byepass, Meerut
List of selected colleges are Meerut College Meerut, D.N. College, N.A.S. College, R.G. College, Meerut. Having selected the institution, the next important step was to establish rapport with the principals/directors of each of these above institutions, they were first contacted through a personal letter then the investigator personally went to each of the above institutions to have a contact with their principals/directors. They were explained the significance and the purpose of the study and their cooperation for a successful conduct of the study. Each one of the principals was highly cooperative and extended his cooperation willingly. Since the size of the sample should be large enough to serve an adequate representation of the population about which the researcher wished to generalize his findings and small enough to be selected economically in terms of availability, in terms of both time and money and complexity of the data analysis. So far in the present study 100 students studying in degree colleges were selected for the study. The data collection fact sheets along with the computation are shown in Fig. 17, 18, 19 and 20.
-
C. Statistical Technique Used
The present investigation aimed at to find out the relationship between emotional intelligence and cognitive intelligence of graduate students. To measure each one of these variables the following tools have been employed.
-
1. Emotional intelligence scale by Anukool Hyde, Sanjyot Pethe and Upinder Dhar. Scales are shown in Table II, III and IV.
-
2. Cognitive intelligence by Jalota general mental ability test.
TABLE IV. NORMS FOR FACTOR-WISE INTERPRETATION OF RAW SCORES (N=150)
о о
Ь
A
B
C
D
E
F
G
H
I
J
Й О
Я
1
ей
Щ
Й о
"cs
о s
ей
Й
S щ
й
Pi
■ 3d
§ s
'Й м
ей
й
й о
>
и
о
m
1
Mean(M)
7.10
10.5
12.87
7.85
8.39
5.37
3.78
3.74
3.79
3.87
S.D.
2.85
3.43
3.94
2.66
2.83
1.83
1.46
1.77
1.31
1.51
Normal Range
4-10
7-14
9-17
4-10
5-11
4-7
2-5
2-5
2-5
2-5
High
11 & above
15 & above
15 & above
12 & above
12 & above
8 & above
6 & above
6 & above
6 & above
6 & above
Low
8 & below
6 & below
8 & below
3 & below
4 & below
3 & below
1 & below
1 & below
1 & below
1 & below
TABLE II. FACTORIAL VALIDITY OF SUB-SCALES OF EI
|
S.No |
Sub-scales |
Factorial Validity |
|
1. |
Self-awareness |
0.69 |
|
2. |
Empathy |
0.62 |
|
3. |
Self-motivation |
0.54 |
|
4. |
Emotional stability |
0.62 |
|
5. |
Managing relations |
0.59 |
|
6. |
Integrity |
0.62 |
|
7. |
Self-development |
0.68 |
|
8. |
Value-orientation |
0.64 |
|
9. |
Commitment |
0.69 |
|
10. |
Altruistic behavior |
0.65 |
TABLE III . NORMS FOR RAW SCORES INTERPRETATIONS (N = 150)
|
(N=200) |
|
|
Mean(M) |
68 |
|
Standard Deviation |
16 |
|
Normal |
52-84 |
|
High |
85 and above |
|
Low |
51 and below |
-
VI. RESULTS AND DISCUSSION
The objective of study is to find out difference between Cognitive Intelligence and Emotional Intelligence of graduate students. To achieve this objective the data is collected from different colleges and summarized as shown in Fig. 17 to Fig. 20 ( Annexure 1 ). The ‘t’ factor for the table is computed using formula:
t= (M1-M2)/sqrt[(sd 1 ^2)/n + (sd 2 ^2)/n]
where M1 and M2 are the mean for different values of CI and EI in a table, sd 1 and sd 2 are the standard deviation for different values of CI and EI in the table.
Data presents in Table VI and Fig. 2 reveals that the mean of female students on cognitive intelligence and emotional intelligence is 114.48 and 40.56 with their corresponding S.D.s 11.49 and 6.97 and‘t’ value is 38.47.This shows that there is significant difference between the levels of cognitive intelligence and emotional intelligence of female students at both the level of significance. Hence formulated null hypothesis is rejected.
Graph 2:Showing Mean of Female Cl and El
TABLE V. MEAN, SD AND 'T' OF CI AND EI OF MALE
|
Group |
Mean (M1 & M2) |
S.D. (sd 1 & sd 2) |
t |
|
Male CI |
114.33673 |
11.14805 |
40.67682 |
|
Male EI |
40.40206 |
6.649084 |
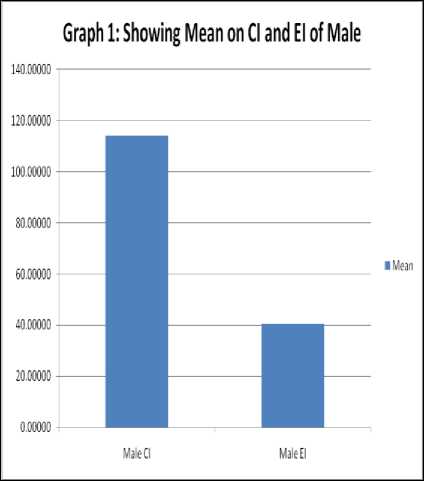
Figure 1: Difference in CI and EI of Males
Data presents in Table V and Fig. 1 reveals that the mean of male students on cognitive intelligence and emotional intelligence is 114.33 and 40.15 with their corresponding S.D.s 11.14 and 6.64 and ‘t’ value is 40.67.This shows that there is significant difference between the levels of cognitive intelligence and emotional intelligence of male students at both the level of significance. Hence formulated null hypothesis is rejected.
TABLE VI. MEAN, SD AND’T’ OF CI AND EI OF FEMALE
|
Group |
Mean |
S.D. |
t |
|
Female CI |
114.48000 |
11.49914 |
38.47857 |
|
Female EI |
40.56000 |
6.971702 |
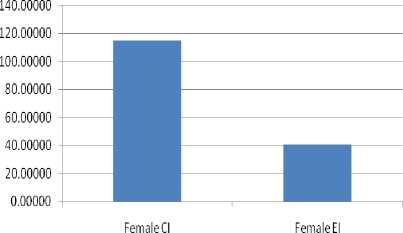
Figure 2: Difference of CI and EI of Females
TABLE VII. MEAN, SD AND ‘T’ OF CI AND EI OF URBAN
|
Group |
Mean |
S.D. |
t |
|
Urban CI |
114.48000 |
9.838214 |
15.39857 |
|
Urban EI |
40.56000 |
38.04177 |
Graph 3:Showing Mean of Urban Cl and El
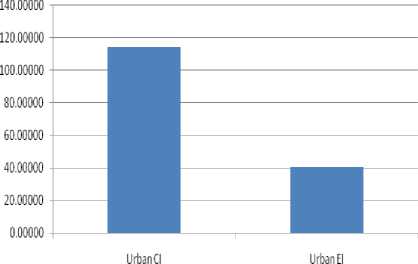
Figure 3: Mean of Urban CI and EI
Data presents in Table VII and Fig. 3 reveals that the mean of urban students on cognitive intelligence and emotional intelligence is 114.48 and 40.56 with their corresponding S.D.s 9.83 and 38.04 and ‘t’ value is 15.39. This shows that there is significant difference between the levels of cognitive intelligence and emotional intelligence of urban students at both the level of significance. Hence formulated null hypothesis is rejected.
TABLE VIII. MEAN, SD AND ‘T’ OF CI AND EI OF RURAL
Graph 4: Showing Rural Cl and El
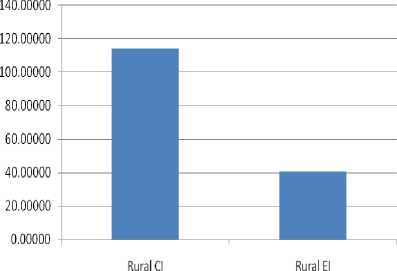
Figure 4: Rural CI and EI
Data presents in Table VIII and Fig. 4 reveals that the mean of rural students on cognitive intelligence and emotional intelligence is 114.32 and 40.29 with their corresponding S.D.s 13.03 and 47.43 and ‘t’ value is 8.64.This shows that there is significant difference between the levels of cognitive intelligence and emotional intelligence of rural students at both the level of significance. Hence formulated null hypothesis is rejected.
TABLE IX. MEAN, SD AND ‘T’ OF CI AND EI OF URBAN MALE
|
Group |
Mean |
S.D. |
t |
|
Urban Male CI |
114.51042 |
13.54552 |
26.68857 |
|
Urban Male EI |
40.42708 |
8.860002 |
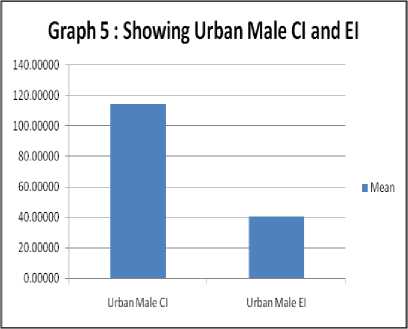
Figure 5: Urban Male CI and EI
Data presents in Table IX and Fig. 5 reveals that the mean of urban male students on cognitive intelligence and emotional intelligence is 114.51 and 40.42 with their
TABLE X. MEAN, SD AND ‘T’ OF CI AND EI OF RURAL MALE
|
Group |
Mean |
S.D. |
t |
|
Rural Male CI |
114.32292 |
19.23359 |
14.04875 |
|
Rural Male EI |
40.29167 |
10.10625 |
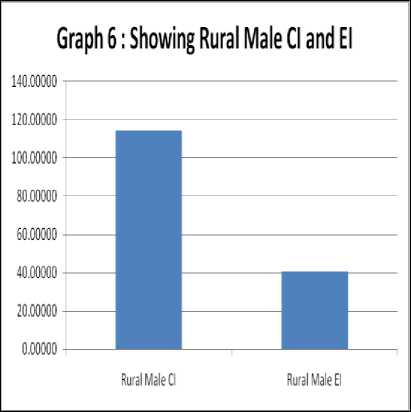
Figure 6: Rural Male CI and EI
Data presents in Table X and Fig. 6 reveals that the mean of rural male students on cognitive intelligence and emotional intelligence is 114.32 and 40.29 with their corresponding S.D.s 19.23 and 10.10 and ‘t’ value is 14.04. This shows that there is significant difference between the levels of cognitive intelligence and emotional intelligence of rural male students at both the level of significance. Hence formulated null hypothesis is rejected.
TABLE XI. MEAN, SD AND ‘T’ VALUE OF CI AND EI OF RURAL FEMALE
|
Group |
Mean |
S.D. |
T |
|
Rural Female CI |
113.95506 |
18.59168 |
13.73309 |
|
Rural Female EI |
40.18072 |
10.7743 |
Data presents in Table XI and Fig. 7 reveals that the mean of rural female students on cognitive intelligence and emotional intelligence is 113.95 and 40.18 with their corresponding S.D.s 18.59 and 10.77 and ‘t’ value is 8.64.This shows that there is significant difference between the levels of cognitive intelligence and emotional intelligence of rural female students at both the level of significance. Hence formulated null hypothesis is rejected.
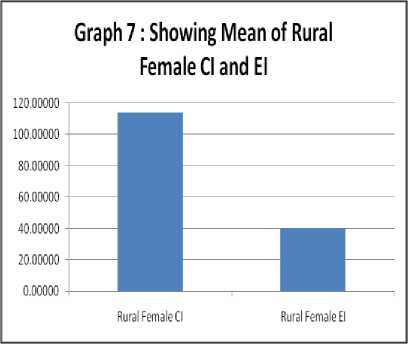
Figure 7: Rural Female CI and EI
TABLE XII. MEAN, SD AND ‘T’ VALUE OF CI AND EI OF URBAN FEMALE
|
Group |
Mean |
S.D. |
t |
|
Urban Female CI |
114.48000 |
14.01944 |
25.90155 |
|
Urban Female EI |
40.56000 |
8.498752 |
Graph 8: Showing Mean of Urban Female Cl and El
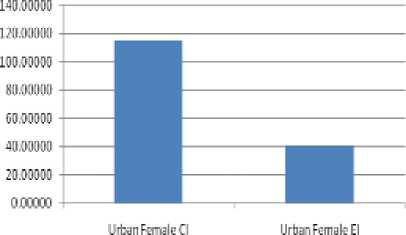
Figure 8: Urban Female CI Vs EI
Data presents in Table XII and Fig. 8 reveals that the mean of urban female students on cognitive intelligence and emotional intelligence is 114.48 and 40.56 with their corresponding S.D.s 14.01 and 8.49 and ‘t’ value is 25.90. This shows that there is significant difference between the levels of cognitive intelligence and emotional intelligence of urban female students at both the level of significance. Hence formulated null hypothesis is rejected.
Data presents in Table XIII and Fig. 9 reveals that the mean of male and female students on cognitive intelligence is 114.33 and 114.48 with their corresponding S.D.s 11.14 and 11.49 and ‘t’ value is 0.06. This shows that there is no significant difference between male and female students at both the level of significance. Hence formulated null hypothesis is accepted.
TABLE XIII. MEAN, SD AND ‘T’ VALUE OF CI OF MALE AND FEMALE
|
Group |
Mean |
S.D. |
t |
|
Male CI |
114.33673 |
11.14805 |
0.06322 |
|
Female CI |
114.48000 |
11.49914 |
Graph 9: Showing Mean of Male Cl and Female Cl
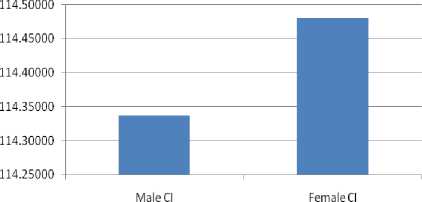
Figure 9: Mean of Male CI and Female CI
TABLE XIV. MEAN, SD AND ‘T’ VALUE OF MALE AND
FEMALE
|
Group |
Mean |
S.D. |
t |
|
Male EI |
40.40206 |
6.649084 |
0.115843 |
|
Female EI |
40.56000 |
6.971702 |
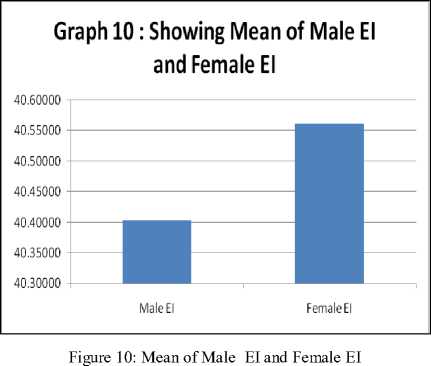
Data presents in Table XIV and Fig. 10 reveals that the mean of male and female students on emotional intelligence is 40.40 and 40.56 with their corresponding S.D.s 6.64 and 6.97 and ‘t’ value is 0.11. This shows that there is no significant difference between male and female students at both the level of significance. Hence formulated null hypothesis is accepted.
TABLE XV. MEAN, SD AND ‘T’ VALUE OF CI OF URBAN AND RURAL
|
Group |
Mean |
S.D. |
t |
|
Urban CI |
114.48000 |
9.838214 |
0.061171 |
|
Rural CI |
114.32292 |
13.03567 |
Graph 11: Showing Mean of Urban Cl and Rural Cl
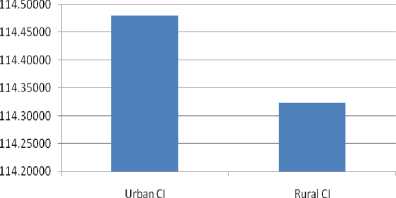
Figure 11: Mean of Urban CI and Rural CI
Data presents in Table XV and Fig. 11 reveals that the mean of urban and rural students on cognitive intelligence is 114.48 and 114.32 with their corresponding S.D.s 9.83 and 13.03 and ‘t’ value is 0.06. This shows that there is significant difference between urban and rural students at both the level of significance. Hence formulated null hypothesis is rejected.
TABLE XVI. MEAN, SD AND ‘T’ VALUE OF EI OF URBAN AND RURAL
TABLE XVII. MEAN, SD AND ‘T’ VALUE OF EI OF URBAN MALE AND URBAN FEMALE
|
Group |
Mean |
S.D. |
T |
|
Urban Male EI |
40.42708 |
8.860002 |
0.06385 |
|
Urban Female EI |
40.29167 |
8.498752 |
Graph 13: Showing Mean of Urban Male El and Female El
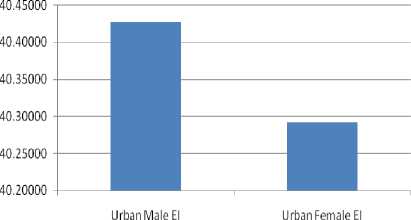
Figure 13: Mean of Urban Male EI and Female EI
Data presents in Table XVII and Fig. 13 reveals that the mean of urban male and urban female students on emotional intelligence is 40.42 and 40.29 with their corresponding S.D.s 8.86 and 8.49 and ‘t’ value is 0.06. This shows that there is no significant difference between urban male and urban female students at both the level of significance. Hence formulated null hypothesis is accepted.
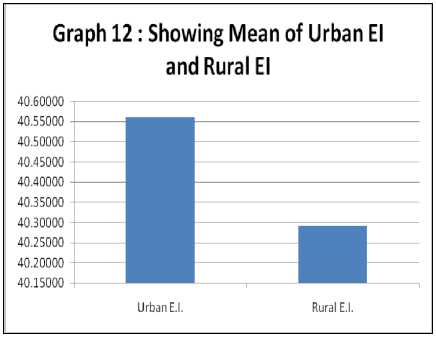
Figure 12: Mean of Urban EI and Rural EI
TABLE XVIII. MEAN, SD AND ‘T’ VALUE OF EI OF RURAL MALE AND RURAL FEMALE
|
Group |
Mean |
S.D. |
t |
|
Rural Male EI |
40.29167 |
10.10625 |
0.030465 |
|
Rural Female EI |
40.18072 |
10.7743 |
Data presents in Table XVIII and Fig. 14 reveals that the mean of rural male and rural female students on emotional intelligence is 40.29 and 40.18 with their corresponding S.D.s 10.10 and 10.77 and ‘t’ value is 0.03. This shows that there is no significant difference between rural male and rural female students at both the level of significance. Hence formulated null hypothesis is accepted.
Data presents in Table XVI and Fig. 12 reveals that the mean of urban and rural students on emotional intelligence is 40.56 and 40.29 with their corresponding S.D.s 38.04 and 47.43 and ‘t’ value is 0.02. This shows
Graph 14: Showing Mean of Rural Male El and Female El
Graph 16: Showing Mean of Urban Female El and Rural Female El
40.30000
40.28000
40.26000
40.24000
40.22000
40.20000
40.18000
40.16000
40.14000
40.12000
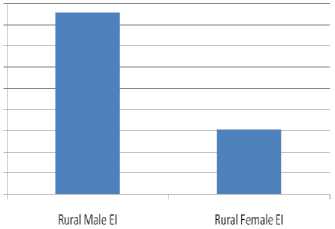
Figure 14: Mean of Rural Male EI and Female EI
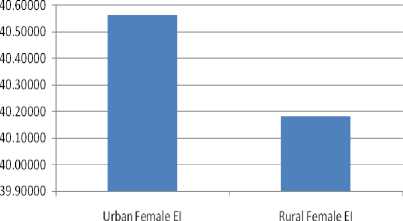
Figure 16: Mean Female Urban EI and Rural EI
TABLE XIX. MEAN, SD AND ‘T’ VALUE OF EI URBAN MALE AND RURAL MALE
|
Group |
Mean |
S.D. |
T |
|
Urban Male EI |
40.42708 |
6.358229 |
0.091832 |
|
Rural Male EI |
40.18072 |
10.10625 |
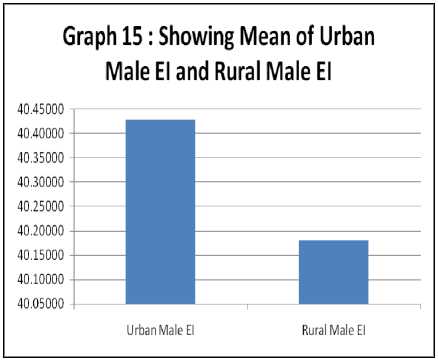
Figure 15: Mean of Urban Male EI and Rural Male EI
Data presents in Table XIX and Fig. 15 reveals that the mean of urban male and rural male students on emotional intelligence is 40.42 and 40.18 with their corresponding S.D.s 6.35and 10.10 and ‘t’ value is 0.09. This shows that there is no significant difference between urban male and rural male students at both the level of significance. Hence formulated null hypothesis is accepted.
TABLE XX. MEAN, SD AND ‘T’ VALUE OF EI URBAN FEMALE AND RURAL FEMALE
|
Group |
Mean |
S.D. |
t |
|
Urban Female EI |
40.56000 |
8.498752 |
0.123418 |
|
Rural Female EI |
40.18072 |
10.7743 |
Data presents in Table XX and Fig. 16 reveals that the mean of urban female and rural female students on emotional intelligence is 40.56 and 40.18 with their corresponding S.D.s 8.49 and 10.77 and ‘t’ value is 0.12. This shows that there is no significant difference between urban female and rural female students at both the level of significance. Hence formulated null hypothesis is accepted. The major findings of the research are as follows:
-
1. There is significant difference between
-
• The levels of cognitive intelligence and emotional intelligence of male students.
-
• The levels of cognitive intelligence and emotional intelligence of Female students.
-
• The levels of cognitive intelligence and emotional intelligence of Urban students.
-
• The levels of cognitive intelligence and emotional intelligence of Rural students.
-
• The levels of cognitive intelligence and emotional intelligence of Urban male students.
-
• The levels of cognitive intelligence and emotional intelligence of Rural male students.
-
• The levels of cognitive intelligence and emotional intelligence of Urban female students.
-
• The levels of cognitive intelligence and emotional intelligence of Rural female students.
-
2. There is no significant difference between
-
• Male and female students on cognitive intelligence.
-
• Male and female students on emotional intelligence.
-
• Urban and rural students on cognitive intelligence.
-
• Urban and rural students on emotional intelligence.
-
• Urban male and urban female students.
-
• Rural male and rural female students on cognitive intelligence.
-
• Urban male and rural male students.
-
• Urban female and rural female students.
-
VII. CONCLUSION
Emotionally healthy children are more cooperative, happier and grasp things more effectively. Educational organizations have the potential to help all learners develop into well-rounded individuals who can express themselves, form enduring relationships, contribute usefully in the world and achieve their learning potential. Emotional literacy inspires learners by enabling them to sustain their curiosity and creativity in seeking solutions to problems. It also strengthens their ability to respond to the challenges which they will face at work and in their lives. For developing a good relationship with a group of learners, emotional intelligence is a prerequisite, which can be the basis for producing learners who have: greater motivation, more engagement, a greater readiness to take risks in their learning, a more positive approach, a readiness to collaborate, and more creativity and more tenacity. There are other benefits of applying emotional intelligence like: avoiding the costs of anxiety and depression,. promoting academic success, 1aying down patterns for future life, making the whole experience more rewarding and enjoyable in developing skills that are in demand by employers.
References Impact of Cognitive and Emotional Intelligence on Quality Education
- Abraham R., Emotional Intelligence in organizations: A conceptualization. New York: Bantam Books, 1991.
- Barchard, Kimberly A. & Hakstian, A. Ralph., The nature and Measurement of Emotional Intelligence Abilities; Basic Dimensions and Their Relationships with Other Cognitive Abilities and Personality variables, Educational & Psychological Measurement, Vol 64(3) p. 437-462, 2004.
- Abraham, R., Emotional intelligence in organizations: A conceptualization, Genetic Social & General Psychology Monographs 125, (2), pp.209-224, 1999
- Cherniss, C. and Goleman D. Emotional Intelligence: Issues in Paradigm Building, www. Eiconsortium.org
- Goleman, D., Emotional Intelligence: Why it can matter more than IQ. New York: Bantam Books, 1995
- Boyd, Mary Ann. The Emotional intelligence of teachers and students’ perceptions of their teacher’s behavior in the classroom, Indiana University of Pennsylvania, pp. 234, 2005
- Okech, Allan P. An exploratory examination of the relationships among emotional intelligence, elementary school science teacher self-efficacy, length of teaching experience, race/ethnieity, gender and age, texas A & M University Kingsville, pp 120, 2004.
- Mayer, J. D., Salovey, P., & Caruso, D. R. Models of emotional intelligence. In R. J. Sternberg (Ed.), The handbook of intelligence (pp. 396–420). New York: Cambridge University Press, 2000.
- Goleman, D. Emotional Intelligence:Issues in paradigm building. In C. Chernis D. Goleman (Eds.), The Emotionally Intelligent Workplace, http://www.eiconsortium.org/research/eiissuesinparadigmLiildiiig.html, 2001.
- Goleman, D., Emotional Intelligence: Issues in paradigm. In C. Cherniss & D. Goleman (Eds.), The Emotionally Intelligent Workplace. San Francisco: OsseyBas, 2001.
- Derksen, Kramer, and Katzkp, Does a self-report measure for emotional intelligence asses something different than general intelligence? Personality and Individual Differences, 32, 37-48, 2002
- Spear, Lorna L., Mentoring the emotional dimensions of leadership: The perceptions of interns, University of Washington, pp.96, 2005.
- Romanelli, F., Cain, J., & Smith, K. M., Emotional intelligence as a predictor of academic and/or professional success. American Journal of Pharmaceutical Education, 70(3), 1-10. Retrieved December 29, from ProQuest database, 2008.
- Meyer, B. B., & Fletcher, T. B., Emotional intelligence: A theoretical overview and implications for research and professional practice in sport psychology. Journal of Applied Sport Psychology, 19, pp 1-15, 2007
- Suresh,K.J. and Joshith.V.P. Edutracks August 2008v Vol 7, P 26-27, 2008
- Indu H., Edutracks, August Vol 8, P 34-35, 2009
