Implementation of ecological monitoring on the basis of physical and chemical properties of drinking water resources of the Republic of Karakalpakstan (on the example of Nukus city and Amudaryo district)
")
Author: Razhabova N.D., Mambetullaeva S.M.
Journal: Форум молодых ученых @forum-nauka
Article in issue: 5 (46), 2020.
Free access
This article is based on some of its physical and chemical properties in the assessment of the current ecological status of drinking water resources of Nukus city and Amudarya district of the Republic of Karakalpakstan. The article used mathematical formulas to compare the amount of chemicals in drinking water and to determine how its composition changes over the years. As well as, the concepts of ecosystems, ecological environment, factors were used to explain the ecological significance of the article.
Environmental, factors, ecosystems, drinking water, turbidity, sulfate, nitrate anions, magnesium, calcium cations, mean arithmetic and geometric progression
Short address: https://sciup.org/140287895
IDR: 140287895 | UDC: 504
Text of the scientific article Implementation of ecological monitoring on the basis of physical and chemical properties of drinking water resources of the Republic of Karakalpakstan (on the example of Nukus city and Amudaryo district)
It is known widely that the scientific study of all processes that take place in the environment leads to the smooth functioning of the laws of nature. In the other words, it is possible to prevent imbalances in nature.
In general, it is not possible to study all environmental factors in isolation under natural conditions. Because this is the mechanism of the laws of nature works in such way that the elements of the environment complement each other or can completely replace this element [1;2;3;4]. Of course, this process leads to disruption of ecosystem sustainability. At this time, it is very difficult to see changes in ecosystems with the ordinary eyes, and the conclusions drawn from them lead us to misunderstand. However, through the process of empirical knowledge of natural or artificial ecosystems in nature, that is, by experimenting under natural and artificial conditions and studying the date obtained from it on the basis of deep rationality, the scientist will be able to determine whether the objects are undergoing negative or positive changes.
Based on the above basic concepts, we will study the changes in the drinking water resources of the population of the Republic of Karakalpakstan, in the current ecological condition of these resources. In this case, the objects of our study is the drinking water of the population of Nukus city (object #1) and Amudarya district (object #2). The subjects of research are water in the objects. To study the main similarities, differences and changes in physical and chemical parameters on the basis of empirical and rationality. During our study of the objects, we found that there is a certain difference between the water resources, despite the fact that the water resources in them are taken from one place. In both facilities, the turbidity of the water is high and the amount of some chemicals increases and changes are observed [5]. This can be seen in the following comparisons. Based on date from 2015, 2016, 2017, 2018 and 2019, we can determine the difference between them to some extent by comparing the arithmetic and geometric mean values of water. In which case we can use the following mathematical formulas [3;4;5;6;7].
d-^+CI2+ d3 + + "" dn
4 =----—---- ;
n
G =n^a1 •a2 ‘ d3 •_• an
Using these formulas, we compared the amount of certain chemicals in drinking water only in April. In which we calculated the arithmetic and geometric mean values of the SO 4 -2 and NO 3 - anions in the water, as well as the cations Ca+2 and Mg+2, which provide the hardness of the water.
Average arithmetic values of NO 3 - anions in drinking water:
_ 2,8 + 3,75 + 3,5 + 2,9 + 0,35 _ 2 б6
Average geometric values of SO4-2 anions in drinking water:
G =57411 • 396,5 • 382 • 431,2 • 306 = 2,53 mg/l
If we compare the values of Ca+ 2 cations obtained from the two objects in 2019, then:
Object #1 arithmetic mean of the cations of Ca+2 in drinking water:
90,2 + 100,2 + 100,2 + 84,2 + 88,2 + 72,1 + 46,1 + 52,1 + 64,1 + 74,1 +
A =---------------------—---------------------
90,2 + 88,2
----------= 79,16 mg/l
Average geometric values of Ca+2 cations in drinking water:
G=12790,2 • 100,2 • 100,2 • 84,2 • 88,2 • 72,1 • 46,1 • 52,1 •
764,1 • 74,1 •= 1,013 mg/l
Object #2 arithmetic mean of the cations of Ca+2 in drinking water:
Л =
92,2 + 110,2 + 124,2 + 80,2 + 94,2 + 70,1 + 46,04 + 56,1 + 66,1 +
74,1 + 100,2 + 86,2 -----------------= 83,32 mg/l
Average geometric values of Ca+2 cations in drinking water:
G =12792,2 • 110,2 • 124,2 • 80,2 • 94,2 • 70,1 • 46,04 • 56,1 • 66,1 • 74,1 • V100,2 • 86,2 = 1,013mg/l
Now, if we calculate the arithmetic and geometric values of Mg+2 cations in drinking water in both objects, they are as follows:
Object #1 arithmetic mean of the cations of Mg+2 in drinking water:
42,6 + 100,2 + 54,7 + 40,1 + 35,3 + 36,5 + 24,3 + 24,3 + 26,7 + 36,5 +
A = ---------------------------12---------------------------
41,3 + 41,3 ----------= 83,97 mg/Z
Average geometric values of Mg+2 cations in drinking water:
G =12742,6 • 100,2 • 54,7 • 40,1 • 35,3 • 36,5 • 24,3 • 24,3 • 26,7 • 36,5 •
741,3-41,3 =1,011mg/l
Object #2 arithmetic mean of the cations of Mg+2 in drinking water:
A =
42,6 + 51,1 + 53,5 + 38,9 + 38,9 + 35,3 + 24,3 + 24,3 + 26,7 + 36,5 + 12
36,5 + 41,3
37,49 mg/Z
Average geometric values of Mg+2 cations in drinking water:
G =12742,6 • 51,1 • 53,5 • 38,9 • 38,9 • 35,3 • 24,3 • 24,3 • 26,7 • 36,5 •
736,5 • 41,3 = 1,010 mg/l
Comparing the values obtained from the calculations: the arithmetic and geometric values of the anions NO 3 - and SO4-2 in drinking water are 2,66:2,53 (Object #1). Object #1 and Object #2 differ in arithmetic quantities and appearance in terms of the values of Ca+2 cations in water. That is, the comparisons are in rations of 79,16:83,32 relative position. There is almost no difference in the geometric values on the study of these Ca+2 cations. This is a 1,013:1,013 ratio or, say, a 1:1 ratio.
Also, the arithmetic values of the Mg+2 cations in the drinking waters of object#1 and object#2 are 83,97:37,49 or 2,24:1, while the average geometric values are 1,011:1,010 or 1:1.
In other words, we can see that the level of chemical contamination of water sources changes with arithmetic and geometric progression as a result of adverse effects on the environment. Considering the above ratios, if we focus on the arithmetic value of NO3- anions, the average value is 2,66 mg/l per month, compared to twelve months in a year. The mean geometric growth rate of SO4-2 anions is 2,53 mg/l or an average increase of 2,53 mg/l each month in addition to the total amount.
The difference between the arithmetic mean growth values of Ca+2 cations in objects # 1 and objects # 2 is 4,16 mg/l. That is the amount of Ca+2 in an object #2
is higher than in an objects # 2. Excluding the total, the geometric mean is 1,013 mg/l.
As you can see, from the diagrams below, the amount of chemicals in these drinking water resources is changing. In these diagrams we can see, that the sulphate and nitrate anions in the water of object #1 change quantitatively.
Object #1. The amount of sulfate anions in drinking water resources changes over the years.
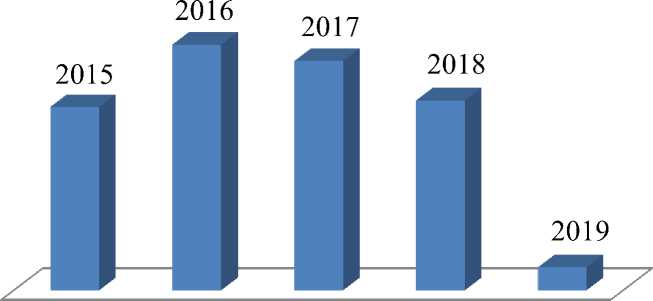
The amount of nitrate anions in drinking water resources changes over the years
As can be seen, from the diagrams above, in 2019, the amount of nitrate and sulfate anions has the lowest values. But if we look at other years, we can see that this situation is temporary.
If the pollution of water resources with such substances continues in this way, through these growth indicators we will be able to forecast the ecological status of water resources for the next five years. If the sequence of numbers continues as we have predicted, the overall environmental condition of drinking water resources in the area may not meet the required level. That’s why more needs to be done. In this case, it is important to do the following: to augmentation the environmental literacy of the local population, especially those working in agriculture, in the using of chemicals and other substances, then it is very important to grow green algae locally that have the property of purifying the water as much as possible in the ponds. In our opinion, it is not a very difficult problem to clean the water resources in the open basins with a certain amount of greenery in the local conditions. Because today, not only in foreign countries, but also in our country, many scientists have done research on the methods of biological treatment of water bodies and have achieved positive results.
References Implementation of ecological monitoring on the basis of physical and chemical properties of drinking water resources of the Republic of Karakalpakstan (on the example of Nukus city and Amudaryo district)
- МамбетуллаеваС.М., РажабоваН. Д. ЭКОЛОГИЯЛЫҚСИЯСАТ (оқыў-методикалыққолланба). Нөкис - 2019. 3-4-33-35.
- Мамбетуллаева С.М. Определение экологических критериев нормирования антропогенной нагрузки на фауну млекопитающих в низовьях Амударьи // Матер. респуб. науч.-практ. конф. "Актуальные проблемы биологии, экологии и почвоведения", Ташкент,2008.- С.85-87
- Мамбетуллаева С.М., Бахиев А.Б. Современное состояние животного и растительного мира в Республике Каракалпакстан// Материалы респуб. науч.-прак. конфер. "Достижения, перспективы развития и проблемы естествознания", Нукус, КГУ, 2011, с. 5-6.
- Tleumuratova B.S., Mambetullaeva S.M. Sistemali ekologiya, - Nukus -Ilm‖,-2016.-127-148 b.
- Tuyamo‘yin-Nukus boshqarmasi markaziy kimyo - bakteriologik laboratoriyasi" ning 5 yillik (2015, 2016, 2017, 2018, 2019 ) ma'lumotlari.
- Yu.A. Afanasev i dr. Monitoring i metodi kontrolya okrujayushey sredi -M.Izdatelstvo MNEPU, 2001 - 332 s.
- G.I.Marchuk - Matematicheskoe modelirovanie v probleme okrujayushey sredi-M.Nauka; 1982 g.320 s.
