Implementation of the Naive Bayes Classifier Method for Potential Network Port Selection

Author: Rheo Malani, Arief Bramanto Wicaksono Putra, Muhammad Rifani
Journal: International Journal of Computer Network and Information Security @ijcnis
Article in issue: 2 vol.12, 2020.
Free access
The rapid development of information technology has also accompanied by an increase in activities classified as dangerous and irresponsible, such as information theft. In the field of network systems, this kind of activity is called intrusion. Intrusion Detection System (IDS) is a system that prevents intrusion and protecting both hosts and network assets. At present, the development of various techniques and methods for implementing IDS is a challenge, along with the increasing pattern of intrusion activities. The various methods used in IDS have generally classified into two types, namely Signature-Based Intrusion Detection System (SIDS) and the Anomaly-Based Intrusion Detection System (AIDS). When a personal computer (PC) connected to the Internet, a malicious attacker tries to enter and exploit it. One of the most commonly used techniques in accessing open ports which are the door for applications and services that use connections in TCP/IP networks. Open ports indicate a particular process where the server provides certain services to clients and vice versa. This study applies the Naïve Bayes classifier to predict port numbers that have the potential to change activity status from "close" to "open" and vice versa. Predictable potential port numbers can be a special consideration for localizing monitoring activities in the future. The method applied is classified as AIDS because it based on historical data of port activity obtained through the port scan process, regardless of the type of attack. Naïve Bayes classifier is determined to have two event conditions that predict the occurrence of specific port numbers when they occur in specified duration and activity status. The study results have shown a 70% performance after being applied to selected test data.
Intrusion, IDS, SIDS, AIDS, port scan, Naive Bayes classifier, potential port number
Short address: https://sciup.org/15017200
IDR: 15017200 | DOI: 10.5815/ijcnis.2020.02.04
Text of the scientific article Implementation of the Naive Bayes Classifier Method for Potential Network Port Selection
Published Online April 2020 in MECS
Signature-based intrusion detection techniques, also called misuse-based, have proven to be effective in detecting attacks without producing many false alarms. Attack detection is done by making a signature pattern of known attacks and storing them in the database as a priori information. However, this kind of approach cannot detect unknown attacks. Various applications of SIDS techniques have conducted in [3-12]. Anomaly-Based IDS (AIDS) is used to detect unknown and known attacks based on their profile or statistical model. These models use historical data on network usage to model and practice anomaly detection as a classification problem. This model tries to find anomalous than normal behavior. This model is more efficient and faster than SIDS, although many produce false-positive rates. Various studies related to various uses of algorithms in the AIDS approach have been carried out in [2, 13-23].
Deep Learning or often known as Deep Structured Learning or Hierarchical Learning, is one of the branches of machine learning that consists of high-level abstraction modeling algorithms in data using a set of functions nonlinear transformations arranged in layers and depth. The techniques and algorithms can be used both for the needs of supervised learning, unsupervised learning, and semisupervised learning in various applications. Deep Learning called "deep" because the structure and number of neural networks in the algorithm can reach up to hundreds of layers. Deep Learning has also widely used for IDS as in [24-32].
When a personal computer (PC) connected to the Internet, a malicious attacker tries to enter and exploit it. One of the most commonly used techniques is to access open ports which are doors for applications and services that use connections in TCP/IP networks. Open ports indicate a particular process where the server provides certain services to clients and vice versa. The term "botnet" is a network consisting of infected end-hosts under the control of a human operator. SYN DDoS (Distributed Denial of Service) and Hypertext Transfer Protocol (HTTP) DDoS are the most common scenarios for botnet-assisted DDoS attacks [33]. DoS/DDoS attacks usually appear in the attached system. As a result, the service server that was attacked may crash or no longer be able to provide services to any client.
Transmission Control Protocol (TCP), as defined in Request For Comments (RFC) 793 [34], is a reliable, connection-oriented, end-to-end protocol. Initially, this was designed to fit in a layered hierarchy that supports multi-network applications. Some specifications of its capabilities are the establishment of connections, error recovery, flow control, and window size negotiations. In a typical TCP connection, each device maintains its status and the appropriate sequence number to trace the order of incoming packets. When the end-host device receives a new packet, it will send back an ACK (acknowledgment) packet, which contains an acknowledgment number. It indicates the device has successfully received data and is waiting for further incoming data under the numbers shown [35].
The status of the port that is the application door can be seen using the port scanning technique. Port scanning is a dangerous intrusion method for finding exploit loopholes. Port scanning works by checking the status of open ports on each host in a network. Port scanning can be called a form of information gathering that leads to services looking for potential targets. The collection of information on a computer network is not only used to find exploited loopholes but is also used to improve network system security. The concept of machine learning is one of the algorithmic approach techniques that can be used to study data patterns from information collected. Learning outcomes can be used as a reference to prevent exploitation from unwanted parties. The Naive Bayes classification method is one of the easiest data classification methods. The performance results are usually very dependent on the amount of training data used. In this study, the Naïve Bayes classifier method was deliberately chosen as the method used because of its simplicity, to predict port numbers that could potentially change the activity status from "close" to "open" and vice versa. Predictable potential port numbers can be a special consideration for localizing future monitoring activities.
-
II. Potential Port Selection Methodology
-
A. General Concept
In general, the methodology used in this study shown in Fig.1. Port scanning is a technique used to collect port status information from computers or devices connected to the network. For example, network administrators use port scans to recognize the open port status of a system so that they can restrict access to that port, or turn it off completely. Port scanning grouped into three categories based on the various types of packets used. This study uses Full TCP that utilizes a three-way handshake, which is a full-duplex connection. When the three-way handshake process reached, a TCP connection will be established, and the port status is declared open.
Port scanning performed on a client that has a scenario of changing port status activities. This scenario in question is a client that has a port with an "open" status in one period, and the next period changes from "open" to "close". This scenario will be repeated until the scanning process is complete.


Fig.1. Research methodology
Some of the port scanning results that are of concern are as follows: (a). Port; (b). Duration; and (c). State. The "port" attribute contains the port number data obtained during the port scanning process for a certain period. The "duration" attribute contains data on the duration of "open/close" conditions of a port number. The "state" attribute contains the data condition class of a port number that is labeled "open" or "close."
The data cleaning stage is the process of ignoring scan data that does not change the port status activity from the initial scanning process until the scanning time is complete. Therefore, the remaining data is only the result of port scanning, which changes the port status activity. Changes in the status of port activity occur in a very varied duration. For simplicity, an evaluation of port status (change or not) done every 15 minutes. The port activity scan performed for one hour. The data labeling stage is the process of grouping the "duration" attribute into four classes, where each class is given a specific label, as follows:
-
1) 00:00:00 - 00:15:00 = Т 1
-
2) 00:16:00 - 00:30:00 = Т 2
-
3) 00:31:00 - 00:45:00 = Т 3
-
4) 00:46:00 - 00:60:00 = Т4
-
B. Naive Bayes Classifier
Naive Bayes Classifier, based on the Bayes theorem, is the theorem used in statistics to calculate the probability of a hypothesis. Bayes calculates the probability of a class based on its attributes and determines which class has the highest probability. In machine learning, Naive Bayes classifies classes based on simple probabilities by assuming that each attribute in the data is mutually exclusive. The Naive Bayes method is one of the most widely used methods based on several simple properties. The Naive Bayes method classifies data based on data attributes expressed as: x = (x1, x2, ^, xn) on the probabilities model of each class к which can be written as follows:
P ( ykx 1, x 2, , xn ) (1)
wheren is the number of attributes in the data and к is the number of classes in the class у data set.Classification is a scheme of determining a particular data into a class that seen from the perspective of probability into Bayes rules written as follows:
P ( y t l x n )=
P ( y k ). P ( x n y k ) P ( x n )
where P ( yk\x„ ) is the probability of the event yk occurring when xn occurs, P ( yk\xn ) is the probability of the event x occurring when y occurs, P ( y ) is the probability of the event yk , and P ( xn ) is the probability of the event x .
The highest probability value of each possible class is chosen as the optimal class using the following formula:
arg max . € y
P ( yk ). P ( xn yk ) P ( x n )
Because the value of P (xn) is always the same for each class, the equation can be written as:
arg max yt e y p ( yk ). p ( x , | yk ) (4)
If Л is the "duration" attribute that represents the duration class, В is the "port" attribute that represents the class of port number, C is the "state" attribute that represents the condition class of a port, the probability of events Л, В, and C expressed by:
nnn
P ( A ) = — p ( B^ = -A p ( C i ) = Л (5)
nnn where n ,n ,n are the number of events A, B, and
C , respectively, i is the number of class for each attribute, and n is the number of total data.
The number of classes of "duration" attributes is four ( T , , T ) . The number of port numbers ranges from 0 -65535. Port numbers divided into 3, namely well-known ports ranging from 0 - 1023, registered ports ranging from 1024 - 49151 and private/dynamic ports ranging from 49152 - 65535. In this study uses the well-known ports. Because observations only made on ports that have changed activity status during the scanning process, in this study, there were only ten ports with that condition. Therefore, the number of classes of "port" attributes is10 ports. The number of classes of "state" attributes is 2
("open / close").
The probability of an occurrence of a specific port with a specific activity status is expressed by:
n
P ( B i C,) = — (6)
n
Ci
The probability of an occurrence of a specific port occurring in a specified duration is expressed by:
P ( B t\A ) = " BA (7)
n Ai
The probability of a specific duration occurrence having a specific activity status is expressed by:
P ( A|C ) = — (8)
C i
The probability of a specific duration occurring when a specific port occurs is expressed by:
. . . p ( A ) . p ( ba )
p ( A B ,.)= v , vy *'
v i1 'v p ( B )
The probability of a port activity occurring with a specific status when a particular port occursis expressed by:
P ( CB - ) = P BO BC ' (1°)
Several training data are used to obtain P ( A |B ) and P ( C |B ) . Suppose two events Xand Y, with P ( Y ) > 0. The conditional probability of X given Y expressed by [36] :
, . x P(X n Y)
P ( X Y )= ( ’
\ I / p ( Y )
This study attempts to select potential ports by predicting the occurring of specific ports with certain status activities within a specific duration P ( В. |A. and C ) . By using Eq. (9), (10), and (11) can be obtained:
P ( B i l AandC , ) = P ( B i\ A , ) n P ( B i. C , )
= ' P ( A i B i ) . P ( B , ) '
" I p(A) J n f P (C,Bi) • P (B,)' n I p (Ci) J
Finally, several test data are used to obtain P ( B^andC^ .
-
III. Implementation
-
A. Implementat on of the three-way handshake full TCP connect on
Port scanning using a three-way handshake full TCP connection done in real-time as illustrated in Figure 2. The port status will be declared open when the three-way handshake process occurs. The three-way handshake process begins with the first host sending synchronize flags (SYN) to the second host, followed by the second host responding by sending synchronize (SYN) and acknowledgments (ACK) . Finally, the first host will respond with the acknowledgment flag (ACI). As for the port, status declared closed, the second host will respond by sending a reset flag (RST) and Acknowledgment (ACI) when receiving a synchronize flag (SYN) from the first host.

-
(1) SYN ----------►
-
(2) SYN + ACK ◄--------
-
(3) ACK


(2) RST + ACK
(1) SYN

port status is declared “open”
port status is declared “close”
Fig.2. The three-way handshake full TCP connection
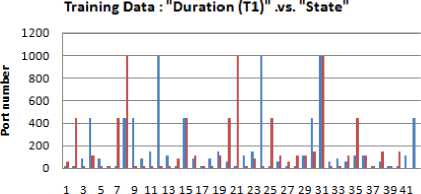
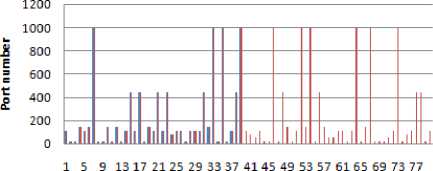
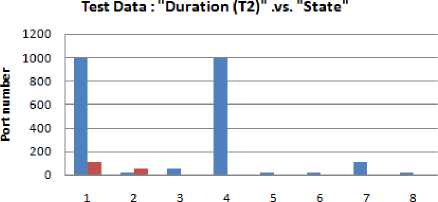
This study uses a research scenario as shown in Fig. 3. All work stations (client 1 ... client n) are randomly active. Observation of port status activities carried out for one hour. The results of port scanning have produced raw data for this research stored in data storage. From several raw data obtained, only 400 data were used and have been through the process of cleaning and labeling the data. Three hundred fifty data (350) used as training data, and 50 data used as test data. Training data have shown in Table 1, while test data have shown in Table 2, and graphically shown in Fig. 4 - 11.
Table 1. Training data
|
No. |
Port (B) |
Duration (A) |
State (C) |
|
1 |
20 |
T2 |
open |
|
2 |
21 |
T 1 |
close |
|
3 |
22 |
T 3 |
close |
|
4 |
53 |
T2 |
close |
|
5 |
80 |
T2 |
open |
|
6 |
110 |
T 4 |
open |
|
7 |
111 |
T 3 |
close |
|
8 |
143 |
T 3 |
open |
|
9 |
443 |
T 2 |
close |
|
10 |
995 |
T 3 |
open |
|
11 |
20 |
T 1 |
close |
|
12 |
21 |
T 2 |
open |
|
13 |
22 |
T 3 |
open |
|
14 |
53 |
T 1 |
open |
|
15 |
80 |
T 1 |
close |
|
... |
... |
... |
... |
|
... |
... |
... |
... |
|
101 |
20 |
T 2 |
open |
|
102 |
21 |
T 1 |
close |
|
103 |
22 |
T 4 |
close |
|
104 |
53 |
T 2 |
close |
|
105 |
80 |
T 2 |
open |
|
... |
... |
... |
... |
|
... |
... |
... |
... |
|
346 |
110 |
T 4 |
open |
|
347 |
111 |
T 3 |
close |
|
348 |
143 |
T 1 |
open |
|
349 |
443 |
T 1 |
close |
|
350 |
995 |
T 3 |
open |
No. data
■ T1 (close) ИТ1(ореп)


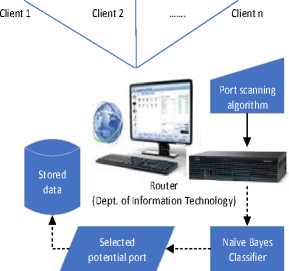
Fig.3. Research scenario

Main Server
(Politeknik Negeri Samarinda)
Fig.4. Training data: "Duration (T 1 ) .vs. State
No. data
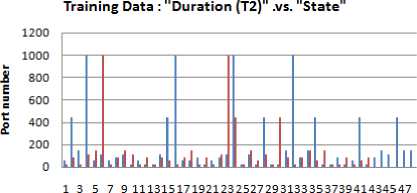
■ T2 (close) eT2(open)
Fig.5. Training data: "Duration (T 2 ) .vs. State
No. data
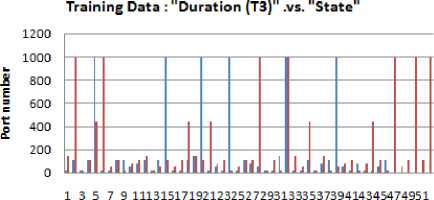
■ T3 (close) ■ T3(open)
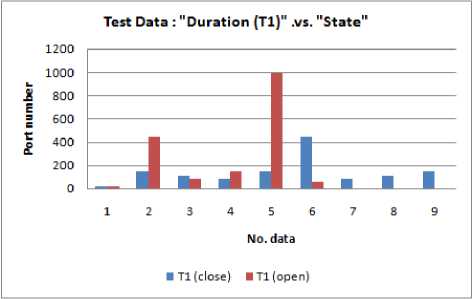
Fig.8. Test data: "Duration (T 1 ) .vs. State
Fig.6. Training data: "Duration (T 3 ) .vs. State
Training Data : "Duration (Т4)" .vs. "State"
No. data
■ T4 (close) ■T4(open)
Fig.7. Training data: "Duration (T4) .vs. State
Table 2. Test data
|
No. |
Port (B) |
Duration (A) |
State (C) |
|
1 |
20 |
T i |
close |
|
2 |
21 |
T3 |
open |
|
3 |
22 |
T 1 |
open |
|
4 |
53 |
T 3 |
open |
|
5 |
80 |
T 4 |
close |
|
6 |
110 |
T 3 |
close |
|
7 |
111 |
T 3 |
open |
|
8 |
143 |
T 1 |
close |
|
9 |
443 |
T 4 |
open |
|
... |
... |
... |
... |
|
... |
... |
... |
... |
|
46 |
110 |
T 1 |
close |
|
47 |
111 |
T 4 |
open |
|
48 |
143 |
T 1 |
close |
|
49 |
443 |
T 4 |
open |
|
50 |
995 |
T 4 |
close |
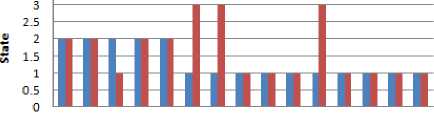
Fig.9. Test data: "Duration (T 2 ) .vs. State
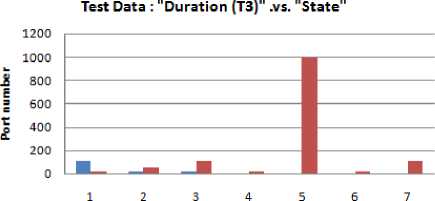
Fig.10. Test data: "Duration (T 3 ) .vs. State
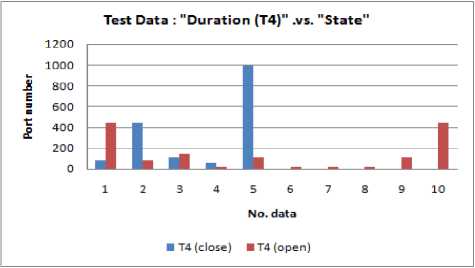
Fig.11. Test data: "Duration (T 4 ) .vs. State
-
B. Implementation of Naive Bayes Classifier
The event probability of all classes in each attribute calculated by using Eq. (5) with results as shown in Tables 3, 4, and 5. While the probabilities were calculated using Eq. (6), (7), and (8) produce as shown in Tables 6, 7, and 8.
Table 3. The event probability of the "duration" attribute
|
P ( A = T ) |
P ( A = T 2 ) |
P ( A = T 3 ) |
P ( A = T 4 ) |
|
0.234286 |
0.257143 |
0.28 |
0.22857 |
Table 4. The event probability of the "state" attribute
|
No. Port |
P(B) |
|
20 |
0.1 |
|
21 |
0.1 |
|
22 |
0.1 |
|
53 |
0.1 |
|
80 |
0.1 |
|
110 |
0.1 |
|
111 |
0.1 |
|
143 |
0.1 |
|
443 |
0.1 |
|
995 |
0.1 |
Table 5. The event probability of the "port" attribute
|
P ( C = " open " ) |
P ( C = " close " ) |
|
0.5 |
0.5 |
Table 6. Tthe probability of the event "port" (B) occurring when "state" (C) occurs
|
No. Port (B) |
P ( B|C = " open " ) |
P ( SC = " close " ) |
|
20 |
0.1029 |
0.0971 |
|
21 |
0.0971 |
0.1029 |
|
22 |
0.0971 |
0.1029 |
|
53 |
0.0971 |
0.1029 |
|
80 |
0.1029 |
0.0971 |
|
110 |
0.1029 |
0.0971 |
|
111 |
0.0971 |
0.1029 |
|
143 |
0.1029 |
0.0971 |
|
443 |
0.0971 |
0.1029 |
|
995 |
0.1029 |
0.0971 |
Table 7. the probability of the event "port" (B) occurring when "duration" (Л) occurs
|
No. Port (B) |
P ( BA = T 1 ) |
P ( BA = T 2 ) |
P ( BA = T 3 ) |
P ( BA = T 4 ) |
|
20 |
0.0976 |
0.1000 |
0.1225 |
0.0750 |
|
21 |
0.1342 |
0.1000 |
0.0918 |
0.0750 |
|
22 |
0.1220 |
0.0889 |
0.0714 |
0.1250 |
|
53 |
0.0854 |
0.1333 |
0.1225 |
0.0500 |
|
80 |
0.0976 |
0.1778 |
0.0816 |
0.0375 |
|
110 |
0.0976 |
0.0444 |
0.1327 |
0.1250 |
|
111 |
0.0732 |
0.0667 |
0.1225 |
0.1375 |
|
143 |
0.0732 |
0.1333 |
0.0714 |
0.1250 |
|
443 |
0.1463 |
0.0889 |
0.0510 |
0.1250 |
|
995 |
0.0732 |
0.0667 |
0.1327 |
0.1250 |
Table 8. the probability of the event "duration" (Л) occurring when "state" (C) occurs
|
Duration (Л) |
P ( AC = " open " ) |
P ( AC = " close " ) |
|
T |
0.2286 |
0.2400 |
|
T |
0.2400 |
0.2743 |
|
T 3 |
0.2971 |
0.2629 |
|
T 4 |
0.2343 |
0.2229 |
Table 9. The probability of a specific duration^ , ) occurring when a specific port (B , )occurs
|
No. Port (B) |
P ( A = T B ) |
P ( A = T 2 B ) |
P ( A = T 3 B ) |
P ( A = T 4 B ) |
|
20 |
0.2286 |
0.2571 |
0.3429 |
0.1714 |
|
21 |
0.3143 |
0.2571 |
0.2571 |
0.1714 |
|
22 |
0.2857 |
0.2286 |
0.2000 |
0.2857 |
|
53 |
0.2000 |
0.3429 |
0.3429 |
0.1143 |
|
80 |
0.2286 |
0.4571 |
0.2286 |
0.0857 |
|
110 |
0.2286 |
0.1143 |
0.3714 |
0.2857 |
|
111 |
0.1714 |
0.1714 |
0.3429 |
0.3143 |
|
143 |
0.1714 |
0.3429 |
0.2000 |
0.2857 |
|
443 |
0.3429 |
0.2286 |
0.1429 |
0.2857 |
|
995 |
0.1714 |
0.1714 |
0.3714 |
0.2857 |
Table 10. The probability of a port activity occurring with a specific status (C i )when a specific port (B , )occurs
|
No. Port (B) |
P ( C = " open "| B ;) |
P ( C = " close " B ;) |
|
20 |
0.5143 |
0.4857 |
|
21 |
0.4857 |
0.5143 |
|
22 |
0.4857 |
0.5143 |
|
53 |
0.4857 |
0.5143 |
|
80 |
0.5143 |
0.4857 |
|
110 |
0.5143 |
0.4857 |
|
111 |
0.4857 |
0.5143 |
|
143 |
0.5143 |
0.4857 |
|
443 |
0.4857 |
0.5143 |
|
995 |
0.5143 |
0.4857 |
Table 11. Comparison between the predicted results and the actual data
|
No. |
No. Port |
Predicted |
Actual |
True/ False |
||
|
duration |
state |
duration |
State |
|||
|
1 |
20 |
T 1 |
close |
T 1 |
close |
True |
|
2 |
21 |
T 3 |
open |
T 3 |
open |
True |
|
3 |
22 |
T 1 |
open |
T 1 |
open |
True |
|
4 |
53 |
T 3 |
open |
T 3 |
open |
True |
|
5 |
80 |
T 4 |
close |
T 4 |
close |
True |
|
6 |
110 |
T 4 |
open |
T 3 |
close |
False |
|
7 |
111 |
T 3 |
open |
T 3 |
open |
True |
|
8 |
143 |
T 1 |
close |
T 1 |
close |
True |
|
9 |
443 |
T 4 |
open |
T 4 |
open |
True |
|
... |
... |
... |
... |
... |
... |
|
|
... |
... |
... |
... |
... |
... |
|
|
46 |
110 |
T 1 |
close |
T 1 |
close |
True |
|
47 |
111 |
T 4 |
open |
T 4 |
open |
True |
|
48 |
143 |
T 1 |
close |
T 1 |
close |
True |
|
49 |
443 |
T 4 |
open |
T 4 |
open |
True |
|
50 |
995 |
T 4 |
close |
T 4 |
close |
True |
The probabilities were calculated using Eq. (9) and (10) produce as shown in Tables 9 and 10.
Probabilities P ( A,B( ) and P ( C |B ,) that have obtained from the training stage, are then used to predict potential ports by using test data through the application of Eq. (12). The results were presented in the form of a comparison between the predicted results and the actual data as shown in Table 11, and graphically shown in Fig. 12 - 15.
Comparison of predicted port status results in duration T4(l=open, 2=close, 3=different duration)
3.5
53 80 110 443 995 20 21 22 22 80 111 111143 443 443
Port number
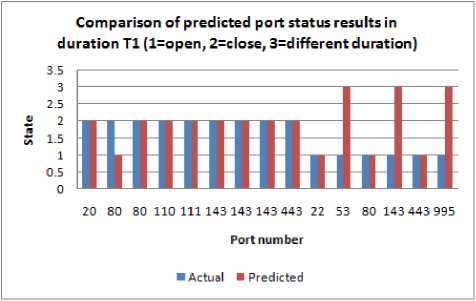
Fig.12. Comparison of predicted port status results in duration T 1
Comparison of predicted port status results in duration T2 (l=open, 2=close, 3=different duration)
Port number
-
■ Actual ■Predicted
Fig.13. Comparison of predicted port status results in duration T 2
Prediction performance measured by the number of "true" to the total test data, obtained:
— x 100% = 70% 50
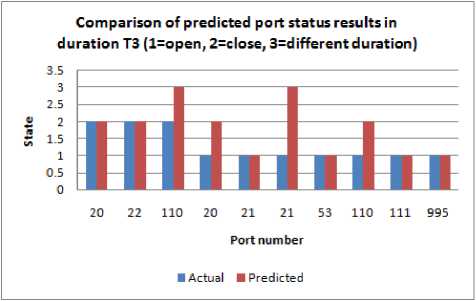
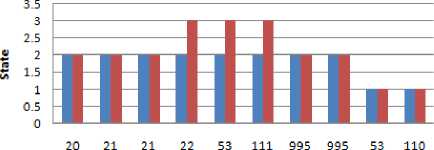
Fig.14. Comparison of predicted port status results in duration T3
-
■ Actual ■ Predicted
Fig.15. Comparison of predicted port status results in duration T 4
-
iv. Conclusion
This study has applied the Naive Bayes Classifier with two conditions for selecting potential ports. The method applied is classified as AIDS because it based on historical data of port activity obtained through the port scan process, regardless of the type of attack.The three attributes that have used are "port" which contains the number of ports scanned for a certain period, "duration" which contains the duration of the "open/close" condition of a port, and "state" which contains the condition of a port with the status "open" or " close ". This study has chosen a potential port by predicting the occurrence of specific ports with certain status activities within a specified duration through the use of training data. The results have used to predict potential ports through the use of test data. The results of this study have shown a predictive performance of 70%. This result can be considered good enough to predict potential port numbers in the following occurrence. Prediction results for the occurrence of the next potential port number within a specific period will be compared with the results of the port status scan stage. Furthermore, the classification stage using the Naive Bayes method will be carried out to predict the potential port number at the next occurrence, where the scan results of the newly obtained port status will be involved as raw data. In this way, the amount of raw data will increase. The increasing number of raw data will further improve the performance of prediction results using the Naive Bayes method.
For further studies, the improvement of prediction performance using the Naive Bayes Classifier method will be carried out by making use of the renewal of the raw data that results from scanning port activity within a specified period. It will be done by modifying the research scenario, as shown in Fig.3.
References Implementation of the Naive Bayes Classifier Method for Potential Network Port Selection
- A. Khraisat, I. Gondal, P. Vamplew et al., “Survey of intrusion detection systems: techniques, datasets and challenges,” Cybersecurity, vol. 2, no. 1, 2019.
- W. Alhakami, “Alerts Clustering for Intrusion Detection Systems: Overview and Machine Learning Perspectives,” International Journal of Advanced Computer Science and Applications (IJACSA), vol. 10, no. 5, 2019.
- R. Bogdan, “ Detecting Malicious Codes: A Signature-Based Solution,” International Conference on Computer and Software Modeling, IACSIT Press, Singapore, 2011.
- P. H, A. A, J. M et al., “Signature-Based IDS for Software-Defined Networking,” International Journal of Science, Engineering and Technology Research (IJSETR), vol. 7, no. 9, 2018.
- P. P. Ioulianou, V. G. Vassilakis, I. D. Moscholios et al., “A Signature-based Intrusion Detection System for the Internet of Things,” White Rose Research Online, University of York, 2018.
- V. Kumar, and D. O. P. Sangwan, “Signature Based Intrusion Detection System Using SNORT,” International Journal of Computer Applications & Information Technology, vol. I, no. III, 2012.
- N. Mastorakis, A. Andreatos, V. Moussas et al., “A Novel Intrusion Detection System Based on Neural Networks,” MATEC Web of Conferences, vol. 292, pp. 03017, 2019.
- W. Meng, W. Li, C. Su et al., “Enhancing Trust Management for Wireless Intrusion Detection via Traffic Sampling in the Era of Big Data,” IEEE Access, vol. 6, pp. 7234-7243, 2018.
- Prof.D.P.Gaikwad, P. Pabshettiwar, P. Musale et al., “A Proposal for Implementation of Signature Based Intrusion Detection System Using Multithreading Technique,” International Journal Of Computational Engineering Research, vol. 2, no. 7, 2012.
- N. Sameera, and M. Shashi, “Transfer Learning Based Prototype for Zero-Day Attack Detection,” International Journal of Engineering and Advanced Technology (IJEAT), vol. 8, no. 4, 2019.
- S. N. Shah, and M. P. Singh, “Signature-Based Network Intrusion Detection System Using SNORT And WINPCAP ” International Journal of Engineering Research & Technology (IJERT), vol. 1, no. 10, 2012.
- Thamizharasi.E, and P.Salini, “Survey on Fuzzy Based Extreme Learning Machine for Intrusion Detection ” IOSR Journal of Engineering (IOSR JEN), pp. 69-76, 2019.
- S. Aljawarneh, M. Aldwairi, and M. B. Yassein, “Anomaly-based intrusion detection system through feature selection analysis and building hybrid efficient model,” Journal of Computational Science, vol. 25, pp. 152-160, 2018.
- S. K. Amrita, “Machine Learning and Feature Selection Approach for Anomaly based Intrusion Detection: A Systematic Novice Approach ” International Journal of Innovative Technology and Exploring Engineering (IJITEE), vol. 8, no. 6S, 2019.
- S. Jose, D. Malathi, B. Reddy et al., “A Survey on Anomaly Based Host Intrusion Detection System,” Journal of Physics: Conference Series, vol. 1000, pp. 012049, 2018.
- S. Khonde, and U. Venugopal, “Hybrid Architecture for Distributed Intrusion Detection System,” Ingénierie des systèmes d information, vol. 24, no. 1, pp. 19-28, 2019.
- H. Li, F. Wei, and H. Hu, “Enabling Dynamic Network Access Control with Anomaly-based IDS and SDN,” SDN/NFV Security Architecture, Association for Computing Machinery (ACM), https://doi.org/10.1145/3309194.3309199, pp. 13-16, 2019.
- E. Nikolova, and V. Jecheva, “Applications of Clustering Methods to Anomaly-Based Intrusion Detection Systems,” 8th International Conference on Database Theory and Application, Jeju, South Korea, pp. 37-41, 2015.
- Z. Rustam, and A. S. Talita, “Fuzzy Kernel Robust Clustering for Anomaly based Intrusion Detection ” Third International Conference on Informatics and Computing (ICIC), Palembang, Indonesia, Indonesia, IEEE, 2018.
- B. A. Tama, M. Comuzzi, and K.-H. Rhee, “TSE-IDS: A Two-Stage Classifier Ensemble for Intelligent Anomaly-based Intrusion Detection System,” IEEE Access, vol. 7, 2019.
- N. T. T. Van, and T. N. Thinh, “Accelerating Anomaly-Based IDS Using Neural Network on GPU,” 2015 International Conference on Advanced Computing and Applications, Ho Chi Minh City, Vietnam, pp. 67-74, 2015.
- F. Wang, H. Zhu, B. Tian et al., “A HMM-based method for Anomaly Detection,” 2011 4th IEEE International Conference on Broadband Network and Multimedia Technology, Shenzhen, China, 2011.
- C. Young, H. Olufowobi, G. Bloom et al., “Automotive Intrusion Detection Based on Constant CAN Message Frequencies Across Vehicle Driving Modes,” Association for Computing Machinery (ACM ), https://doi.org/10.1145/3309171.3309179, pp. 9-14, 2019.
- D. AKSU, and M. A. AYDIN, “Detecting Port Scan Attempts with ComparativeAnalysis of Deep Learning and Support VectorMachine Algorithms,” 2018 International Congress on Big Data, Deep Learning and Fighting Cyber Terrorism (IBIGDELFT), ANKARA, Turkey, Turkey, IEEE, 2018.
- M. Al-Qatf, Y. Lasheng, M. Al-Habib et al., “Deep Learning Approach Combining Sparse Autoencoder With SVM for Network Intrusion Detection,” IEEE Access, vol. 6, pp. 52843-52856, 2018.
- G. Karatas, O. Demir, and O. K. Sahingoz, “Deep Learning in Intrusion Detection Systems,” 2018 International Congress on Big Data, Deep Learning and Fighting Cyber Terrorism (IBIGDELFT), ANKARA, Turkey, Turkey, IEEE, 2018.
- S. M. Kasongo, and Y. Sun, “A Deep Learning Method With Filter Based Feature Engineering for Wireless Intrusion Detection System,” IEEE Access, vol. 7, pp. 38597-38607, 2019.
- Navaporn, Chockwanich, Vasaka et al., “Intrusion Detection by Deep Learning with TensorFlow,” 2019 21st International Conference on Advanced Communication Technology (ICACT), PyeongChang Kwangwoon_Do, Korea (South), IEEE, 2019.
- S. Otoum, B. Kantarci, and H. T. Mouftah, “On the Feasibility of Deep Learning in Sensor Network Intrusion Detection,” IEEE Networking Letters, vol. 1, no. 2, pp. 68-71, 2019.
- S. ustebay, Z. Turgut, and M. A. Aydin, “Intrusion Detection System with Recursive Feature Elimination by using Random Forest and Deep Learning Classifier,” 2018 International Congress on Big Data, Deep Learning and Fighting Cyber Terrorism (IBIGDELFT), ANKARA, Turkey, Turkey, IEEE, 2018.
- R. Vinayakumar, M. Alazab, K. P. Soman et al., “Deep Learning Approach for Intelligent Intrusion Detection System,” IEEE Access, vol. 7, pp. 41525-41550, 2019.
- W. Wang, Y. Sheng, J. Wang et al., “HAST-IDS: Learning Hierarchical Spatial-Temporal Features Using Deep Neural Networks to Improve Intrusion Detection,” IEEE Access, vol. 6, pp. 1792-1806, 2018.
- G. Spathoulas, N. Giachoudis, G.-P. Damiris et al., “Collaborative Blockchain-Based Detection of Distributed Denial of Service Attacks Based on Internet of Things Botnets,” Future Internet, vol. 11, no. 11, pp. 226, 2019.
- F. Gont, Security Assessment of the Transmission Control Protocol (TCP), United Kingdom: Centre for the Protection of National Infrastructure (CPNI), 2009.
- F.-H. Hsu, Y.-L. Hwang, C.-Y. Tsai et al., “TRAP: A Three-Way Handshake Server for TCP Connection Establishment,” Applied Sciences, vol. 6, no. 11, pp. 358, 2016.
- M. J. Evans, and J. r. S. Rosenthal, Probability and Statistics, The Science of Uncertainty - Second Edition, Toronto, 2009.
