Improved USCT of paired bones using wavelet-based image processing

Author: Marwa Fradi, Wajih Elhadj Youssef, Philippe Lasaygues, Mohsen Machhout
Journal: International Journal of Image, Graphics and Signal Processing @ijigsp
Article in issue: 9 vol.10, 2018.
Free access
Computed ultrasonic bone tomography (USCT) is a non-invasive and non-ionizing technique, which ensures the protection of child being against x-rays. The main objective of this article is to use an image processing algorithm to improve the signal-to-noise ratio of ultrasonic computed tomography (USCT) of children bones for automatic detection of osteopathologies. For this fact, we construct an application of image processing with Microsoft Foundation Class Library (FMC) integrated in visual Studio using Haar wavelet algorithm to detect edges. Different methods of image processing for automatic detection are used. Hence, we make accessible the detection of distance between bones due to the application of wavelet transform. As a result, the quality of USCT image was improved and the detection of child osteopathologies became accessible.
Ultrasonic computed tomography (USCT), children bones, wavelet transformation, edge extraction, diagnostic
Short address: https://sciup.org/15015990
IDR: 15015990 | DOI: 10.5815/ijigsp.2018.09.01
Text of the scientific article Improved USCT of paired bones using wavelet-based image processing
Published Online September 2018 in MECS
Children suffer from various traumatic and injuries bones caused by anatomical, biomechanical and physiological activities. Their skeleton increases and this growth can be influenced by several factors, such as hormone concentration or lifestyle. In order to protect children from X-rays, the use of non-irradiating ultrasonic waves appears today as the best clinical means. However, today's ultrasound scans do not allow the examination of coupled and paired bones (tibia-fibula for example). Ultrasonic Computed Tomography is a proposed solution and a demonstrator that has been developed [1, 2].
Ultrasound propagation in bone structures suffers from the strong echogenicity of tissues. Even if problems are still existing [3], first results are very encouraging.
However, without signal and image processing, results are difficult to interpret [4].
In our work, we propose a method of automatic optimization by segmentation, applied to the USCT (Ultrasonic Computed Tomography) bone’s image to detect different structures and improve the diagnosis of pathologies. Algorithms are based on different libraries such as OpenCv and different algorithms such as wavelet transformation.
-
II. Related Work
Several modalities of medical imaging allow making the bone disease exploration. X-ray and standard scanners determine bone mineral density and delineate the bone structure but it remains an ionizing method and does not give qualitative information on the bone structure. Therefore we use the ultrasonic scanner USCT which is non-ionizing and can give us some details.
For the detection of some child bone pathologies, clinicians are using the B-mode ultrasound imaging as the first intention modality, but results are not successful because of the limit propagation of the ultrasonic wave and the wave attenuation into the bone. Therefore, the use of ultrasonic computed tomography (USCT) for bone imaging associated with signal and image processing methods [1, 2] is a very crucial method..
Many methods are used in ultrasonic images such as Active contours method and wavelet signal processing method.
Active contours Method: was massively used in segmentation of ultrasonic images processing, its use always runs up against the problem of the noise in the ultrasonic images [15]. This method was applied by Lasaygues on a tomographic image made with USCT of a paired bone, but results are not satisfactory, and the detection of the distances between the two bone forms (tibia and fibula) were not possible considering the noise present into the image in 2001.
Pre-processing algorithms: Pre-processing algorithms of denoising image such as median, gaussian, sobel, canny do not give satisfactory results. Thus, edge and region detection are difficult in noisy images since both the noise and the edges contain high frequency content [6, 7]. In last two decades, a flurry of research has involved the use of wavelet transform for denoising because of its energy compaction and multiresolution proprieties [8, 9].
Wavelet signal processing Method : In 2018, wavelet based coded excitation was used in USCT. It is based on signal wavelet decomposition [4].
Thus, we will apply a flow of image processing to optimize the quality obtained by ultrasound tomography and to realize an automatic segmentation. In fact, the automatic segmentation of images was a widespread problem especially in the field of medical imaging and more specifically in ultrasound tomography given the inhomogenity of pixels and the complexity of the anatomical topology [5]
-
III. Materials and Methods
In this section, the new used protype will be presented and also the image processing method will be shown in details.
-
A. Materials
The prototype used is an ultrasound scanner. It consists of a circular 2D ring antenna of 150 mm radius equipped by 8 transducers distributed over 360 ° every 45 ° and a bar of 128 elements. The 8 transducers are piezocomposite elements whose frequencies are respectively 1Mhz -3Mhz, having a cylindrical focus in the plane of section. The object to be imaged is placed at the geometric center of the crown. The figure below shows us the USCT prototype.
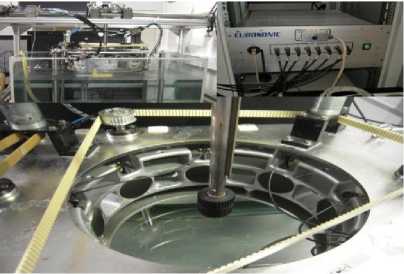
Fig.1. Ultrasonic Computed Tomography device (Copyright / Rights reserved, CNRS-LMA Marseille)[1]
-
B. Methods
The measurements were performed at ultrasonic frequencies in the order of 1MHz. Each transducer is successively transmitter and receiver. One of the transmitters sends a wave that diffracts on the object and reaches the other 7 receivers. There are 3 configurations per zone. The wave is transmitted, or back-propagated or diffracted
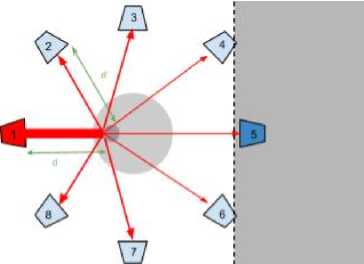
Fig.2.Ttransmitter-receiver transducters
After using the USCT prototype, we have the ultrasonic tomographic images .These images are divided in two steps:
-
> First the algorithm of the summation of the filtered back-projection are applied to the radio-frequency signals.
-
> Second, the image processing is applied on the images using differents algorithms and libraries. It’s illustred by the synoptic flow in the flow in Fig.3.
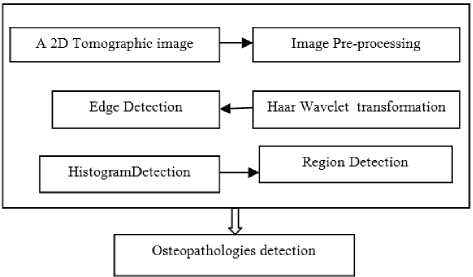
Fig.3. The Synoptic diagram of my proposed image processing
-
1) Image Pre-processing
This step is very crucial for image denoising. Hence, It has long been a focus of research and it will be successful after removal of high frequency from the corrupted image [5]
-
a) Median Filter:
The median filter was applied when the image was noised by fine lines or isolated points. However, it is applicable only for grayscaled images. The principle consists on replacing a pixel with the median of its neighbors. Thus, even if several neighboring pixels are noisy, you can correct the current pixel. This induces a smoothing filter, however, since even the correct pixels can be changed. The sharpness is preserved but the median filter removes fine details irreversibly. Its methodology of application is described by storing a list of values created in a table then we have to set values constitutes a mask which can vary size is 3 * 3 * 5 or5.
Finally, we move the mask on the image and sort the table.
-
b) Gaussian Filter:
The Gaussian filter is a local and linear filter that smoothes the whole image irrespective of its edges or details [10]. In Gaussian filters, weight of the pixels decays by distance from the center of the filter as given by (1).
х^+у/ а^-) =—е. 2 8 2 (1)
Where x is defined as the distance on the absciss, y is the distance from the origin on the axis of the ordinates and 5 the standard deviation of the gaussian distribution.
-
c) Canny Filter
The principle is based on the fixation of two thresholds, a high threshold Sh and a low threshold Sb. We begin by selecting the points that exceed the upper threshold and then we apply the lower threshold, keeping only the annexes components that contain a point above Sh. In other words from each point above Sh it follows a path consisting of points above Sb, this path has the desired outline .
-
d) Sobel Filter
The Sobel operator performs a 2-D spatial gradient measurement on an image. Typically it is used to find the approximate absolute gradient magnitude at each point I of an input grayscale image [11]. The purpose of Sobel's filter is to find the edges in an image (so not only in a particular direction, but in any direction) and on the other hand the sign of the gradient does not interest us (we are only interested to intensity variations, but not specifically to increase or decrease), we take the gradient standard at each point of the image.
-
2) Image processing
-
a) Wavelet transforamtion-Haar wavelet:
The wavelet transform is a function allowing the dilatation or the translation of a wave called mother wave. It is characterized by the following function
T (a, b) = ^ т (t- ^ (2)
With Ψ (a, b) is the wavelet function; a: is the scale parameter; b: is the translation parameter
-
b) Principle of wavelet transformation:
From an original image, a low-pass filter is applied for the analysis of low frequencies. In a second step, a high-pass filter is applied for the analysis of the high frequencies. It allows dividing the image’s informations into approximation and details. We will use The Haar Wavelet to stare image edge detection. It makes the accuracy of image . Its principle is ilustered by steps below :
-
• Calculate the average of each pair of data (pixels) on the lines, we get averages.
-
• Calculate the difference between each data and its respective average on the lines, we get differences.
-
• Place the averages in the first half of the data matrix that corresponds to the L approximation image.
-
• Place the differences in one half of the data matrix that corresponds to detail image H.
-
• Repeat the process on the first half of the data L, but this on the columns, we obtain two images corresponding respectively to the approximation LL (matrix of means of dimension) and the detail image LH (matrix of differences of dimension).
-
• To have a decomposition level greater than 1, repeat the process on the LL approximation image.
The application of low –pass filter leads to obtain an image L which is compressed. The application of a high-pass filter, leads to obtain an image H which presents the details of the image. This process is illustrated by (3) and (4).
Y h [ k ] = E x [ n ] g [ 2k - n ] (3)
n
Y L [ k ] = Z x [ n ] h [ 2 k — n ] (4)
n where X[n] is the original signal, g and h are two filters, high-pass and low-pass, respectively Yh[k]et Yl[k]are the outputs respectively of the high pass and low pass filter.
A convolution is then applied to the obtained images Let H according to the columns in order to obtain an approximation image LL. The three images are presented the details (LH, HL, and HH).
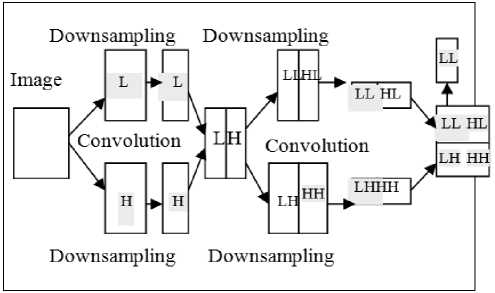
Fig.4. Principle of wavelet application
-
c) Histogram:
The histogram gives us the density of pixels presented into an image
-
d) Region Detection:
The region detection gives us informations about the different structures and details of an image.
-
IV. Experiences And Results
In this section, we will describe the hardware experience method. Hence a series of bone images have obtained but they are noisy. Therefore, we will show the obtained results after a Haar wavelet transformation.
-
A. Experiences
Using the USCT device, the mechanical offset is evaluated using a 70m-diameter copper thread placed in the center of the crown. For each signal, the correction process is a temporal offset between the signal and the reference signal obtained at the same angle on the thread file. Experiments were conducted to confirm the performance of the developed methods. One human bone mimicking phantom (Sawbones™, tibia-fibula was studied. The cavity diameter of the tibia mimicking phantom was 12.5 mm, and its overall length 42 cm, and the fibula mimicking phantom had no inner cavity. The distance between bones (~ 8 mm) was measured using a calliper. The water tank temperature was 21°7 and the ultrasonic wave velocity in water was 1486 m/s. Crosssections were chosen in the cortical areas of the bones; 100 mm from the proximal epiphysis for the bone phantom. The 2D-ultrasonic tomograms were obtained using a pulse excitation mode without any signal processing.
Fibula
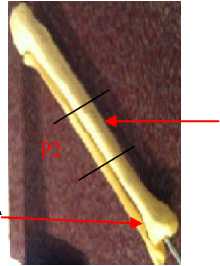
Fig.5. Sawbones™ composite bone mimicking phantom
Tibia
Cortical bone
Cancellous bone
Medullary Cavity
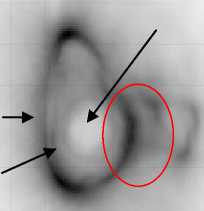
Fig.6. Child Bone Ultrasound Tomographic image
-
1) Work environment
-
a) Visual C++:
The programming language used is C ++. This is one of the most used programming languages. It is both easy to use and very effective. It is essential in the realization of major programs. Current compiler optimizations also make it a favourite language for those looking for performance. Finally, this C++ language is ideal for those who must ensure the portability of programs at the level of source files.
-
b) MFC interface:
The MFC interface is a graphical interface that is introduced in visual C ++ and allows the creation of different dialog boxes containing the different buttons which we have created for displaying images .
-
B. Results
The pre-treatment stage of a medical image is very crucial for studying the image and its various structures. Specifically, the pre-treatment makes it possible to eliminate the noise diffraction of the object existing in an ultrasonic tomographic image. For this fact, we have to apply different filters using the Eclipse with Opencv library and C ++ with FMC interface. Thus, edges and regions detection are difficult in noisy images since both noise and edges contain high frequency content [10]. Now, we try to reduce noise by using median filter and detect edge using sobel and canny filters with OpenCv library.
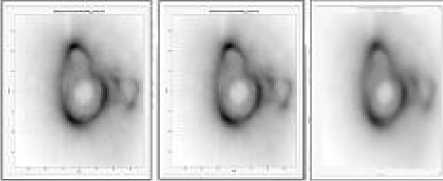
Original Gaussian Blur Median
Fig.7. Filter noise reduction on bone tomographic ultrasonic image
External Edge of cortical bone
Canny filter
Sobel filter
As we can see in Fig.7 gaussian filter reduce the noise caused by in the image. It gives an image more fluent compared to that given by median filter. In Fig.8 , sobel filter is applied , giving us two density of contrast and showing us the external edge clearly which represent the cortical bone.
It should be noted that canny 's filter don’t allow us to detect the contours of anatomical regions of interest of our ultrasonic tomographic image, as well as sobel, he only detected external contours.
-
1) Edge Detection
-
a) Graphic Interface Construction
Graphic interface done with FMC library included in Visual C++ was constructed by implementing some buttons. They are specialized in choosing the image for process and the type of wavelet transform such as direct transform . It’s shown by the figure8.
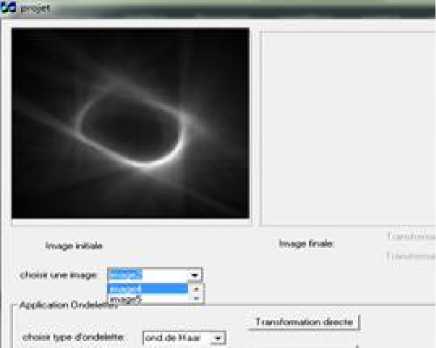
Fig.9. Graphic Interface
View: void()
Choose
Wavelet
Pixel: Integer Number ofcolumns:
Integer Number oflines: integei
Haar Wavelet Mean: Float Difference: Float
Noun : String Direct TransformationO
User
Noun : Strine
Low Pass Filter: Float High Pass Filter: Float
Fig.10. Diagram of classes
-
b) Used Haar-Wavelet Algorithm
Direct Transform
-
• Download file source which contain the
converted binary image
-
• Download f-L and f-H filter file
-
• Treatment following lines
-
• Treatment following columns
// Sgl is the converted binary image
While
{
//Bf[0] and Bf [1] takes the sgl values cvH=0
-
V Calculate the mean with this equation //image approximation
cvH=(Bf[0]+Bf[1])/2
cvL=0;
-
V Calculate the difference // Details of image cvL=Bf[0]-cvH
}
-
• Displaying values of cvL
-
• Displaying values of cvH
-
• Dispalying LL and HL,LH,HL,HH image
results
-
c) Results obtained with the Haar wavelet transform-direct transformation (Visual C++ + graphic
Interface FMC)
We use the Haar wavelet with direct transformation to detect external and internal edges. It’s with the aim to detect distances between bones.
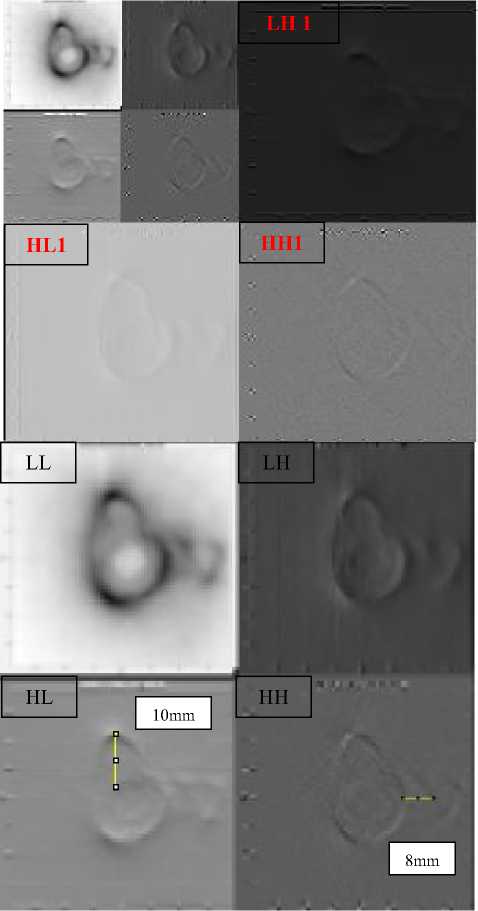
Fig.11. Results obtained with the Haar wavelet transform (Visual C++ + graphic Interface FMC)
We applied the Haar wavelet transform. As a result, the ambiguity which is shown in Fig.11 is resolved. Thus, there is a very clear edge detection showing the external bone edge and the internal bone edge of fibula. As well, the detection of the internal edges is quite clear. We succeeded at the determination of the distance between the tibia and the fibula. Hence, It can be measured, the distance between the tibia and the fibula is 8mm and between the cortical bone and the medullary cavity is 10mm. These distances are similar to the reality bones distances
-
d) Validation Results
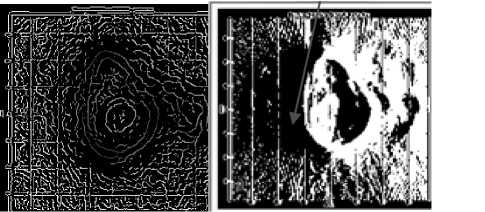
To validate our results, we apply our implemented Haar –wavelet and Region Algorithm detection to a TDM cerebral tomography which represents a tumour. Results are shown in figures below.
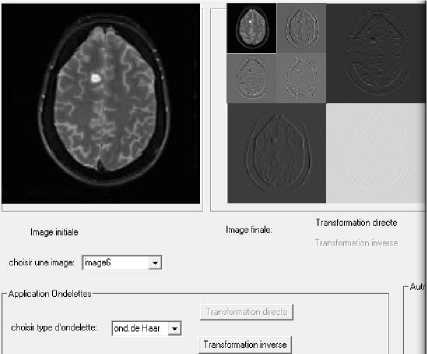
Fig.12. Edge Detection
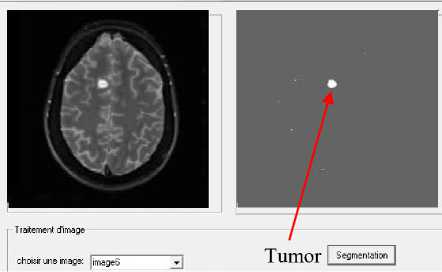
Fig.13. A cerebral tumour detection
As shown in Fig.12 and Fig.13, the internal and external cerebral edges were successfully clearly detected. In other hand, we extract the tumour from the original image.
-
e) Signal to noise ratio (SNR)
The signal to noise ratio SNR is defined by the presence of noise in the image, its formula is illustrated by( 5).
SNR 1 = Signal = -I2- Bruit I q -I ^
With I0 is the original image and Ib is the noisy image
The performance of SNR results was performed by the increase of SNR value [12]. As shown in Table.1, the application of Haar wavelet transform was the best method to reduce noise and to detect edges. In fact the SNR was improved by 6.75 with Haar wavelet transform.
Table 1. SNR results of ultrasonic bone image processing
|
Algorithm |
Image |
SNR(dB) |
|
Image preprocessing algorithm |
Image ((a) fig7) |
7.27 |
|
Gaussian filter((a) fig7) |
7.51 |
|
|
Median ((a)fig7 |
6.74 |
|
|
Sobel ((b)fig7) |
3.92 |
|
|
Canny (b)fig7) |
2.59 |
|
|
Haar Wavelet transform Algorithm |
LL(fig6) |
7.22 |
|
LH(fig6) |
9.91 |
|
|
HL(fig6) |
11.99 |
|
|
HH(fig6) |
13.97 |
2) Histogram Detection
We will use the histogram detection to determinate the different classes existing in our image. We will obtain the interval of contrast density of each class. Using Visual C++ with the graphic interface we obtain the results in figure below.
a) Results obtained with the (Visual C++ + graphic Interface FMC)
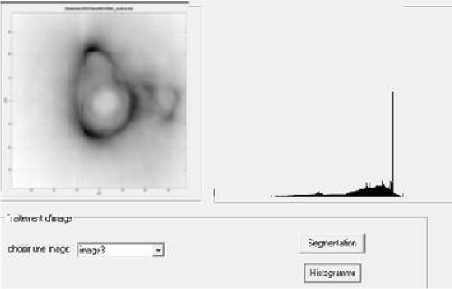
Fig.14. Histogram results obtained with (Visual C+++ MFC graphic interface)
b) Results obtained with the (Eclipse + OpenCv)
Fig.15. Histogram results obtained with OpenCv
c) Results obtained with Matlab
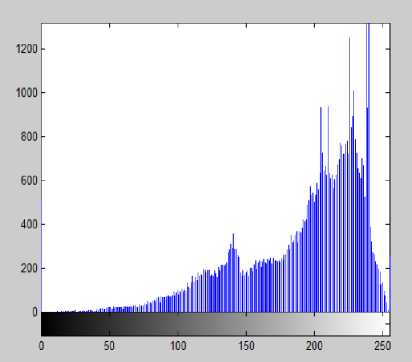
Fig.16. Histogram results obtained with Matlab
The information given with Matlab is efficient to give us 5 regions of density comparing it with results obtained by Eclipse and Visual C++. As a result we have 5 regions of contrast with 5 intervals. These results will be tested by making the region detection.
-
2) Region Detection
-
a) Algorithm
The C ++ region detection algorithm is based on a 5-region image split that can be obtained. We have introduced 5 our own values for contrast ranges (val1, val2, val3, val4, val5) brought from histogram values and we make 5 values defined as integer .
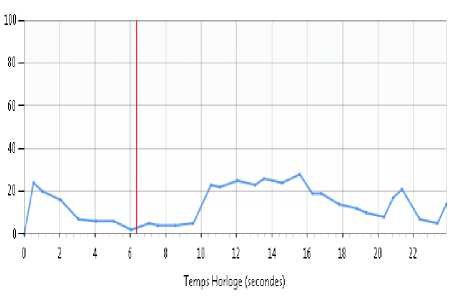
If image contrast Region1 takes value x If image contrast If image contrast Region3 takes value z If image contrast Region4 takes value k If image contrast Region5 takes value h End Displaying results Fig.17. Histogram results obtained with C++ and MFC interface With the graphic interface FMC and Visual C ++ we got the detection of regions with the method of classification of pixels. It leads to obtain results in Fig.17. In fact, in our segmentation of tomographic image into regions we can show five regions. But the ambiguity still present in the detection of the region between the tibia and the fibula.We succeeded in decreasing noise in image and detecting edges. The table.2. below gives us a comparative study of obtained results with haar wavelet transformation. 3) Results efficiency Table.2 below gives us a comparative study of obtained results with haar wavelet transformation. Table.2. Auto Comparative results efficiency Algorithm Region Detectio n Edge detecti on Osteop atholog ic detectio n Best SNR Time Execution Haar-Wavelet Transform ation C++FMC (-) (+++) (++) 13.97 23s We can say that Haar wavelet transformation gives us excellent results in edge detection compared to that given with region detection. In other hand, it’s so efficient in the acceleration of our image processing compared to that found by Lasaygues in 2006. V. Discussions In this section, we are interested in making a comparative study with LMA work results and we make an auto results comparaison in the field of region detection, edge detection, osteopathologies goal detection, time execution and the obtained SNR results. A. Comparative Study with LMA work 1) Edge Detection: Comparing our wavelet transform method (With Visual C ++) with the Sliding Window algorithm done with Matlab made by [3, 13] we can say that we made a sharp automatic detection of edges and we improve resolution. Increasing USCT imaging process using only signal processing could not be alone the good way to enhance the resolution of the image [4] and then to detect some bone abnormalities. Associated first signal processing, before the processus of image reconstruction, and then, with automatic and accuracy image processing tool will be the good way for the future of the method. 2) Time execution with Visual C++ : We can say that we reduce time at the image execution level with 23s of value. The proposed algorithm is faster than that proposed by Lasaygues in 2006. Fig.18. Time execution of ultrasound tomographic image with Visual C++ 3) Region Detection: Comparing my work done with Visual C++ and the method of classification with the LMA work [4, 13] done with Sliding Window, the relative error in measuring the cortical area of a bone by the "sliding windows" method is between 4 and 20%. It is very high. We can say that the problem doesn’t solved. We have to think of the application of a deep learning algorithm which make the combination between neural network and Genetic algorithm and will make an acceleration of time execution by the implementation of our algorithm on GPU. 4) SNR compared to [12, 14] In general, image areas with higher SNR indicate having better contrast resolution [12]. SNR is important, as it is a good measure of image quality. In detecting lesions in the body, however, high SNR alone will not guarantee that sufficient contrast exists to make the lesion detectable [14] so we have to look for contrast to noise ratio. In fact, CNR between lesion and background is important, as it serves as a quantitative metric for low-contrast lesion detection: the higher the CNR between lesion and background, the more likely the lesion's detection [6, 7]. VI. Conclusion In this paper, we present a new method. It is very interesting, and allows the detection of edges and regions. So with this new method ,we improve the resolution, we can automate the processing and we're going faster. And then, it must be said that compared to what is already published, the method shows more resolved results, faster. After a comparative study with the results obtained by LMA equip, we succeeded in the resolution of the problem of detection of distance between bones and the different edges are detected by the Haar wavelet transform. The more important is our won of time execution. The next step will be devoted to the application of neural network algorithm for the resolution of problem of region detection. As well, we will be interested in the 3D reconstruction.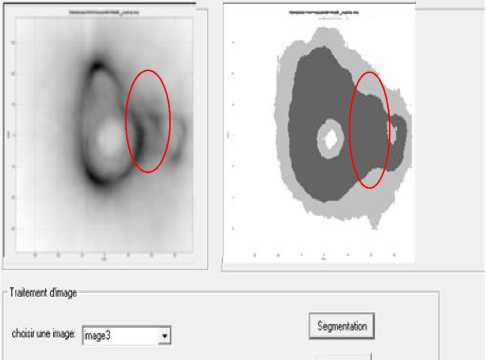
References Improved USCT of paired bones using wavelet-based image processing
- P. Lasaygues and J. Lefebvre, “Bone Imaging by Low Frequency Ultrasonic Reflection Tomography,” in Acoustical Imaging, vol. 25, M. Halliwell and P. N. T. Wells, Eds. Boston: Kluwer Academic Publishers, 2002.
- P. Lasaygues, “Assessing the cortical thickness of long bone shafts in children, using two-dimensional ultrasonic diffraction tomography,” Ultrasound Med. Biol., vol. 32, no. 8, pp. 1215–1227, Aug. 2006.
- Philippe Lasaygues Tomographie ultrasonore osseuse : Caractérisation de la diaphyse des os par inversion d’un champ acoustique diffracté, Intérêt pour l’imagerie pédiatrique, 2006
- Philippe Lasaygues , Régine Guillermin , Khaled Metwally , Samantha Fernandez , Laure Balasse2,3, Philippe Petit, Cécile Baron, Contrast resolution enhancement of Ultrasonic Computed Tomography using a wavelet-based method – Preliminary results in bone imaging” , International Workshop on Medical Ultrasound Tomography, Nov 2017, Speyer, Germany modified , Avril 2018.
- Dimah Dera, Nidhal Bouaynaya & Hassan M. Fathallah-Shaykh automated, “Robust Image Segmentation: Level Set Method Using Nonnegative Matrix Factorization with Application to Brain MRI”, Society for Mathematic al Biology, Springer 2016.
- Hendrick RE. Image contrast and noise. In Stark DD, Bradley WG, eds. Magnetic Resonance Imaging, 3rd Edition, St. Louis: Mosby Publishing Co., Vol 1, Ch. 4, p. 43–68. 1999.
- RE Hendrick - 2008Signal, Noise, Signal-to-Noise, and Contrast-to-Noise Ratio, Breast MRI, Springer, pp 93-111,2008
- H. Li , S. Wang , A new image denoising method using wavelet transform., in: International forum on information technology and applications, IFITA 09. In Chengdu, 2009, pp. 111–114 .
- M.A . Mayer, A . Borsdorf , M. Wagner , J. Hornegger , C.Y. Mardin , R.P. Tornow , Wavelet denoising of multiframe optical coherence tomography data, Biomed. Open. Express 3 (3) (2012) 572–589 .
- B.K. Shreyamsha Kumar, “Image denoising based on gaussian/bilateral filter and its method noise thresholding”. Signal, Image and video processing, Springer- Verlag London Limited 2012.
- O. R. Vincent, Abeokuta, “A Descriptive Algorithm for Sobel Image Edge Detection”, Proceedings of Informing Science & IT Education Conference (InSITE) 2009.
- Yin-Yin Liao, Jui-Chen WU, Chia-Hui Li and Chih Kuang Yeh, “Texture Feature Analysis for Breast Ultrasound Image Enhancement”, Ultrasonic Imaging 33, 264- 278 (2011).
- Philippe Lasaygues, Jean Pierre Lefbvre, Regine Guillermin, Valene Kaftandjian, Jean Philippe Berteau, Martine Pithroux and Philippe Petit, “Advanced Ultrasonic tomograph of children’s bones”, Acoustical Imaging 31 Springer Science + media B.V 2012
- S.U. Yan g , X.U. Zhijie , Parallel implementation of wavelet-based image de- noising on programmable PC-grade graphics hardware., Signal Process. 90 (8) (2010) 2396–2411
- Sonia Dahdouh, Filtrage , segmentation et suivi d’images échographiques applications cliniques, thèse université Paris Sud , 2011.
