Improvement of the Hard Exudates Detection Method Used For Computer- Aided Diagnosis of Diabetic Retinopathy

Author: Feroui Amel, Messadi Mohammed, Bessaid Abdelhafid
Journal: International Journal of Image, Graphics and Signal Processing(IJIGSP) @ijigsp
Article in issue: 4 vol.4, 2012.
Free access
Diabetic retinopathy is a severe and widely spread eye disease. Early diagnosis and timely treatment of these clinical signs such as hard exudates could efficiently prevent blindness. The presence of exudates within the macular region is a main hallmark of diabetic macular edema and allows its detection with high sensitivity. In this paper, we combine the k-means clustering algorithm and mathematical morphology to detect hard exudates (HEs) in retinal images of several diabetic patients. This method is tested on a set of 50 ophthalmologic images with variable brightness, color, and forms of HEs. The algorithm obtained a sensitivity of 95.92%, predictive value of 92.28% and accuracy of 99.70% using a lesion-based criterion.
Ophthalmology, Color Fundus Images, Diabetic Retinopathy (DR), Hard exudates, Segmentation, Mathematical morphology, k-means clustering algorithm
Short address: https://sciup.org/15012289
IDR: 15012289
Text of the scientific article Improvement of the Hard Exudates Detection Method Used For Computer- Aided Diagnosis of Diabetic Retinopathy
Published Online May 2012 in MECS DOI: 10.5815/ijigsp.2012.04.03
The diabetic retinopathy (DR) is a microvascular complication of diabetes [1], which affects blood vessels and causes abnormalities in the retina. It remains an important cause of visual impairment and the first cause of blindness in people under 60 years. The evolution of the disease is slow and there are no salient symptoms in the early stages of diabetic retinopathy, but their number and severity predominantly increase with time. Early detection of DR through screening can help to prevent blindness and vision loss. It’s characterized by the development of three kinds of symptoms. First, microaneurysms, Second hemorrhages [2]. Third, the retinal edema and hard exudates appear because of the increased permeability of the capillary walls [3]. For aid to diagnosis of the diabetic retinopathy system, should be detected before state of complications such as the presence of the macular edema.
In this paper, we focus on hard exudates detection in color fundus image. The location of the exudates in the macular region is valuable information for the ophthalmologist [4-5], their number is an indicator of disease severity. They are not only a perceptible sign of diabetic retinopathy but also an indication for the occurrence of retinal edema. Edema and exudates are major origins of visual loss in the non- proliferative forms of DR.
Sanchez et al [6] proposed a method based on mixture models to threshold images in order to separate exudates from background. They obtained a sensitivity of 90.2%. at a cost of failure in detecting faint exudates. Garcia et al. [7] used classifiers and machine learning techniques for exudate detection. Using a lesion-based criterion, they obtained a mean sensitivity of 88.14%. Dupas et al [8] presented a pixel-based hard exudate detection method in ocular-fundus images. They obtained 92.8% sensitivity by analyzing 30 images set containing 15 exudates ones. Sanchez et al [9] used a contextual information for exudate detection. They obtained 91% sensitivity and 70% specificity they used 144 images (69 with exudates and 75 normals) divided into two 72-image groups. Hussain et al [10] used a combination of coarse and fine segmentation to detect HEs. The result is achieved with 89.7% sensitivity, 99.3% specificity and 99.4% accuracy. A limitation of this method is that it occasionally fails to exclude some non-exudate objects particularly those that have similar features to real exudates. In another work of Hussain et al [11], top-down image segmentation was used to partition the image into homogeneous regions followed by edge detection and region growing to segment HEs candidate before the classification process. This method fails to get rid of some artifacts. Kavitha et al [12] used a method based on color histogram thresholding for identification of hard and soft exudate pathologies in retinopathy images. The overall sensitivity, specificity and accuracy obtained by this approach were 89.78%, 99.12% and 99.07%, respectively. However, this method yields some false detection because of similarity between some pixels of exudates and those of optic disc and edge of blood vessels.
In this paper, we propose an algorithm which is based on combination of k means clustering algorithm and mathematical morphology to detect hard exudates in retinal images. These techniques are widely used for image segmentation [13]. The advantage of the proposed approach is its adaptation to variability of images in terms of brightness color and contrast acquisent by a retinographe from non-dilated pupils.
The paper is organized as follows: In section II, properties of HEs are presented. In section III, the K-means clustering algorithm and mathematical morphology are studied. In Section IV, the proposed method is presented. In Section V, Results and Discussions are presented; Finally, Section VI concludes the paper.
-
II. Properties of Hard exudates
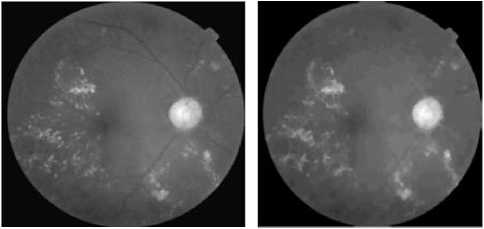
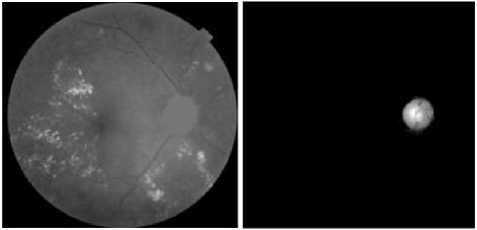
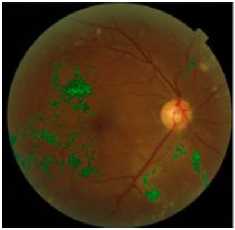
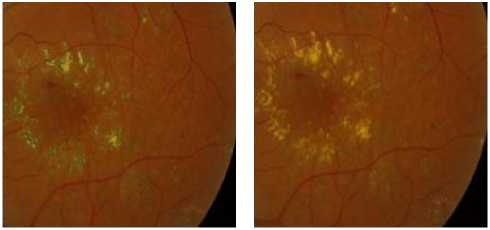
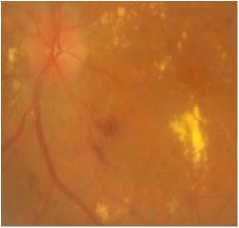
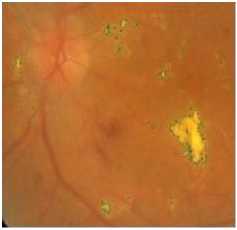
Exudates are proteins and lipids leaking from the blood into the retina via damaged blood vessels [14,15]. They are of diverse sizes and forms and are of variable number. HEs are highly reflective and appear bright of yellow color with well defined margins. figure 1 shows fundus image in DR containing hard exudates.
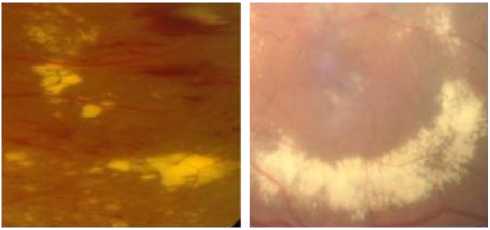
Figure 1. The Presence of Hard Exudates with Different Brightness, Forms In Fundus Images
-
III. Properties of Hard exudates
-
A. K-means Clustering Algorithm
The K-Means is an unsupervised clustering algorithm that classifies the input data points into multiple classes based on their inherent distance from each other [16]. The algorithm assumes that the data features form a vector space and tries to find natural clustering in them. The points are clustered around centroids A V; = 1... k which are obtained by minimizing the objective
k
V = ZZ ( X j - A i ) 2 (1)
i = 1 j si
The algorithm takes a 2 dimensional image as input and can state as follows:
-
1. Compute the intensity distribution (also called the histogram) of the intensities.
-
2. Initialize the centroids with k random intensities.
-
3. Repeat the following steps until the cluster labels of the image do not change anymore.
-
4. Cluster the points based on distance of their intensities from the centroid intensities.
-
5. Compute the new centroid for each of the clusters.
c ( i ) : = argmin ^x ( ‘ ) - а\|2 (2)
m
D c ,. = j i X ' ' ’
A : = —-------- im
2 1 < C ,„= j i
= 1
Where k is a parameter of the algorithm (the number of clusters to be found), iterates over the all the intensities, iterates over all the centroids and are the centroid intensities.
-
B. Mathematical Morphology (MM)
The proposed approach used mathematical morphology which offers many powerful tools for image processing and analysis. It considers images as geometrical objects, to be analyzed through their interactions with other geometrical objects. It relies on several branches of mathematics, such as discrete geometry, topology, lattice theory, partial differential equations, integral geometry and geometrical probability [17].The fundamental operations on Mathematical morphology are: dilation and erosion. Dilation expands and erosion shrinks objects marked in the image. Other morphological operations are for example morphological opening and closing which are based on dilation and erosion [18]. An essential part of the dilation and erosion operations is the structuring element (SE) used to probe the input image.
-Dilation: ( f ® S )( x , y ) = max { f ( x - s , y - 1 1( s , t ) e S } Erosion: ( f © S )( x , y ) = min { f ( x + s , y + 1 ( s , t ) e S } Opening: f о S = ( f © S ) ® S
Closing: f • S = ( f ® S ) © S
Were f ( x , y ) is a finite-support grayscale image function defined on grid Z 2 , S is a binary structuring element.
Where there are k clusters S i , i = 1, 2, 3…. k and
A is the centroid or mean point of all the points x_ e= S.
-
IV. PROPOSED METHOD
The proposed method to detect hard exudates from the retinal fundus image is shown in the following flowchart (figure. 2).
f(t) =
Color retinal image of the diabetic patient
16 '7.787 *t+—-116
fort > 0.008856
otherwise
Contrast Enhancement
Application of k-means algorithm to extract hard exudates regions
Thresholding operation
Optic disc Segmentation
Optic disc Elimination
I
Elimination the lesions with blurred edge
J
Morphological reconstruction by dilation
The final result of detection of hard exudates
Where X n , Y n and Z n are the tristimulus values of the reference white
In order to reduce noise and preserve edges, a median filter is applied on the L band (figure 3.c). a ContrastLimited Adaptive Histogram Equalization (CLAHE) technique [19] is used to improve the contrast of the image and enhance the separability between exudats and the background (figure 3.d).The CLAHE technique consists in subdividing the image into non-overlapping rectangular regions, then applying their local equalization histogram.
B. Hard Exudates Regions Extraction
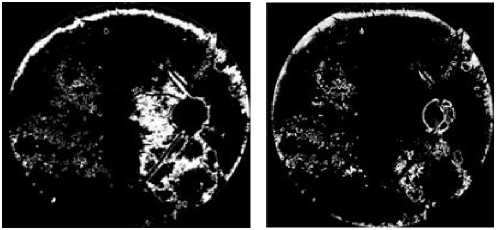
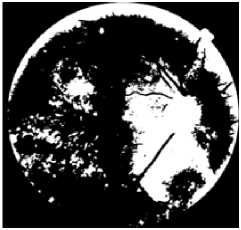
Hard exudates are considered to be bright intensity regions in the fundus images with distinct boundaries. To extract these regions, the k-means clustering algorithm is applied. This algorithm requires pre-processing on the enhancement filtered image (figure.3.d), which consists in converting the pixel matrix into a vector of gray levels. When the algorithm is applied to the vector, it is converted into a matrix of each cluster value for each pixel of the image. Figure 3, shows the results obtained by applying the k-means with 3, 4, 6 and 10 clustered.
-
Figure 2. Proposed Technique
-
A. Contrast Enhancement
Usually, the acquired retinal images are noisy and of low contrast and nonuniform illumination. Noises can be generated by acquisition devices, movement of the patient, differences in the illumination of the eye that depend on technology and on the geometry of the patient’s eye. Therfore, a preprocessing step of the fundus photographs are needed before detecting hard exudates. Initially, the original color fundus retinal images of red, green and blue (RGB) space are transformed to CIELab color space [12] (figure 3.b). This color space is a the second of two systems adopted by CIE in 1976 as models that better showed uniform color spacing in their values. CIELAB indicates these values with three axes: L*, a*, and b*.L defines lightness, a denotes the red/green value and b the yellow/blue value. This color space is not as easy to visualize, because L is a value between 0 and 100. The CIELab color space colour space is more appropriate for contrast enhancement as it allows the intensity to be treated separately from the other two components. Relations for L*, a *, and b * are as follows:
(a) Typical color retinal image
(b) CIELAB color space Conversion
(c) l bande image
(d ) The result after preprocessing
116 - — - 16 for — > 0.008856
^903.3»^—J otherwise a * = 500 *( f | X- |-f (Y - Yn ) (5)
V X n )
b* = 200* ( f [ X |- f ( Z - Z„ ) (6)
V Xn )
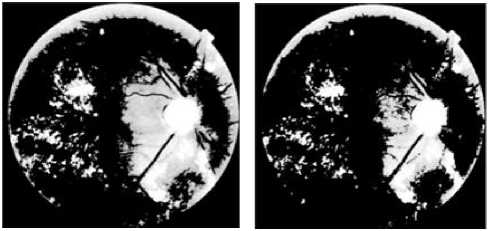
(f)The result of k-means with k=4
(e) the result of k-means with k = 3
(g) the result of k-means with k=6 (h) the result of k-means with k=10.
Figure 3. Detection Of Hard Exudates Regions By Using The The K-Means Clustering Algorithm
The figures (3. e. f. g and h) show, that all regions containing exudates are detected and separated from the background. However regions that do not correspond to exudates which are mainly on the edge of the image.
For k = 3 and k = 4 (figure 3.e and f), all exudative regions were defined by the algorithm. When we increase the number of clusters (k=6, k=10) (Figure.3.g and h), many clusters appear in the images at discrete places. Therefore, the exudative zone gradually splits into several parts which affect information on pixels containing exudates. After several tests, the best result obtained corresponds to k = 3.
The papillary region and other yellow lesions, such as cotton wool spots, are detected (figures 3. e, f. g and h), because of their similar attributes to0 hard exudates in terms of brightness, color and contrast. Therefore, these regions should be removed to keep only the hard exudates.
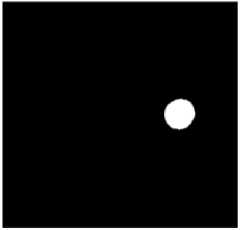
C. Optic Disc Segmentation
The optic disc is one of the main elements of the retinal image. It is considered the exit region of the blood vessels and the optic nerves from the retina. It appears as a bright yellowish or white region, circular or elliptical form. The optic disc size varies from one person to another, occupying about one tenth to one fifth of the image.
The main steps to extract the optic disc are presented as flow:
-
• Presentation of the original image in the luminanace channel.
-
• Elimination of the retinal network
-
• Thresholding opertation
-
• Morphological reconstruction by dilation
-
• Final result of the optic disc segmentation
The luminance channel of the retinal image (figure.4.a) is used to enhance the contrast in the papillary region. The vascular network should be removed from the image to favor the optic disc to be clear. This operation is carried out by a morphological closing operation [19] using a circular structuring element of larger size than the width of the vessels (figure.4.b).
OP 1 = <*, )
- Op : luminance channel of the original image, - ^? : morphological closing using a structuring element e 1
- O the closed image.
To separate the optic disc from the background, a thresholding operation is applied. To ensure a good extraction of this element, (figure.4.c).
O p 2 = [ Ts , ( O p , )]
As shown in figure (4.c), it is not possible to find a good threshold which segments all optic disc. To solve this problem we apply a morphological reconstruction by dilation under the image of the luminance channel (figure.4.a) considered as a mask.
To obtain a marker image, all pixels included in dilated image of the figure (4.c) are set to 0 in the image of the luminance channel. The marker image is shown in figure (4.d).
O p 3 = R U min anace ( image.4.C )
All papillary regions (figure 4.e), are not reconstructed during reconstruction of the image. To segment the optic disc, the operation of subtraction is carried out between the image of the luminance channel (figure.4.a.) and the reconstructed image (figure.4.e), as illustrated in figure.4.
(a)The luminance channel Of the original image
(b) Elimination of the vascular tree
(c) The result of theThresholding
(d) Marker image
The results of hard exudates detection are presented in figure.5.
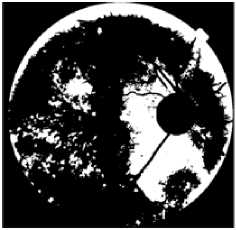
(e) The result of the reconstruction (f) The result of the optic disc by dilation segmentation
(a)Thresholding the result of (b) Elimination of the optic disc application of the k-means clustering
Figure.4 Result Of Optic Disc Segmentation.
(c)Application of the kirsch Operator
(d) Detection of the objects with sharp edges
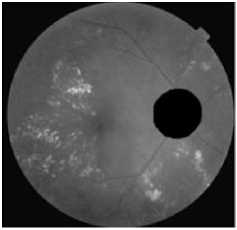
In order to eliminate the optic disc from the result of a binary image of Figure (3.e), we applied a subtraction operation between this image and a binary dilated version of the segmentation result of the optic disc (figure 4.f).
Ex i = Ts 2 ( image(3 . e )) - [ ( [ ^ ( b ) ] ( Ts 3 ( image(4. f )))) ]
Ts2 : binary image of image (3.e); t ) ( b ) : binary dilation using a structuring element b1 ; Ts :thresholding of image(4.f) using a threshold s 3 .
(e) Result of the morphological reconstruction
(f) final result of hard exudates detection superimposed on original image
D. Elimination Of Lesions With Blurred Edge
To detect only hard exudats characterized by yellowish color and sharp edge and remove all lesions with high intensity but blurred edges such as cotton wool spots …etc, we calculate the edge strengths. This task can be accomplished using the The Kirsch operator [20], which detects edges using eight compass filters. All eight filters are applied in a few predetermined directions to the green channel of original image with the maximum being retained for the final image (Figure 5.c). The kirsch operator is defined as flow:
Figure.5 Results Of Hard Exudates Extraction In The Retinal Image.
Kirsch = —
— 3
— 3
—
—
—
We combine then, the thresholding result of figure (5.c) by using a threshold s4 with image of figure (5.b) using a boolean operation AND as show in figure (5.d). Thus, we can we apply, a morphological reconstruction by dilation under the retinal image of the green channel (figure.5.e).
V. Results and Discussion
The algorithm that we have developed has been tested on a set of retinal images of database Messidor [21]. The images were acquired in three different ophthalmology departments, 400 images in each department, using a nonmydriatic digital retinal camera (TRC NW5; TopCon, Tokyo, Japan) with 45° field of view. Image sizes were 1440 *960 in 588 images, 2240* 1488 in 400 images, and 2304 *1536 in 212 images. All the images were saved in uncompressed TIFF format. For each image, indicated the level of exudation: the level depends on the area occupied by the exudates and their positions relative to the center of vision (macula). The diagnoses were considered to be the reference standard for the performance analysis in our work. From 1200 images, we randomly choose 40 images affected by one or more types of bright lesions (hard exudates, cotton wool spots
and drusen) characterized by variable color, brightness and quality and 10 were determined by an expert to have no bright lesion to validate the effectiveness our method. A retinal specialist performed manual annotations outlining hard exudates on all images. These annotations were taken as the reference standard.
Fifty images were tested on Intel Core 2 Duo 2.66 GHz PC with 3GB of RAM using Matlab 2009.b. Each image took approximately 19 seconds for running the whole process. However the approchas of [20] and [2] require 4.3 and and 3 minute respectively.
In 9 of the 10 images, that not contain exudates, the algorithm succeeds (it found no exudates). In one image, there were very few false positives.
However, in 34 images that contain bright lesions, all hard exudates are detected by using a low value of cluster k (Figure.6.b). In the remaining images few exudates were missed by our algorithm. This false detection is due to very low contrast and artifacts during acquisition in exudative regions. Therefore, the very small exudates are not well defined.
The choice of threshold values, structural elements, and the cluster k are considered as main parameters to get correct detection of small exudates in the retinal image. figure (6.d) shows inadequate choice of these parameters
be determined in terms of lesion-based criterion for each image in the test set.
Sensitivity =
Specificity =
PV =
TP
TP
TP + FN
TN
TN + FP
TP + FP
Accuracy =
TP + TN
TP + FP + TN + FN
(a)Original colored retinal image
-
- TP (true positive): number of pixels classified as exudates by both the ophthalmologist and the algorithm.
-
- FP (false positive): number of non-exudates pixels which are wrongly detected as exudates pixels by the algorithm.
-
- TN (True negative): number of no exudates pixels which are identified as non-exudates pixels by both the ophthalmologist and the algorithm.
-
- FN (false negative): number of exudates pixels that are not detected by the algorithm but are considered as exudates by ophthalmologist
-
- PV (predictive value): the probability that a pixel classified as belonging to the lesion is really an exudates.
The obtained results of TP, FP, FN, TN, sensitivity, specificity,predictive value and accuracy from the images containing one or more types of bright lesions are summarized in Table 1
(c) typical original image
(b) the result of exudates segmentation
(d) Exudates missed by algorithm
Figure 6. Result Of Exudates Extraction With Varying Sizes In The Image
To evaluate the performance of the presented approach, we compared our results with the performance of ophthalmologist, who marked manually hard exudates as a marker for DR in these images. The sensitivity, specificity, predictive value and accuracy [22-23] are to
Table.1 Comparison of the results from k-means clustering followed by morphological reconstruction with ophthalmologist.
|
Images |
TP |
FP |
TN |
FN |
Sensitivity |
Specificity |
Predictive value |
Accuracy |
|
1 |
2380 |
150 |
152320 |
151 |
94,03 |
99,90 |
94,07 |
99,81 |
|
2 |
5250 |
166 |
120610 |
124 |
97,69 |
99,86 |
96,94 |
99,77 |
|
3 |
5160 |
153 |
131205 |
112 |
97,88 |
99,88 |
97,12 |
99,81 |
|
4 |
1475 |
292 |
121012 |
184 |
88,91 |
99,76 |
83,47 |
99,61 |
|
5 |
3429 |
244 |
153214 |
52 |
98,51 |
99,84 |
93,36 |
99,81 |
|
6 |
6570 |
177 |
123101 |
144 |
97,86 |
99,86 |
97,38 |
99,75 |
|
7 |
2290 |
125 |
137135 |
134 |
94,47 |
99,91 |
94,82 |
99,81 |
|
8 |
3120 |
170 |
133575 |
160 |
95,12 |
99,87 |
94,83 |
99,76 |
|
9 |
1719 |
134 |
136050 |
52 |
97,06 |
99,90 |
92,77 |
99,87 |
|
10 |
1897 |
110 |
15270 |
85 |
95,71 |
99,28 |
94,52 |
98,88 |
|
11 |
1480 |
130 |
132320 |
140 |
91,36 |
99,90 |
91,93 |
99,80 |
|
12 |
1126 |
144 |
173406 |
42 |
96,40 |
99,92 |
88,66 |
99,89 |
|
13 |
1838 |
122 |
165259 |
38 |
97,97 |
99,93 |
93,78 |
99,90 |
|
14 |
381 |
125 |
165485 |
76 |
83,37 |
99,92 |
75,30 |
99,88 |
|
15 |
1247 |
168 |
136157 |
20 |
98,42 |
99,88 |
88,13 |
99,86 |
|
16 |
1239 |
102 |
103205 |
99 |
92,60 |
99,90 |
92,39 |
99,81 |
|
17 |
1489 |
165 |
135928 |
22 |
98,54 |
99,88 |
90,02 |
99,86 |
|
18 |
1657 |
147 |
198754 |
20 |
98,81 |
99,93 |
91,85 |
99,92 |
|
19 |
13698 |
113 |
114782 |
69 |
99,50 |
99,90 |
99,18 |
99,86 |
|
20 |
6898 |
127 |
168684 |
41 |
99,41 |
99,92 |
98,19 |
99,90 |
|
21 |
3478 |
89 |
198756 |
154 |
95,76 |
99,96 |
97,50 |
99,88 |
|
22 |
2654 |
165 |
141695 |
136 |
95,13 |
99,88 |
94,15 |
99,79 |
|
23 |
2018 |
157 |
146520 |
163 |
92,53 |
99,89 |
92,78 |
99,79 |
|
24 |
1063 |
132 |
132740 |
134 |
88,81 |
99,90 |
88,95 |
99,80 |
|
25 |
2310 |
465 |
100206 |
96 |
96,01 |
99,54 |
83,24 |
99,46 |
|
26 |
2963 |
284 |
110392 |
73 |
97,60 |
99,74 |
91,25 |
99,69 |
|
27 |
2296 |
56 |
12593 |
23 |
99,01 |
99,56 |
97,62 |
99,47 |
|
28 |
3621 |
203 |
173691 |
153 |
95,95 |
99,88 |
94,69 |
99,80 |
|
29 |
2596 |
563 |
153160 |
39 |
98,52 |
99,63 |
82,18 |
99,61 |
|
30 |
2496 |
105 |
136026 |
109 |
95,82 |
99,92 |
95,96 |
99,85 |
|
31 |
3036 |
100 |
162874 |
146 |
95,41 |
99,94 |
96,81 |
99,85 |
|
32 |
2896 |
276 |
149830 |
151 |
95,04 |
99,82 |
91,30 |
99,72 |
|
33 |
1003 |
120 |
112360 |
50 |
95,25 |
99,89 |
89,31 |
99,85 |
|
34 |
2936 |
214 |
13644 |
128 |
95,82 |
98,46 |
93,21 |
97,98 |
|
35 |
2530 |
106 |
11508 |
69 |
97,35 |
99,09 |
95,98 |
98,77 |
|
36 |
366 |
51 |
100380 |
21 |
94,57 |
99,95 |
87,77 |
99,93 |
|
37 |
3214 |
289 |
131710 |
40 |
98,77 |
99,78 |
91,75 |
99,76 |
|
38 |
3256 |
288 |
121360 |
59 |
98,22 |
99,76 |
91,87 |
99,72 |
|
39 |
2375 |
229 |
132801 |
22 |
99,08 |
99,83 |
91,21 |
99,81 |
|
40 |
4280 |
228 |
125041 |
60 |
98,62 |
99,82 |
94,94 |
99,78 |
|
A.V |
95,92 |
99,78 |
92,28 |
99,70 |
The number of non exudates which are classified in the lesion by ophthalmologist and by algorithm is high (table 1) is the reason that the value of specificity is near to 100%. Therefore the rate of specificity is not well adapted to evaluate the performance method.
The sensitivity, the PV and the accuracy values achieved are higher at 96%, 90% and 99% respectively because a few false negatives and false positive were detected. However, where exudates appear with a very low contract or are in the vicinity of blood vessels are not detected by the algorithm but they are extracted by the ophthalmologist. In addition, the pixels with level of gray close that of the exudates are wrongly detected as exudates by the algorithm. Consequently the rate of the sensitivity, PV are lower at 88% and 83% respectively. For normal retinal image detection, the specificity proportion is 100%. The sensitivity cannot be calculated in which TP and FN values are all zero due to no exudates in ground-truth images.
In order to assess the algorithm performance with respect to change of the parameters k and s4. The sensitivity is plotted as a function of predictive value for different value of k and s 4 (figure.8). This procedure is carried out for each image in our data set contains bright lesions.
Figure 7, show that performance goes down for k = 10 . The best results were obtained for k=3 and s4 =0.9 with an average sensitivity, PV and an accuracy of 95.92%, 92.28% and 99.70% respectively.
Our results are compared with a manual detection of hard exudates by ophthalmologist based on lesion criterion. Due to many images databases in ophthalmologist and different evaluation methods is difficult to compare our algorithm with other work published throughout the years. However some works [8], [9] and [24] report algorithms proximate performances than our approach with average sensitivity value of 92.08%, 91% and 97,49% respectively.
k = [3, 5, 10]
s 4 = [0.3, 0.4, 0.5, 0.6, 0.8, 0.9]
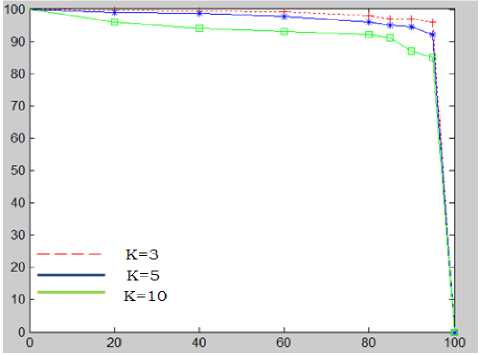
Figure 7. the sensitivity as a function of the PV for different values of K and a threshold s 4
-
VI. Conclusion
In this paper, a fast method to hard exudates detection in ophthalmology images based on k-means clustering and mathematical morphology operators is presented. This approach will be used to improve the precision of the diagnosis of the diabetes retinopathy before the stage of complications. We started in a first step with a preprocessing operation of contrast enhancement in order to enhance the quality of the input image. In the second step the k-means clustering are used in order to detect exudates regions. In the third step, the optic disc is segmented to be removed. Finally, applying a kirsch operator to detect elements with sharp edges, and morphological reconstruction to keep HEs. The final results are compared quantitatively with a manual exudates segmentation produced by an expert in ophthalmology. Performances of our method are measured by sensitivity predictive value and accuracy because they combine true positive and false positive rates. Our results suggest that the proposed method can help the ophthalmologist to detect exudates at the early stage from diabetic patients. In future works we will further to detect other types of such as microaneurysms, cotton-wool spots and hemorrhages in order to classifiers different stages of DR.
References Improvement of the Hard Exudates Detection Method Used For Computer- Aided Diagnosis of Diabetic Retinopathy
- M. Niemi, K. Winell. Diabetes In Finland Prevalence And Variation In Quality Of Care. Kirjapaino Hermes Oy Tampre, Finland, 2006.
- Akara Sopharak , Bunyarit Uyyanonvara , Sarah Barman, Thomas H. Williamson. Automatic Detection Of Diabetic Retinopathy Exudates From Non-Dilated Retinal Images Using Mathematical Morphology Methods. Computerized Medical Imaging And Graphics , 2008(32):720-727.
- Kauppi T, Kalesnykiene J, Kamarainen K, Lensu L, Sorri I. The Diaretdb1 Diabetic Retinopathy Database And Evaluation Protocol.
- Davis MD, Bressler SB, Aiello LP, Bressler NM, Browning DJ, Flaxel CJ. Comparison of time-domain and fundus photographic assessments of retinal thickening in eyes with diabetic macular edema. Invest Ophthalmol Vis Sci,2008(49):1745–52.
- Jayakumari C, Santhanam T. Detection of hard exudates for Diabetic Retinopathy Using Contextual Clustering and Fyzzy Art Neural Network. Asian Journal of Information Techonology, 2007(8): 842-846.
- Sánchez CI, García M, Mayo A, López MI, Hornero R. retinal image analysis based on mixture models to detect hard exudates. Medical Image Analysis, 2009(13): 650-658.
- Garcia M, Sanchez CI, Lopez MI, Abasolo D, R Hornero, “Neural network basad detection of hard exudates in retinal images”, Computer Methods and Programs in Biomedicine, 2009(93):9-19.
- Dupas B, Walter T, Erginay A, Ordonez R, Deb-Joardar N, Gain P, Klein JC, And Massin P, Evaluation Of Automated Fundus Photograph Analysis Algorithms For Detecting Microaneurysms, Haemorrhages And Exudates, And Of A Computer-Assisted Diagnostic System For Grading Diabetic Retinopathy. Diabets & Metabolism, 2010(36): 213- 220.
- Sanchez C. I., Niemeijer M., Schulten M. S. A. S., Abramo M., And Van Ginneken B., Improving Hard Exudate Detection In Retinal Images Through A Combination Of Local And Contextual Information,In Ieee Intl. Symposium On Biomedical Imaging, Pp 5-8,2010.
- Hussain F, Jaafar, Asoke K. Nandi and Waleed Al-Nuaimy, Automated Detection Of Exudates In Retinal Images Using A Splitand-Merge Algorithm,European Signal Processing Conference, EUSIPCO, 2010
- Hussain F. Jaafar, Asoke K. Nandi And Waleed Al-Nuaimy, Automated Detection And Grading Of Hard Exudates From Retinal Fundus Images, European Signal Processing Conference (EUSIPCO), 2011
- Kavitha S, Automatic Detection Of Hard And Soft Exudates In Fundus Images Using Color Histogram Thresholding. European Journal Of Scientific Research, 2011(48): 493-504.
- Ali Salem Bin Samma, Rosalina Abdul Salam. Adaptation Of K-Means Algorithm For Image Segmentation. Word Academy Of Science. Engineering Technology 50, 2009.
- Stephen S. Feman, Thomas C. Leonard-Martin, J. Stevens Andrews, Cecile C. Armbruster,Theresa L. Burdge, Judith D. Debelak, Angela Lanier, and Amy G. Fischer. A Quantitative System To Evaluate DiabeticRetinopathy From Fundus Photographs. Investigative Ophthalmology 8c Visual Scien, 1995(36) :174-181.
- Sinthanayothin C, Boyce JF, Cook HL, Williamson TH. Automated Localization Of The Optic Disc, Fovea, Retinal Blood Vessels From Digital Colour Fundus Images, Br J Ophthalmology, 1999(83):902–10.
- Suman Tatiraju, Avi Mehta. Image Segmentation Using K-Means Clustering, Em And Normalized Cuts. Department Of Eecs, University Of California – Irvine, Ca 92612.
- Francisco A. Pujol, Mar Pujol and Ramón Rizo. Optimizing Mathematical Morphology for Image Segmentation and Vision-based Path Planning in Robotic Environments. Vision Systems: Segmentation and Pattern Recognition,2007 :546
- Markku Kuivalainen. Retinal Image Analyzing Machine Vision; Master’s Thesis; Department Of Information Technology, Lappeenranta University Of Technology, 2005
- Rafael C, Richard E, Woods And Steven L, Digital Image Using Matlab Processing, University Of Tennessee, 2004.Liu He. Digital Image Processing and Application. Beijing: China Electric Power Press, 2006.
- Giancardo L, Meriaudeau F, Karnowski TP Li Y, Tobin Jr KW, Chaum E. Automatic Retina Exudates Segmentation Without A Manually Labelled Training Set,Internationa Symposium On Biomedica L Imaging, Russian Federation, 2011.
- Http://Messidor.Crihan.Fr/Download.Php.
- John A. Moving Beyond Sensitivity And Specificity: Using Likelihood Ratios To Help Interpret Diagnostic Tests. Austral. Prescrib, 2003(26):111-113.
- Maria K. Evaluation Strategies For Medical-Image Analysis And Processing Methodologies, In Medical Image Analysis Methods: The Electrical Engineering And Applied Signal Processing Series. Costaridou, L., Editor; Crc Press: Boca Raton, Fl, Usa,2005: 433-471.
- Ivo Soares, Miguel Castelo-Branco, António M. G. Pinheiro. Exudates Dynamic Detection In Retinal Fundus Images Based On The Noise Map Distribution. 19th European Signal Processing Conference (EUSIPCO), 2011.
