Improvements of programing methods for finding reference lines on X-ray images

Author: Al-Temimi Ammar Mudheher Sadeq, Pilidi Vladimir Stavrovich
Journal: Компьютерная оптика @computer-optics
Section: Обработка изображений, распознавание образов
Article in issue: 3 т.43, 2019.
Free access
The paper gives an overview of the algorithms developed to obtain reference lines and angles on X-ray images. These geometrical characteristics are used in the medical analysis of human joints. We propose the algorithm’s modifications based on the analysis of numerous X-ray images. These modifications allowed obtaining a great increase in calculation speed and the improvement of final results quality given by the corresponding application. They also lead to a significant reduction of manual tuning of the program, arising only in the rare cases when the properties of given images differ significantly from the mean ones.
Reference lines and angles, canny edge detection algorithm, reference lines, image processing, x-ray images, pattern recognition
Short address: https://sciup.org/140246467
IDR: 140246467 | DOI: 10.18287/2412-6179-2019-43-3-397-401
Text of the scientific article Improvements of programing methods for finding reference lines on X-ray images
Computer methods of analyzing medical information attract the attention of numerous scientists, we mention here e.g. [1 –6].
Wide usage of X-ray methods for diagnostics is connected with their high quality, wide presence of corresponding equipment, comparative simplicity and cheapness of the investigation. Knee and elbow joints take an important place among these investigations.
In this paper, we give modifications of the boundary detection algorithm described in [7, 8] and make some essential improvements. The mentioned modifications are based in the thorough analysis of the X-ray images of the domains under consideration.
Areas of applications of X-ray diagnostic methods are constantly expanding. One of the relatively new approaches in diagnosis is the method of reference lines and angles [9– 12]. Based on the evaluations by the experts, it is used to analyze possible deviations in the human extremities. In the case of deviations, it permits to give numerical estimates and to obtain recommendations for planning reconstructive treatment.
The modifications described below can significantly improve results obtained by the applications created on their basis (speed of the work, quality of the obtained results). They essentially decrease the number of parameters needed for the manual tuning of the program and significantly decrease the number of cases when such tuning is necessary.
Main part
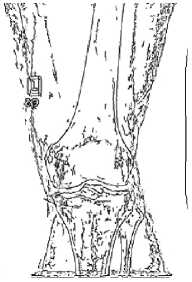
In order to identify and estimate the degree of deformities of the extremities, there are defined geometrical ob- jects, called anatomical and mechanical axes of long bones, anatomical and mechanical angles. Normally, these reference lines intersect each other at certain points and at certain angles. If these indicators are out of the accepted normal boundaries, the surgeon may draw corresponding conclusions.
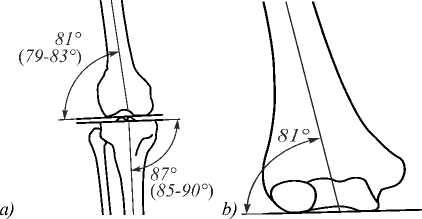
Fig. 1. Reference lines and angles, knee joint (a), elbow joint (b)
In the following, we describe briefly the scheme of the analysis used in the applications created by us for automatic obtaining of the characteristics mentioned above.
Next, we discuss the steps of the used algorithms and present some results on the modification of the proposed algorithms in order to increase the speed of their work and improve the quality of the obtained results. More exactly, we analyze the methods to increase the speed of image filtering and to optimize parameters for the Canny algorithm.
In the program [13] developed on the basis of the algorithms described in [7,8], the low-pass filter [14] was the first step. A simple filter averaging over a square mask was used. The size of the mask was determined after analysis of a large number of X-ray images. It turned out that the qual- ity of the obtained result depends essentially on a number of factors, particularly, the scale of the image.
On the next step, we use the Canny edge detector [15]. It should be noted that the use of a low-pass filter at the previous stage of processing significantly improves the quality of the results obtained at this stage. We would like to point out here that the usage of the filter is necessary to obtain a more accurate result. In the Fig. 2 it is shown that without the filter there was a loss of essential information.
a)
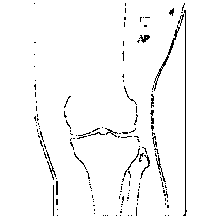
b)
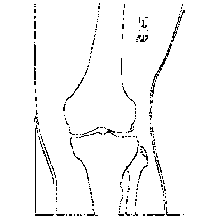
Fig. 2. Canny detection without the filter (a), Canny detection with the filter (b)
Then we use dilation operation [14] to eliminate gaps in the boundaries. After that, there is used the watershed segmentation algorithm [16]. Only large contours are the subject of the further consideration, so the small ones are eliminated by comparing their perimeters with the threshold value (this value was obtained experimentally and equals 200 pixels), it may be changed in the program settings.
For the remaining regions, the centers of the mass for all regions are calculated. These points are used as the markers for the segmentation algorithm at the next step (see Fig. 3).
We make a mask from the obtained areas, this mask quite accurately corresponds to the contours of the bones, such that the remained areas in the space that are not parts of the bones are not included.
a)
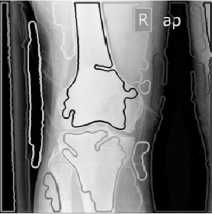
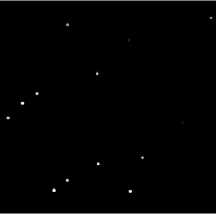
Fig. 3. Large contours when applying watershed algorithm (a), the centers of mass for all regions (b)
The segmentation algorithm for watersheds starts with the mask obtained in the previous step. For each of the areas received, it is determined whether it contains a point of interest [7, 8].
After applying the segmentation algorithm from the obtained areas, every region is labelled by the mark different from the others. Using these marks, we select one or two regions containing the points of interest. In the case of the knee there are two points because we analyze two bones, but in the case of the elbow, there is only one point.
The location of these points of interest may be changed in the program settings as well.
Then the Canny edge detector is applied again for the second time to analyze the joint area.
On the next step, the picture is improved using erosion, opening and dilatation morphological operations [14]. There are eliminated errors in the positions of the contours.
Thus, the contours of the femur and tibia or humerus permit us to obtain the reference lines and the angles of the knee or elbow joint.
a) b)

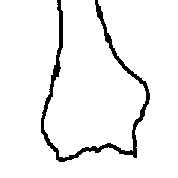
c)
Fig. 4. The contours of femur (a), tibia (b) and humerus (c)
In this work, we consider some modifications of the work mentioned above, the aim of the modifications is to obtain better quality, to decrease the number of tuning parameters of the program and to reduce essentially the need of correction of the remaining parameters.
The time of preliminary filtering using the standard approach is given in the Table 1 below.
Table 1. Runtime in milliseconds for averaging pixel intensities with the different size of the mask
|
Number of attempts |
Size of kernel |
Average runtime |
|
1 |
3×3 |
203 ms |
|
2 |
7×7 |
210 ms |
|
3 |
10×10 |
230 ms |
|
4 |
12×12 |
239 ms |
|
5 |
19×19 |
401 ms |
The first modification is connected with another method of preliminary filtering which improves the performance of the program.
We recall first the scheme of constructing the so-called integral image (summed-area table) [17– 19]. Denote by I ( x , y ) the intensity of the image at the point ( x , y ). We define the array of the same dimensions as the image itself by the following formula (1)
T ( x , y ) = ∑ I ( x ′ , y ′ ), (1)
where the summation is over all the values of the arguments satisfying conditions x ′ ≤ x , y ′ ≤ y . This auxiliary array permits to find the sum of the intensities in any rectangular image fragment using three addition-subtraction operations.
Suppose that we use k × k mask in the case of an m × n image. In the standard approach, we need k 2 mn additions and mn divisions.
Calculation using the integral tables method needs mn preliminary additions, 3 mn additions-subtractions and the same number of divisions as in the previous approach. This approach needs only 4 mn additions-subtractions and needs essentially fewer operations because the value k =7 is the most appropriate for the overwhelming majority of images.
Another advantage of this approach consists in the even greater reduction of the number of calculations in the case of changing the mask size by the user because the integral tables do not need to be recalculated.
The execution time of averaging the pixel intensities using the integral image is approximately 78 milliseconds and does not depend on the size of the filter kernel. The time is 2–5 times less than in the previous method (see Table 1).
Another implemented modification is the method for finding the threshold values of the Canny edge detector. This algorithm needs two different thresholds (for detecting the so-called strong and weak edges). The quality of its output depends significantly on these values. As we mentioned above, the Canny edge detector is to be used twice, and here we speak about the first (global) step.
We found that these thresholds should vary from one image to another, being dependent on the properties of the image. If we use some constant values for these thresholds or leave their choice to the user, it can lead to deterioration in the quality of the obtained results or the significant increase in the runtime.
In a number of papers there were proposed various, often rather complicated methods for determining these thresholds (see, e.g. [20]).
Our experiments show that for the current type of the images, it is possible to find these thresholds automatically, using only the statistical characteristics of the image. This significantly improves the quality of boundary detection.
To speed up the program in the case of sufficient uniformity of the analyzed images, an attempt was made to find an easy way to detect these boundaries. It was suggested that these thresholds can be given in the form M ± k σ , where M is the average value of the filtered image, σ is the corresponding standard deviation, K is the coefficient found from the results of the experiments. After series of experiments, it was found that the best results for images of the class under consideration are obtained with the values K ranging from 0.18 to 0.25.
The value M is obtained directly from the integral table because this table contains the sum of all intensities. The standa rd devi ation is found by the formula σ= M 2 - M 2 where M 2 is the average value of the squares of intensities. The method of integral table permits to optimize calculation of the value M 2 . The intensities take integer values from 0 to 255. In the process of building the integral image, there is counted the numbers of each value. If the value t (1 ≤ t ≤ 255) appears k t times then
M 2 = 1 ∑ k t t 2 , mn t = 1
where m, n are the sizes of the image under consideration.
The following table contains results of the experiments with two different approaches for finding thresholds of Canny detection. There was taken the value k =0.25.
The experiments show that the new method gives essentially different values of the thresholds and there are obtained much better results than in the case of fixed thresholds.
The results were compared visually. There was also compared the number of pixels obtained after the work of the old method and the new one. The experiments show that the important details were not damaged in the both cases under consideration, but in the new method the pixels representing the boundary of the contours are more accurate and the number of unnecessary details radically decreases (see Fig. 5).
a)
b)
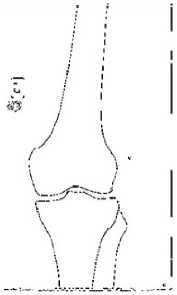
Fig. 5. Results of the Canny detector using the default thresholds (a), and the adaptive thresholds (b)
We found that during the second usage of the Canny algorithm local analysis necessary for the thorough identification of details in the joint areas permits to obtain satisfactory results with the constant values of the thresholds which were obtained after experiments. The possibility to apply universal thresholds, in this case, can be explained by the substantially greater homogeneity of the fragments analyzed at this stage.
Table 2. The result of implementation for finding the threshold values of Canny algorithm k = 0.25
|
Image number |
Number of pixels (old method) |
Min. auto threshold |
Max. auto threshold |
Number of pixels (new method) |
|
1 |
10437 |
1 |
40 |
6652 |
|
2 |
8192 |
1 |
30 |
6983 |
|
3 |
9946 |
1 |
39 |
5855 |
|
4 |
10443 |
10 |
47 |
4530 |
|
5 |
11041 |
2 |
49 |
4774 |
|
6 |
13040 |
6 |
49 |
6558 |
|
7 |
9362 |
3 |
53 |
4861 |
|
8 |
9793 |
3 |
50 |
5342 |
|
9 |
22237 |
12 |
39 |
9525 |
|
10 |
12506 |
4 |
43 |
7900 |
|
11 |
9578 |
15 |
50 |
6815 |
|
12 |
10360 |
1 |
36 |
7583 |
|
13 |
10051 |
2 |
38 |
7407 |
|
14 |
9052 |
4 |
38 |
5323 |
|
15 |
9301 |
5 |
34 |
6683 |
|
16 |
9379 |
1 |
41 |
5361 |
|
17 |
8089 |
1 |
35 |
6519 |
|
18 |
14724 |
1 |
34 |
8963 |
|
19 |
8499 |
5 |
50 |
3921 |
|
20 |
11820 |
1 |
40 |
6327 |
The scheme of the algorithm is given in the Fig. 6.
Implementation
Program based on the scheme of analysis described above was implemented in the Imam Ali General Hospital in the city of Baghdad. It used the images obtained from three X-ray devices having slightly different characteristics. It analyzed X-ray images obtained from 30 patients.
The program was used without manual tuning, the obtained results were 100 % successful. It turned out that the program permits to find abnormalities in the cases when they were not seen by the visual analysis.
We mention that for the application using the algorithm from [7] there were found several X-ray images analysis of which needed manual tuning. The application following the algorithm described above was able to process these images without such tuning.
Conclusion
The proposed methods for optimizing the algorithm based on the numerous experiments, significantly improve the quality and reliability of the obtained results.
The processing time of the program is less than half a second, which is sufficient for a comfortable use.
The testing results of the application based on this algorithm show that the analysis of the X-ray image gives essential information about the state of the analyzed region and permits in some cases to find abnormalities in the human joints that the specialist is unable to find by the visual analysis.
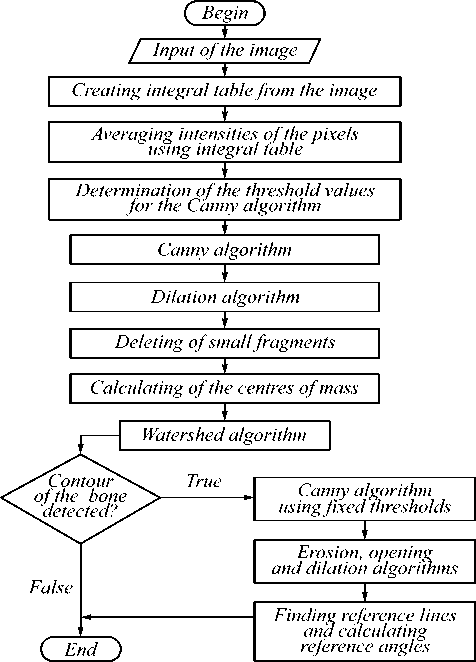
Fig. 6. Scheme of the algorithm
The algorithm developed in this paper can be applied for analysis of X-ray images in similar cases.
References Improvements of programing methods for finding reference lines on X-ray images
- Ильясова, Н.Ю. Исследование свойств внутриглазного инородного тела на основе анализа рентгенографических изображений черепа / Н.Ю. Ильясова, А.В. Куприянов, А.В. Устинов // Компьютерная оптика. - 2011. - Т. 35, № 2. - С. 268-274.
- Бабаев, М.В. Метод детектирования объектов и выделения границ для рентгенографических медицинских изображений / М.В. Бабаев, В.С. Пилиди, Н.А. Чернухин // Вестник компьютерных и информационных технологий. - 2012. - Т. 8. - C. 41-45.
- Samuvel, B. A mask based segmentation algorithm for automatic measurement of Cobb angle from scoliosis x-ray image / B. Samuvel, V. Thomas, M.G. Mini, J.R. Kumar // Proceedings of the International Conference on Advances in Computing and Communications (ICACC '12). - 2012. - P. 110-113.
- Гайдель, А.В. Исследование текстурных признаков для диагностики заболеваний костной ткани по рентгеновским изображениям / А.В. Гайдель, С.С. Первушкин // Компьютерная оптика. - 2013. - Т. 37, № 1. - С. 133-119.
- Anam, S. Texture analysis and modified level set method for automatic detection of bone boundaries in hand radiographs / S. Anam, E. Uchino, H. Misawa, N. Suetake // International Journal of Advanced Computer Science and Applications. - 2014. - Vol. 5, Issue 10. - P. 119-126.
- Shivanand, S.G. Detection of Osteoarthritis using Knee X-Ray image analyses: a machine vision based approach / S.G. Shivanand, U.P. Pooja, R.M. Ramesh // International Journal of Computer Applications. - 2016. - Vol. 145, Issue 1. - P. 20-26.
- Аль Темими, А.М.С. Автоматизация процесса определения референтных линий на рентгенографических медицинских изображениях [Электронный ресурс] / А.М.С. Аль Темими, В.С. Пилидии // Инженерный вестник Дона. - 2017. - Т. 1. - URL: ivdon.ru/ru/magazine/archive/n1y2017/4007.
- Аль Темими, А.М.С. Об одном алгоритме анализа структуры рентгенографических медицинских изображений / А.М.С. Аль Темими, В.С. Пилиди // Известия высших учебных заведений. Северо-Кавказский регион. Серия: Технические науки. - 2018. - Т. 1(197). - С. 23-28.
- Соломин, Л.Н. Анализ показателей референтных линий и углов при изменении формы ног с использованием чрескостного остеосинтеза / Л.Н. Соломин, П.Н. Кулеш // Травматология и ортопедия России. - 2011. - Т. 2(60). - С. 62-69.
- Соломин, Л.Н. Определение референтных линий и углов длинных трубчатых костей: пособие для врачей / Л.Н. Соломин, Е.А. Щепкина // СПб.: РНИИТО им. Р.Р. Вредена, 2010. - C. 21.
- Соломин, Л.Н. Основы чрескостного остеосинтеза аппаратом Г.А. Илизарова / Л.Н. Соломин // СПб.: МОРСАР АВ, 2005. - 544 с.
- Paley, D. Principles of deformity correction / D. Paley // N.Y: Springer-Verlag, 2005. - 806 p.
- Аль Темими, А.М.С. Система анализа рентгенографических изображений коленного сустава / А.М.С. Аль Темими // Свидетельство о государственной регистрации программы для ЭВМ № 2018610378. Дата государственной регистрации в Реестре программ для ЭВМ 10 января 2018.
- Gonzalez, R. Digital image processing / R. Gonzalez, R. Woods // Upper Saddle River, NJ: Prentice-Hall, Inc., 2005. - 1072 p.
- Canny, J.F. A computational approach to edge detection / J.F. Canny // IEEE Transactions on Pattern Analysis and Machine Intelligence. - 1986. - Vol. PAMI-8, Issue 6. - P. 679-698.
- Meyer, F. Color image segmentation / F. Meyer // International Conference on Image Processing and its Applications. Maastricht, The Netherlands. - 1992. - P. 303-306.
- Suhas, S. An efficient MRI noise removal technique using linear and nonlinear filters / S. Suhas, C.R. Venugopal // International Journal of Computer Applications. - 2018. - Vol. 179, Issue 15. - P. 17-20.
- Crow, F.C. Summed-area tables for texture mapping / F.C. Crow // Computer Graphics. - 1984. - Vol. 18, Issue 3. - P. 207-212.
- Viola, P. Rapid object detection using a boosted cascade of simple features / P. Viola, M. Jones // Proceedings of the IEEE Computer Society Conference on Computer Vision and Pattern Recognition. - 2001. - P. 511-518.
- Liu, T.-S. Improved Canny algorithm for edge detection of core image / T.-S. Liu, R.-X. Liu, Ping-Zeng, S.-W. Pan // The Open Automation and Control Systems Journal. - 2014. - Vol. 6. - P. 426-432.
