Index evaluation of informational sphere development in the Republic of Crimea

Author: Polishchuk Elena A., Pavlenko Irina G., Ostovskaya Anastasiya A., Trilitskaya Oksana Yu.
Journal: Региональная экономика. Юг России @re-volsu
Section: Условия, ресурсы, факторы и механизмы развития Юга России
Article in issue: 1 т.10, 2022.
Free access
The article focuses on the approach to index evaluation methodology measuring informational sphere development of a federal entityof the Russian Federation using as the example the Republic of Crimea. The key stages of the suggested technique include the calculation of the scale of the differences as per the regional index of the informational sphere development in the selected microregions as well as the specificity of their development (central, southern, northern, western and eastern) microregions; classification of the microregions of the republic with regard to average regional development index of informational sphere. Thus, the microregions were classified into three basic types: areas with highly developed (central and eastern) information sphere; moderately developed (western and southern) areas; areas with poorly developed (northern) informational sphere. During the research it was revealed that the methodology of index evaluation of the information sphere development allows designing scenarios of digital economy and information sphere development while taking into consideration the changes in social and economic environment in the region. The advantages ofmethodology are as follows: 1) few statistical data and information accessibility; 2) simple calculations of average values of the indices and of the development index of regional informational sphere; 3) simplicity of result interpretation. The suggested classification can be recommended for the development of programs of digital economy and informational sphere development not onlyfor the Republic of Crimea, but also other federal entities of the Russian Federation for an efficient use of a set of key measures.
Informational sphere, republic of crimea, methodologyof index evaluation, social and economic zoning, incentive index, leading microregion, outsider microregion, development index of regional informational sphere
Short address: https://sciup.org/149140111
IDR: 149140111 | UDC: 332.1(292.471):004
Индикаторная оценка уровня развития информационной сферы Республики Крым
В статье поднимается вопрос разработки методики индикаторной оценки уровня развития информационной сферы (инфосферы) отдельного субъекта Российской Федерации (на примере Республики Крым). К базовым стадиям разработанной методики можно отнести: выявление охвата расхождений в региональном индексе формирования инфосферы между выделенными микрорегионами (Центральный, Южный, Северный, Западный, Восточный), а также спецификой их развития; осуществление типологии рассматриваемых микрорегионов в целом по Республике Крым с учетом средней величины регионального индекса развития инфосферы. В результате осуществления типологии микрорегионов выделено три базовых типа территорий: территория с высоким уровнем развития инфосферы (Центральный и Восточный микрорегионы); территория со средним уровнем развития инфосферы (Западный и Южный микрорегионы); территория с низким уровнем развития инфосферы (Северный микрорегион). В процессе исследования установлено, что применение разработанной методики индикаторной оценки уровня развития инфосферы (к преимуществам которой следует отнести, прежде всего, использование оптимального объема метаданных и их открытую доступность, простоту вычисления средних значений выделенных индикаторов и регионального индекса развития информационной сферы, несложность интерпретации полученных результатов исследования) даст возможность спрогнозировать ключевые варианты развития цифровой экономики и инфосферы с учетом изменяющейся социально-экономической конъюнктуры региона. При этом предложенную типологию рекомендовано принимать во внимание при формировании программ (концепций) развития цифровой экономики и инфосферы не только для анализируемого региона, но и для других субъектов Российской Федерации в целях рационального исполнения основных программных действий.
Text of the scientific article Index evaluation of informational sphere development in the Republic of Crimea
DOI:
The digital economy and infosphere act as important elements of the intensive sustainable and balanced socio-economic development of the whole country as well as its subjects. They create new opportunities for the citizens which result in getting more government services, greater transparency and accessibility of the information processes, red tape reduction and favourable environment for living.
The relevance of the digitalization tendencies in all the spheres of social life defines the need for the study of the state and development of the infosphere in different subjects of the Russian Federation. Therefore, there is a demand for the index evaluation of the infosphere development in separate regions (based on the example of the Republic of Crimea in the current research) and their further classification, which will allow setting the goals for the infosphere development in order to implement the complex of key measures by justifying the targeted recommendations.
Background
Currently, in the Russian and foreign scientific community there is a growing interest in the digitalization and infosphere developments in different countries as well as their subjects.
For instance, a research team from School of Mathematics of South China University of Technology analysed the level of the digital economy development in Guangdong Province classifying it into four basic types: basic digital type, type of digital technology, type of digital integration and type of digital service. The applied method was entropy for modelling decision-making in the digital economy which allowed finding potentially productive trajectories of its development [Deng, Liu, Xiong, 2020].
On the other hand, researchers from Tomsk State University of Control Systems and Radioelectronics developed a model of the integrated index showing the development level of the digital economy in separate countries and regions. The methodology was tested by the developers with regard for the differential level of the digital economy development in certain subjects of the Russian Federation, and its results were compared to the results obtained by a group of research teams in European countries [Sidorov, Senchenko, 2020].
Scholars A. Nurdany and A.M. Kresnowati studied the types of economic activity subject to active digital processes that directly influence the economy of the region. They also measured the multiplicative effect of the key types of the economic activity that have an impact on production of goods, work and service, income and employment of the population. Their another contribution was calculating the economic effect from the investments into the key types of the economic activity that influences the development of the information technologies and infosphere on the regional level [Nurdany, Kresnowati, 2019].
The University of South China presented a research which contained a description of the effects that digitalization processes have on the development of the rural territories in China [Zhao et al., 2019].
A group of authors from Volgograd State Agricultural University proposed a plan of the digital economy development in the agricultural segment of Volgograd oblast. They also presented an algorithm of the infosphere formation in the agro-based clusters of Volgograd oblast [Panov et al., 2019].
W. Yuetao from Xi’an International University assessed the influence digitalization has on the sustainable development of the regional economy taking into account the active spread of the information and communication technologies [Yuetao, 2020].
O. Zaborovskaia, O. Nadezhina, E. Avduevskaya analysed the impact of the digitalization factors on the human capital in the regions of the Russian Federation. They came to the conclusion that formation and development of human capital in the regions, first of all, requires active development of digital infrastructure and reduction of digital inequality [Zaborovskaia, Nadezhina, Avduevskaya, 2020].
Furthermore, certain Russian researchers and research teams described scientific approaches to governing the regional potential of the digital economy formation and development [Kail, Epinina, Lamzin, 2018] and methodological approaches to the evaluation of the digitalization development in the regions and classified the subjects and okrugs (districts) of the Russian Federation according to the level of digitalization, studied the Digital Economy index construction [Vinogradov, 2021; Batrakova, 2019] and the regional disproportion in the digital economy development in Volga Federal District [Konyaeva, 2019]. The digitalization was considered as a factor of the socio-economic integration of the multicultural regions in the South of Russia [Ermishina, Klimenko, Budaev, 2020]. The research also focused on assessing the digital aspect of the quality of life in separate regions of the Russian Federation [Litvintseva et al., 2019].
Hence, the current research in Russia dedicated to the features of the infosphere development does not give the whole picture of its inherent characteristics in the context of the ongoing transformation processes in the real sector of the Russian Federation and its separate subjects taking into account their differentiation.
Results
In this research the forecasting of the infosphere development in the Republic of Crimea is based on the method of index evaluation at the core of which there lies the principle of socio-economic zoning that divides the territory of the Republic into 5 major microregions (Fig. 1).
The key stages of the methodology of the infosphere development index evaluation include:
-
1 . Defining the scale of differences as per the regional infosphere development index ( Iis ) between the microregions whose component indices are:
-
– households with PCs and Internet access;
-
– population using the Internet for the purpose of online shopping for popular goods and services;
-
– population using the Internet in order to get government and municipal services;
-
– organizations using the Internet for commercial purposes;
-
– households with no need for the Internet;
-
– households that lack technical capability to get access to the Internet;
-
– population with no need to use the Internet for ordering goods and services online;
-
– population that refuses to get government and municipal services through the Internet.
-
2 . Classification of the microregions in the Republic of Crimea taking into account the analysed regional infosphere development index and the features of the microregions’ development.
At the first stage, the microregions were divided into two major groups: the leading group (leaders)
Economic microregions of the Republic of Crimea
Central microregion
Northern microregion
Eastern microregion
Municipality:
Simferopol
Municipal districts: Bakhchysarai district, Belogorsk district, Krasnogvardeysk district, Simferopol district
Municipality:
Armyansk, Dzhankoy, Krasnoperekopsk
Municipal districts: Dzhankoy district, Krasnoperekopsk district, Pervomaysk district, Razdol’noe district
Municipality:
Kerch, Sudak, Feodosia
Municipal districts:
Kirovskoe district, Lenino district, Nizhnegorskiy district, Sovetskiy district
Southern microregion
_______I_______
Municipality:
Alushta, Yalta
Western microregion
_______I___________
Municipality:
Yevpatoria, Saki
Municipal districts:
Saki district, Chernomorskoe district
Fig. 1. The structure of the microregions in the Republic of Crimea
Note. Drawn by the authors based on: [The Law of the Republic of Crimea ... , 2017].
and the falling-behind group (outsiders). Such division was based on classifying the indices into:
– incentive indices (households with PCs and Internet access; population using the Internet for the purpose of online shopping for popular goods and services; population using the Internet in order to get government and municipal services; organizations using the Internet for commercial purposes) contributing to the digital development;
– disincentive indices (households with no need for the Internet; households that lack technical capability to get access to the Internet; population with no need to use the Internet for ordering goods and services online; population that refuses to get government and municipal services through the Internet) limiting the digital development.
The calculation of the above index groups is carried out according to the formulae below [Kizina, 2013; Kuznetsova, 2016.]:
– incentive indices:
Z i
X -X i min
-x„ max min
where Zi is the normalized value of i -index; Xi is the real value of i -index; X min is the minimum value of i-index; X max is the maximum value of i -index.
– disincentive indices:
Z = i
X max - X i
X -X ■ max min
The calculation of the average value of the regional infosphere development index ( Iis ) is carried out as per the region according to the following formula:
1 m
I- = — ^ Z ., is m i =1 i
where Iis is the average value of the regional infospehere development index; m is the number of index components constituting the infosphere development index; Zi is the normalized value of i -index.
Table 1 presents the information on the leading and outsider microregions based on the calculation of the normalized value of the index “households with PCs and Internet access” in 2019 (a new stage after signing the Information Society Development Strategy in the Russian Federation in 2017–2030 [The Decree of President ... , 2017] and the national programme “The Digital Economy of the Russian Federation”) [Passport of the national project ... , 2019]) next to the 2016 data (before the active implementation of the regional digital initiatives).
Table 1
The normalized value of the index “households with PCs and Internet access” as per economic microregions in 2019 in comparison with 2016
|
Years |
2019 as to 2016, +/- |
||||||
|
2016 |
2019 |
||||||
|
Position |
Microregion |
Index value |
Position |
Microregion |
Index value |
Microregion |
Index value |
|
1 |
Central |
0,67 |
1 |
Central |
0,74 |
Central |
0,07 |
|
5 |
Northern |
0,56 |
5 |
Northern |
0,61 |
Northern |
0,05 |
|
2 |
Eastern |
0,61 |
2 |
Eastern |
0,65 |
Eastern |
0,04 |
|
4 |
Western |
0,59 |
4 |
Western |
0,63 |
Western |
0,04 |
|
3 |
Southern |
0,60 |
3 |
Southern |
0,64 |
Southern |
0,04 |
Note. Drawn according to: [Statistical yearbook ... , 2017; Statistical yearbook ... , 2020].
The analysis of the average normalized value of the evaluated index in the respective period allowed to draw a conclusion that in terms of households with PCs and Internet access the central microregion of Crimea took the leading position at 0,71, the municipality of Simferopol and Simferopol district showing the highest index value.
On the other hand, the outsider was the northern microregion standing at 0.59, with the lowest index values for Armyansk as 30% of its population is comprised of people of unemployable age who have no PCs or access to the Internet.
Table 2 provides information about the leaders and outsiders based on the calculation of the normalized value of the index “population using the Internet for the purpose of online shopping for popular goods and services” in 2019 in comparison with 2016.
According to the data in Table 2, the central microregion of Crimea is in the lead as per the population using the Internet for the purpose of online shopping for popular goods and services as its share unchangingly remains at 25% with the highest value in the municipality of Simferopol (52%) and Simferopol district.
A comparatively high concentration of the population using the Internet for the purpose of online shopping for popular goods and services within the boundaries of the respective microregion is explained by a significant number of young people (40%) and middle-aged people, females in particular (37%) that constitute the majority of the buying force in the Internet as well as by the fact that in the area there are enough pickup locations and conveniently located parcel terminals.
In 2019, the eastern microregion was in the second position as to the population using the Internet for the purpose of buying popular goods and services online (it was in the third position in 2016); on average, its share in the estimated periods amounted to 20 %, municipalities of Kerch and Feodosia being the leaders with 30% and 24% respectively.
The third and the fourth positions in the 2019 rating were taken by the southern microregion at 19,3% (the second position in 2016) and the western microregion standing at 18%, the leading municipalities being Yalta (51%), Yevpatoria (48%), Alushta (43%) and Saki (38%).
The outsiders with the lowest number of population using the Internet for the purpose of online shopping was the northern microregion with 16 %, with more favourable environment in its municipalities – Dzhankoy
Table 2
The normalized value of the “population using the Internet for the purpose of online shopping for popular goods and services” index in 2019 compared to 2016
|
Years |
2019 as to 2016, +/ - |
||||||
|
2016 |
2019 |
||||||
|
Position |
Microregion |
Index value |
Position |
Microregion |
Index value |
Microregion |
Index value |
|
1 |
Central |
0,14 |
1 |
Central |
0,20 |
Central |
0,06 |
|
5 |
Northern |
0,09 |
5 |
Northern |
0,13 |
Northern |
0,04 |
|
3 |
Eastern |
0,11 |
2 |
Eastern |
0,17 |
Eastern |
0,06 |
|
4 |
Western |
0,10 |
4 |
Western |
0,15 |
Western |
0,05 |
|
2 |
Southern |
0,12 |
3 |
Southern |
0,16 |
Southern |
0,04 |
Note. Drawn according to: [Statistical yearbook ... , 2017; Statistical yearbook ... , 2020].
(57%), Armyansk (55%) and Krasnoperekopsk (54%). First of all, this results from the predominantly rural areas in the microregion and lack of stability in the speed of the Internet due to the remoteness of the mobile phone towers which hinders online order processing; secondly, the pickup locations are far away and mostly concentrated in the municipalities and municipal districts of the respective microregion.
Table 3 reveals the findings as to the index value of the population using the Internet in order to get government and municipal services in the leading and outsider microregions in 2019 and 2016.
As it may be concluded from the data in Table 3, the central microregion of Crimea was in the lead as per the population using the Internet in order to get government and municipal services, its share amounting to 27,3% in the estimated periods and its leading agglomerations being Simferopol municipality (52%) and Simferopol district. It is primarily connected to the fact that the majority of the residents in this microregion are registered on the government services portal (gosuslugi) and actively use their accounts to get services.
The central microregion was followed by the eastern microregion as per the above index with the average share of 22%, its leading agglomerations being the municipalities of Kerch (40%) and Feodosia (33%).
In this rating, the southern and the western microregions were the third and the forth standing at 19,3% and 17,1% respectively with the highest index values in Yalta (30%), Yevpatoria (28%), Alushta (27%) and Saki (24%).
As per the index of the population using the Internet in order to get government and municipal services, the northern microregion became the outsider with 14,5% and the highest values in the municipalities of Dzhankoy (22%), Armyansk (20%) and Krasnoperekopsk (19%). This is mainly explained by few registrations on the government service portal among the rural population that largely prefer getting the services in a traditional way, face to face.
The information in Table 4 concerns the leading and outsider microregions showing different statistics as per the index of the organizations using the Internet for commercial purposes in 2019 in comparison with 2016.
The data from the table above show that in 2019 the southern microregion of Crimea had the biggest share (22,4%) as per the number of organizations using the Internet for commercial purposes and, thus, was the leader with the highest values in the
Table 3
The normalized value of the “population using the Internet in order to get government and municipal services” index in the economic microregions in 2019 compared to 2016
|
Years |
2019 as to 2016, +/- |
||||||
|
2016 |
2019 |
||||||
|
Position |
Microregion |
Index value |
Position |
Microregion |
Index value |
Microregion |
Index value |
|
1 |
Central |
0,09 |
1 |
Central |
0,24 |
Central |
0,15 |
|
5 |
Northern |
0,04 |
5 |
Northern |
0,15 |
Northern |
0,11 |
|
2 |
Eastern |
0,07 |
2 |
Eastern |
0,20 |
Eastern |
0,13 |
|
4 |
Western |
0,05 |
4 |
Western |
0,17 |
Western |
0,12 |
|
3 |
Southern |
0,06 |
3 |
Southern |
0,18 |
Southern |
0,12 |
Note. Drawn according to: [Statistical yearbook ... , 2017; Statistical yearbook ... , 2020].
Table 4
The normalized value of the “organizations using the Internet for commercial purposes” index as per each economic microregion in 2019 as compared to 2016
|
Years |
2019 as to 2016, +/- |
||||||
|
2016 |
2019 |
||||||
|
Position |
Microregion |
Index value |
Position |
Microregion |
Index value |
Microregion |
Index value |
|
1 |
Central |
0,69 |
2 |
Central |
0,66 |
Central |
-0,03 |
|
5 |
Northern |
0,53 |
5 |
Northern |
0,51 |
Northern |
-0,02 |
|
3 |
Eastern |
0,64 |
3 |
Eastern |
0,63 |
Eastern |
-0,01 |
|
4 |
Western |
0,55 |
4 |
Western |
0,53 |
Western |
-0,02 |
|
2 |
Southern |
0,65 |
1 |
Southern |
0,67 |
Southern |
0,02 |
Note. Drawn according to: [Statistical yearbook ... , 2017; Statistical yearbook ... , 2020].
municipalities of Yalta (53%) and Alushta (50%) whereas in 2016 it was in the second position. The statistics can be explained by the highly developed tourism and hospitality industry in the microregion. The companies that are concentrated in the area use efficient websites to create more attractive image and lure potential consumers (customers, guests), which is meant to increase their profitability.
The second in the 2019 rating as per the number of organizations using the Internet for commercial purposes was the central microregion with 22% (it was in the leading position in 2016), the municipality of Simferopol (55%) and Simferopol district showing the highest index values.
In the respective years, the third and the fourth positions in the rating were occupied by the eastern (21%) and western (17,8%) microregions with the highest index values in the municipalities of Feodosia (53%), Yevpatoria (52%), Kerch (48%) and Saki (44%).
The outsider microregion as per the number of organizations using the Internet for commercial purposes in the years under consideration was the northern microregion whose share amounted to 17%. It should be noted that the majority of the organizations in the area, including small business, are engaged in the agricultural sector and have neither presence in the Internet, nor their own websites.
The normalized value of the index “households with no need for the Internet” has been calculated to find out the leading and the outsider microregions in 2019 and 2016 and is presented in Table 5.
Table 5 shows that in the respective years the outsider as per the corresponding index was the northern microregion as the number of the households with no need for the Internet in the area exceeded those in the other microregions under consideration. The reason for this is that in the area there is a concentration of underpopulated villages and settlements with a big share of the population of the unemployable age (55%). The majority of this age category do not use the Internet due to the lack of necessity (lack of desire or interest); other reasons include lack of Internet skills and considerable (for the majority of the population) expenses related to the Internet connection.
In this case the leading microregion is the one with the minimum index value compared to the others where households have no need for the Internet, i.e. the central microregion (its index value in 2019 amounted to 0,72).
Despite the fact that the eastern and the southern microregions fell behind the central one, in 2019 their index values reduced considerably in comparison with the leader (by 0,04) as per the number of households with no need for the Internet.
Table 6 contains the data related to the leading and outsider microregions based on the calculation of the normalized value of the index “households that lack technical capability to get access to the Internet” in 2019 as compared to 2016.
It is evident from the data in Table 6 that the outsiders were different in 2019 and 2016 as the northern microregion went up to the second to last position (in 2019 its index value went down by 0,03); on the contrary, the western microregion went down by one position and became the outsider (in 2019 the index value only reduced by 0,01). The situation results from the fact that most households in the respective microregions do not have landline; hence, it is impossible to get connected to the Internet through ADSL. Some owners of 3G modems complain about the poor quality of the connection (e.g. their antivirus database does not update, etc.).
The leading position as per the index is invariably held by the central microregion (in 2019 the respective index amounted to 0,04).
The normalized index value as per the leading and outsider regions with the population with no need to use the Internet for ordering goods and services online in 2019 and 2016 is reflected in Table 7.
Table 5
The normalized value of the “households with no need for the Internet” index in the economic microregions in 2019 as compared to 2016
|
Years |
2019 as to 2016, +/- |
||||||
|
2019 |
|||||||
|
Position |
Microregion |
Index value |
Position |
Microregion |
Index value |
Microregion |
Index value |
|
5 |
Central |
0,74 |
5 |
Central |
0,72 |
Central |
0,02(+) |
|
1 |
Northern |
0,83 |
1 |
Northern |
0,80 |
Northern |
0,03(+) |
|
4 |
Eastern |
0,77 |
4 |
Eastern |
0,73 |
Eastern |
0,04(+) |
|
2 |
Western |
0,81 |
2 |
Western |
0,79 |
Western |
0,02(+) |
|
3 |
Southern |
0,80 |
3 |
Southern |
0,76 |
Southern |
0,04(+) |
Note. Drawn according to: [Statistical yearbook ... , 2017; Statistical yearbook ... , 2020].
Table 6
The normalized value of the “households that lack technical capability to get access to the Internet” index in the economic microregions in 2019 as compared to 2016
|
Years |
2019 as to 2016, +/- |
||||||
|
2019 |
|||||||
|
Position |
Microregion |
Index value |
Position |
Microregion |
Index value |
Microregion |
Index value |
|
4 |
Central |
0,06 |
4 |
Central |
0,04 |
Central |
0,02(+) |
|
1 |
Northern |
0,09 |
2 |
Northern |
0,06 |
Northern |
0,03(+) |
|
3 |
Eastern |
0,07 |
3 |
Eastern |
0,05 |
Eastern |
0,02(+) |
|
2 |
Western |
0,08 |
1 |
Western |
0,07 |
Western |
0,01(+) |
|
2 |
Southern |
0,08 |
2 |
Southern |
0,06 |
Southern |
0,02(+) |
Note. Drawn according to: [Statistical yearbook ... , 2017; Statistical yearbook ... , 2020].
Table 7
The normalized value of the “the population with no need to use the Internet for ordering goods and services online” index in the economic microregions in 2019 as compared to 2016
|
Years |
2019 as to 2016, +/ - |
||||||
|
2016 |
2019 |
||||||
|
Position |
Microregion |
Index value |
Position |
Microregion |
Index value |
Microregion |
Index value |
|
5 |
Central |
0,39 |
5 |
Central |
0,25 |
Central |
0,14(+) |
|
1 |
Northern |
0,46 |
1 |
Northern |
0,37 |
Northern |
0,09(+) |
|
4 |
Eastern |
0,42 |
3 |
Eastern |
0,29 |
Eastern |
0,13(+) |
|
2 |
Western |
0,45 |
2 |
Western |
0,32 |
Western |
0,13(+) |
|
3 |
Southern |
0,43 |
4 |
Southern |
0,28 |
Southern |
0,15(+) |
Note. Drawn according to: [Statistical yearbook ... , 2017; Statistical yearbook ... , 2020].
The analysis of the index allowed to conclude that the northern region was the outsider (in 2019 the index value amounted to 0,37) which results from the same background we gave account of in the commentary to Table 6.
The leader was the central microregion whose index value in 2019 was 0,25.
It is important to mention that in the observed years there was a shift in the position of the eastern microregion by 0,13 as it moved from the second position (0,42 in 2016) to the third one (0,29 in 2019) and, accordingly, the southern microregion shifted by 0,15 going from the third position (0,29 in 2016) to the second one (0,28 in 2019).
The data in Table 8 are related to the leading and outsider microregions and are based on the calculation of the normalized value of the index “population that refuses to get government and municipal services through the Internet” in 2019 in comparison with 2016.
According to the data in the table above, the outsider as per the respective index was the northern region (its index value in 2019 amounted to 0,76). Apparently, this is due to the fact that the majority of the population in this rural area do not have their accounts on the government services portal (gosuslugi) because of the poor quality of the Internet connection which does not allow them to finish the process of registration; on the other hand, the registered population of the unemployable age in the rural areas fail to use the portal effectively due to the lack of the necessary knowledge and skills.
The central microregion has the smallest number of the population that refuses to get government and municipal services through the Internet and is in the lead (in 2019 the index value amounted to 0,58).
The thorough and consistent completion of the first stage of the proposed methodology allows moving to the second stage and classifying (grouping) the microregions of the Republic of Crimea taking into account the average regional infosphere development index.
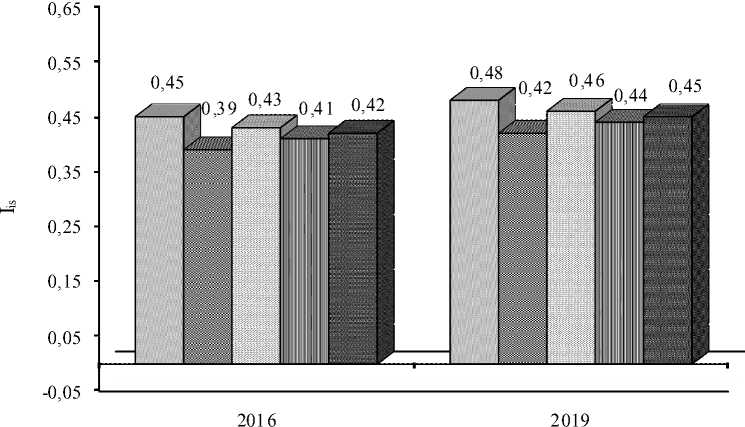
Figure 2 shows the final values of the average regional infosphere development index ( Iis ) in the years under consideration.
The analysis of the average value of the regional infosphere development index ( Iis ) resulted in singling out the following types (groups) of the territories within the boundaries of the Republic of Crimea:
Table 8
The normalized value of the “population that refuses to get government and municipal services through the Internet” index in the economic microregions in 2019 as compared to 2016
|
Years |
2019 as to 2016, +/ - |
||||||
|
2016 |
2019 |
||||||
|
Position |
Microregion |
Index value |
Position |
Microregion |
Index value |
Microregion |
Index value |
|
5 |
Central |
0,67 |
5 |
Central |
0,58 |
Central |
0,09(+) |
|
1 |
Northern |
0,81 |
1 |
Northern |
0,76 |
Northern |
0,05(+) |
|
4 |
Eastern |
0,72 |
4 |
Eastern |
0,64 |
Eastern |
0,08(+) |
|
2 |
Western |
0,78 |
2 |
Western |
0,72 |
Western |
0,06(+) |
|
3 |
Southern |
0,75 |
3 |
Southern |
0,69 |
Southern |
0,06(+) |
Note. Drawn according to: [Statistical yearbook ... , 2017; Statistical yearbook ... , 2020].
years
□ Central 0Northern □ Eastern НИ Western 0 Southern
Fig. 2. The average value of the regional infosphere development index (Iis)
Note. The calculation is done by the authors based on the data from tables 1–8.
– the first type: territories with well-developed infosphere which include the eastern microregion (municipalities of Kerch and Feodosia) at 0.46 and the central microregion (in particular, the municipality of Simferopol and Simferopol district) at 0,48;
– the second type: territories with moderately developed infosphere which include the western microregion (municipalities of Yevpatoria and Saki) at 0,44 and the southern microregion (in particular, municipalities of Yalta and Alushta) at 0,45;
– the third type: territories with underdeveloped infosphere which include the northern microregion (in particular, municipalities of Dzhankoy, Pervomaysk and Razdol’noe) at 0,42.
In fact, it is worth mentioning that in 2019 despite the overall insfosphere development, the
Republic of Crimea was still the subject of the Russian Federation which was considered underperforming and having low index values of the digital economy and infosphere development (< 0,5). Thus, further research in the field and elaboration of new methods in order to improve the governing system of the infosphere in the republic are relevant in the current conditions.
Conclusion
The carried out research provides enough evidence to prove that currently one of the urgent challenges is to develop an efficient methodology of the infosphere development index evaluation applicable at the level of the country as well as at the level of its separate subjects including the Republic of Crimea while taking into account the differentiation of the subjects. This approach allowed to classify (group) the microregions of the republic with regard for the average regional infosphere development index. The study showed that the proposed classification (grouping) can be recommended for the elaboration of the digital economy and infosphere development programmes in the Republic of Crimea as well as in the other subjects of the Russian Federation for the purpose of effective implementation of the complex of key measures based on targeted recommendations.
Therefore, we may conclude that the proposed methodology has a number of advantages such as 1) use of few statistical data and accessibility of the information; 2) simple calculation procedure of the average index values and regional infosphere development index; 3) simple mechanism of the result interpretation. Thus, it will be workable when modelling a variety of scenarios of the digital economy and infosphere development taking into account the changing socio-economic environment.
References Index evaluation of informational sphere development in the Republic of Crimea
- Batrakova L.G., 2019. Razvitie tsifrovoj ekonomiki v regionah Rossii [Development of Digital Economy in Russian Regions]. Socialno-politicheskie issledovaniya [Social and Political Research], no. 1, pp. 51-64. DOI: https://doi.org/10.24411/2658-428Х-2019-10338.
- Deng X., Liu Y., Xiong Y., 2020. Analysis on the Development of Digital Economy in Guangdong Province Based on Improved Entropy Method and Multivariate Statistical Analysis. Entropy, vol. 22, pp. 14-41. DOI: https://doi.org/10.3390/e22121441.
- Ermishina A.V., Klimenko L.V., Budaev P.E., 2020. Cifrovizatsiya kak faktor sotsyalno-ekonomicheskoj integratsii polikulturnykh regionov Yuga Rossii [Digitalization As a Factor in Socio-Economic Integration of Multicultural Regions in Southern Russia]. Regionalnaya ekonomika. Yug Rossii [Regional Economy. South of Russia], vol. 8, no. 4, pp. 114-124. DOI: https://doi.org/10.15688/re.volsu.2020.4.10.
- Kail I.I., Epinina V.S., Lamzin R.M., 2018. Upravlenie regionalnym potentsyalom v oblasti formirovaniya i razvitiya tsyfrovoj ekonomiki [Management of Regional Potential for Creation and Development of Digital Economy]. Gosudarstvennoe i munitsypalnoe upravlenie. Uchenye zapiski [State and Municipal Management. Scholar Notes], no. 3, pp. 39-46. DOI: https://doi.org/10.22394/2079-1690-2018-1-3-39-46.
- Kizina А.А., 2013. Metodika postroeniya integralnogo pokazatelya otsenki informatsyonnykh protsessov regionov Rossii [Methodology of Integral Parameter Construction for Evaluation of Informational Processes in the Regions of Russia]. Izvestiya Saratovskogo universiteta. Novaya seriya. Seriya: Ekonomika. Upravlenie. Pravo [Izvestiya of Saratov University. Economics, Management. Law], vol. 13, no. 4-2, pp. 667-673.
- Konyaeva T.V., 2019. Issledovanie regionalnykh disproportsyj v razvitii tsyfrovoj ekonomiki Privolzhskogo federalnogo okruga [Research of Regional Disproportions in the Development of the Digital Economy of the Volga Federal District]. Journal of Economy and Business, vol. 7, pp. 76-80. DOI: https://doi.org/10.24411/2411-0450-2019-11080.
- Kuznetsova O.V., 2016. Sistemnaya diagnostika ekonomiki regiona [Regional Economics System Diagnosting]. Moscow, “LENAND” Publ. 232 p.
- Litvintseva G.P., Shmakov A.V., Stukalenko E.A., Petrov S.P., 2019. Otsenka tsyfrovoj sostavlyayushchej kachestva zhizni naseleniya v regionakh Rossijskoj Federatsii [Digital Component of Peoples Quality of Life Assessment in the Regions of the Russian Federation]. Terra Economicus, vol. 17, no. 3, pp. 107-127. DOI: https://doi.org/10.23683/2073-6606-2019-17-3-107-127.
- Nurdany A., Kresnowati A.M., 2019. Digital-Related Economy Sectors and Region al Economy Disruption. Jurnal Ekonomi dan Bisnis, vol. 22, no. 1, pp. 147-162.
- Panov A., Panova N., Malofeev A., Nemkina E., 2019. Interaction of Regional Agribusiness Entities in the Transition to a Digital Economy. Earth and Environmental Science, vol. 403, pp. 1-7. DOI: https://doi.org/10.1088/1755-1315/403/1/012138.
- Pasport natsyonalnogo proekta Natsyonalnaya programma “Tsyfrovaya ekonomika Rossijskoj Federatsyi”: utv. prezidiumom Soveta pri Prezidente RF po strategicheskomu razvitiyu i natsyonalnym proektam ot 04.06.2019 g. № 7, 2019 [Passport of the National Project “The National Program of the Digital Economy in the Russian Federation”.
- Approved by the Executive Committee of the Presidents Council on the Strategical Development and National Projects No. 7 Dated June 4, 2019]. KonsultantPlyus. URL: http://www.consultant.ru/document/cons_doc_LAW_328854.
- Sidorov A., Senchenko P., 2020. Regional Digital Economy: Assessment of Development Levels. Mathematics, vol. 8, pp. 21-43. DOI: https://doi.org/10.3390/math8122143.
- Statisticheskij ezhegodnik Respubliki Krym, 2016: stat. sb., 2017 [Statistical Yearbook of the Republic of Crimea. 2016. Collection of Data]. Simferopol, “Krymstat” Publ. 243 p.
- Statisticheskij ezhegodnik Respubliki Krym. 2019: stat. sb., 2020 [Statistical Yearbook of the Republic of Crimea. 2019. Collection of Data]. Simferopol, “Krymstat” Publ. 414 p.
- Ukaz Prezidenta Rossijskoj Federatsyi ot 09.05.2017 g. № 203 «O Strategii razvitiya informatsyonnogo obshchestva v Rossijskoj Federatsyi na 2017–2030 gody», 2017 [The Decree of President of the Russian Federation No. 203 Dated May 9, 2017 “On the Strategy of the Information Society Development in the Russian Federation for 2017–2030”]. URL: http://www.kremlin.ru/acts/bank/41919.
- Vinogradov A.I., 2021. Metodicheskie podkhody k otsenke urovnya razvitiya protsessov tsyfrovizatsyi v regionakh [Methodological Approaches to Assessment of the Level of Development of Digitalization Processes in Regions]. Strategii biznesa [Business Strategies], vol. 9, no. 6, pp. 167-173. DOI: https://doi.org/10.17747/2311-7184-2021-6-167-173.
- Yuetao W., 2020. Research on Digital Economy Promoting High Quality Development of Regional Economy Under the Background of Internet. International Conference on E-Commerce and Internet Technology, pp. 225-227. DOI: https://doi.org/10.1109/ECIT50008.2020.00058.
- Zaborovskaia O., Nadezhina O., Avduevskaya E., 2020. The Impact of Digitalization on the Formation of Human Capital at the Regional Level. Journal of Open Innovation: Technology, Market, and Complexity, vol. 6, no. 184, pp. 1-24. https://doi.org/ DOI: https://doi.org/10.3390/joitmc6040184.
- Zakon Respubliki Krym ot 09.01.2017 g. № 352-ZRK/2017 «O strategii sotsyalno-ekonomicheskogo razvitiya Respubliki Krym do 2030 goda», 2017 [The Law of the Republic of Crimea No. 352-ЗРК/2017 Dated January 9, 2017 “On the Strategy of the Socio-Economic Development of the Republic of Crimea” URL: www.rk.gov.ru/rus/docs_republic.htm.
- Zhao Z., Jia Y., Danlei Z., Shiwei L., 2019. The Assistance of Digital Economy to the Revitalization of Rural China. Advances in Social Science, Education and Humanities Research, vol. 314, pp. 702-704.
