Indicator Automation with Power BI in the Innovation Sector of a Transformer Company

Author: Ana Julia Dal Forno, Letícia Marques Bauler, Selene de Souza Siqueira Soares, Marilise Luiza Martins dos Reis Sayão
Journal: International Journal of Information Engineering and Electronic Business @ijieeb
Article in issue: 4 vol.16, 2024.
Free access
The use of indicators is increasingly common, as they allow the visualization and analysis of useful data to assist in decision-making and planning. In this context, this article aimed to evaluate the process of automating indicators in the area of innovation in a multinational company located in Brazil, a transformer manufacturer. To this end, the themes of indicators and the application of Business Intelligence (BI) and process automation for project manager functions were conceptualized. The action research methodology developed automated indicators to facilitate decision-making and improve the productivity of the project team. These results also allowed for the improvement of visual and systemic management, by presenting all current projects and information on the occupancy rate of each team member, in addition to real-time control of whether goals are being achieved in the company. Thus, it was evident that centralizing data helps managers make more assertive decisions and the case reported can be replicated to other industrial sectors. In the academic sphere, the research also contributed to the evolution of the topic of project integration, automation and visual management of indicators using the Power BI tool.
Project management, KPI, Process automation, Visual Control, productivity
Short address: https://sciup.org/15019423
IDR: 15019423 | DOI: 10.5815/ijieeb.2024.04.02
Text of the scientific article Indicator Automation with Power BI in the Innovation Sector of a Transformer Company
Published Online on August 8, 2024 by MECS Press
Change processes are increasingly necessary to keep up with innovation. According to [1]data is what allows integration between the physical and cyber worlds and, with the advancement and presence of technology, the need for the industry to adhere to innovation initiatives was realized. According to [2], innovation is driven by the ability to establish relationships, detect opportunities and take advantage of them. With the advent of the fourth industrial revolution, the integration of intelligent machines in production and throughout the production chain is necessary. Thus, the importance of knowing how to manage projects so that they bring significant results to companies also arises, as it is not enough to execute, it is necessary to understand where to apply efforts and meet the scope requirements of time, quality and cost [3].
This work was motivated by the identification of some problems, which were also highlighted by [4], among them the lack of standardization of processes, the absence of indicators, information centered only on people, lack of sharing of project learning and the lack of a bank of lessons learned.
The PMO (Project Management Office) denotes the structure responsible for improving aspects of an organization in relation to projects, advising managers and teams to conduct them [5]Given the assigned functions, it is essential that the professional helps visualize what is being carried out, in addition to an overview of the sector, so that decisions can be made based on tangible data. Given this context, the general objective of this article was to automate indicators from the Research, Development and Innovation section of a transformer company located in Brazil, to assist in decision making, in addition to exposing real data on the team's performance and the evolution of projects. developed.
Business Intelligence (BI) tools, project management platforms and programming languages were analyzed in the process of choosing them for application in this work, analyzing the advantages and disadvantages of each one. As a choice, the Power BI software, developed by Microsoft, acts as a facilitator of the process of exposing useful data and was chosen for the development of this project. In essence, Power BI contemplates a system that uses artificial intelligence to process information from the integration of different data sources, in order to provide reliable indicators that are highly useful for business.
The motivation for this study derived from concerns of the company where the action research was developed. Currently, the organization is experiencing delays in more than 60% of projects, due to the lack of visualization of each member's occupation. Demands arrived and were allocated without strategic consideration, causing overload on the project team and an imbalance of tasks. Furthermore, before the work was developed, there was no indicator system to monitor the team's performance.
One of the originalities of the work is expanding the benefits of project management for the small, medium and large electrical transformer sector. Thus, the automation of these processes helps managers in making decisions, provides support to the Planning, Development and Innovation and Digital Products department. In the academic field, there is benchmarking regarding the indicators suggested to monitor improvements in real time in a visual way, including who the project members are, the status of the project itself, tasks completed on time and late, hours dedicated to the project, tasks priorities, impacts, risks and action plan for each project. These results reduce the gaps highlighted by [6] regarding innovation management barriers, including that almost half of leaders do not know what tools they need to enable creativity and innovation in companies, that is, related to the lack of structure.
The work is structured into six sections, in addition to this introduction. In section 2 we have a description of the methodology with the theoretical search for documents in databases and their analyses. In section 3 there are theoretical concepts about indicators and Power BI in the context of project management. Section 4 presents the steps of implemented action research, using theory as an experiment in practice. The section 5 presents the results of applying the system in the company and how to replicate it. Finally, section 6 concludes the work and suggests future work.
2. Methodology
The methodological procedure began with research carried out in the IEEE, Science Direct, Scopus, SciELO and other research repositories databases, carried out in November 2023. After reading the abstracts, the 20 most relevant articles were analyzed to assist in practical implementation. So, for action research, a team was formed made up of members responsible for project management, in which they evaluated the tools and then implemented the improvements described in Figure 1. Having clarity of the problem, the tools were defined based on the resources of the company, as well as skills already known and worked on, such as Python and database knowledge. The use of Power BI was studied and learned to be able to carry out this application.
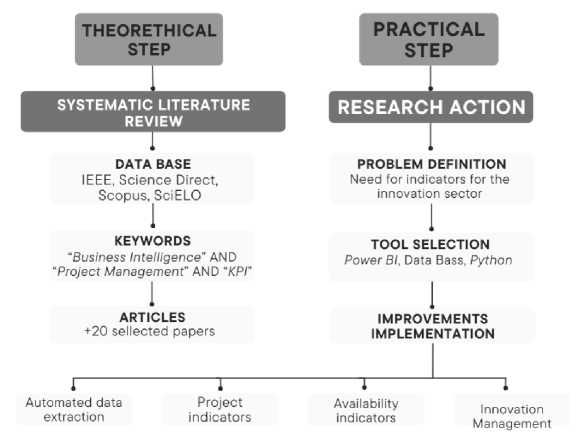
Fig. 1. Research steps
Action research requires action in both the areas of practice and research, so that, to a greater or lesser extent, it will have characteristics of both routine practice and scientific research [7]and the application is actually implemented at this stage, based on studies previously carried out in the theoretical review. The choice of tools also took the articles read as a source, as it was possible to choose the best resources based on their results and applications. When giving preference to some tools over others, the permissions and platforms of access allowed within the company were also analyzed, as authorizations can change in each workplace.
3. Theoretical Background
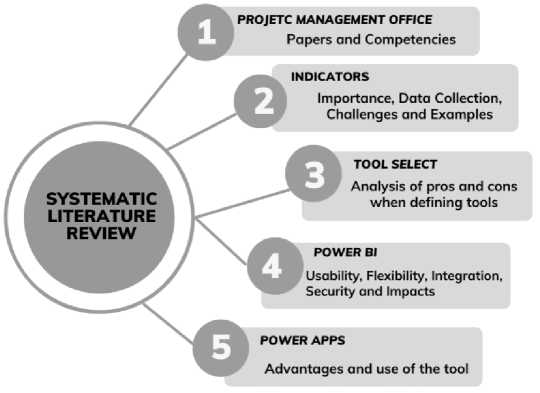
The topics covered are in Figure 2, with the focus being on indicators and Power BI.
SYSTEMATIC LITERATURE REVIEW
PROJETC MANAGEMENT OFFICE
Papers and Competencies
INDICATORS
Importance, Data Collection, Challenges and Examples
POWER Bl
Usability, Flexibility, Integration, Security and Impacts
POWER APPS
Advantages and use of the tool
TOOL SELECT
Analysis of pros and cons when defining tools
Fig. 2. Theoretical topics.
-
3.1 Indicators Performance
Indicators are fundamental tools for measuring and evaluating complex phenomena. As highlighted by [8] indicators are qualitative or quantitative representations that make it possible to capture specific information about reality, allowing the understanding and analysis of complex processes, phenomena or results in a more accessible way. In summary, indicators offer a simple and measurable view of variables or elements that would otherwise be difficult to interpret or compare, providing a solid basis for analysis and decision-making in the business environment. Figure 3 represents the hierarchy found in the world of data, so that at each level, we delve deeper into the possible approaches.
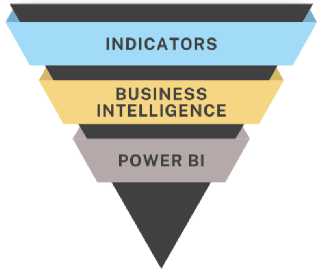
Fig. 3. Data hierarchy
Within the BI universe, these indicators play a crucial role, as they are the basis that feeds the analyzes and reports generated by its tools. As highlighted by[9] BI KPIs to translate raw data into valuable information, enabling a comprehensive and agile understanding of the business landscape. This integration between indicators and BI not only simplifies data interpretation, but also strengthens the ability of managers and analysts to identify patterns, trends and opportunities, resulting in more strategic decisions.
Indicators play a central role in strategic decision-making, serving as guides that guide managers and leaders in the right direction. These indicators, as highlighted by [10] provide a visual representation of an organization's performance in specific company aspects. By translating complex data into readable metrics, indicators offer a clear view of the current landscape, allowing the identification of trends, opportunities and potential problems. Furthermore, they also facilitate communication within the organization, allowing everyone to be aware of performance data, dedication and useful information from the analysis location.
Furthermore, indicators play a crucial role in identifying areas that need improvement and in intelligently allocating resources. By offering information about what is being analyzed, the use of indicators trains managers in data intelligence, that is, the professional adopts another view when reading an indicator, being able to predict impacts [11]. Therefore, they are indispensable tools for corporate management and for building an organizational culture driven by data and results.
Other data sources, as listed by[10] may include Excel spreadsheets, local data sources, big data, data flow and cloud services, SQL database, Google Analytics, Oracle, social networks, among others varied sources. He also states that BI is an effective tool, as it is very fast in transforming interactions between data into dynamic visualizations, highlighting this as the strong point of this tool. In this way, BI has various resources to be addressed within an application, in order to leave it up to the developer to choose which one best suit the desired use.
Selecting appropriate indicators is a challenging and essential process for any organization. One of the main obstacles is focused on defining indicators that truly reflect the strategic and operational objectives of a company or specific area. In this sense, as pointed out by[12], aligning indicators with the organization's vision, mission and goals is a constant challenge, as it depends on a deep understanding of all these organizational aspects.
Another obstacle is obtaining reliable and relevant data to feed these indicators. Often, the necessary information can be dispersed across different systems and departments, making data collection and integration difficult. As highlighted by [4] ensuring data quality and consistency is a significant challenge, as it directly affects the accuracy and reliability of indicators.
The choice of indicators must also consider their ability to be measured and interpreted, as indicators that are too complex or not very objective can make it difficult to understand and make decisions based on them. In other words, the greater the simplicity in defining and communicating indicators, the greater the understanding of everyone involved. Therefore, the selection of appropriate indicators involves several challenges, from definition aligned with objectives to obtaining reliable data and the ability to adapt as this information changes or updates. Dealing with these challenges strategically is essential to ensure that the chosen indicators offer an accurate and useful view of organizational performance [13], [14]
-
3.2 Power BI
-
3.3 Business Intelligence
In a case study conducted by [15] the use of Power BI in managing the maintenance of a fleet of employee transport buses was effective in improving management, analyzing data from bus inspections. The visualization of the software's graphics facilitated decision-making and the identification of critical components with failures, such as the braking system, steering and suspension, and, after implementation, there was a significant reduction in the failure rate.
The work of [16] is similar to this research when using Power BI to highlight its concept and its cost-benefit relationship, with an emphasis on logistics, especially in large corporations. Furthermore, [14] in a retail company, highlighted the role of indicators when analyzing customer satisfaction. By analyzing these indicators, the company understood customer expectations, identified areas for improvement in service and products, resulting in more effective loyalty strategies and greater customer retention.
For the application of BI, three software popularly known on the market were analyzed, the advantages and disadvantages of each one are summarized in Table 1.
Table 1. Pros and cons of BI software.
|
Software |
Pros |
Cons |
|
Tableau |
- Intuitive interface. - Powerful visualization capabilities. |
- Expensive licensing for corporate implementations. |
|
Qlik Sense |
|
- Greater learning curve. - High initial cost. |
|
Microsoft Power BI |
|
- Limitations in scalability and advanced features. |
Tableau software has the benefit that data visualization and analysis can be done on its platform without the need for in-depth programming knowledge. This makes it more accessible to users, so it does not require long and specific training to be able to use its features.
The Qlik Sense platform, in turn, emphasizes its friendly interface, with greater interactivity with the user, allowing exploration and discoveries within the software. As [17] reminds us, it is also a tool that allows the interpretation and visualization of huge data sources.
Power BI is a set of software services, applications, and connectors that cooperate seamlessly to transform unrelated data sources into coherent, visually engaging, and intuitive information that supports the decision-making process [18] Furthermore, it also has strong integration with corporate BI, which justifies its use in several companies around the world.
Given the above and understanding the reality of the company we operate in, the best choice for specific use in this work is the application using Power BI. In addition to the benefits already presented, the company also has other Microsoft services, which facilitates access, licensing and integration with other platforms.
Power BI is a Business Intelligence tool widely used in the corporate environment, standing out for its ability to collect, transform and visualize data in an intuitive and efficient way. As discussed, [1], the importance of managing data today, amid the rise of Industry 4.0, is clear. With this in mind, it can be said that BI offers a range of resources that allow the integration of different data sources, whether local or in the cloud, providing a consolidated and comprehensive view of business data.
BI denotes a set of practices and tools aimed at transforming data into strategic information for making business decisions. As previously highlighted by [10] this approach allows companies to obtain, integrate and analyze data from multiple sources, offering a comprehensive and integrated view of organizational performance. Through personalized reports and interactive dashboards, BI provides a clear visual representation of data, allowing you to quickly identify metrics and trends relevant to management positions.
In short, organizations that adopt BI transform data into useful information, enabling managers and leaders to direct their strategies with greater confidence and assertiveness. Therefore, it is clear that adopting the concept of BI for a company tends to add both in the technical aspect, promoting security through tangible data, and in terms of planning.
Evaluating the usability and flexibility of Power BI is an important feature in its effectiveness as a BI tool. When using the tool, it is possible to notice that its adoption is related to its intuitive interface, facilitating user interaction and allowing a faster learning curve. Its application method, combined with data visualization capabilities, makes exploration and reporting an accessible task even for inexperienced users [19]
Regarding flexibility, Power BI offers diverse customization and configuration options, as highlighted by [15]), considering that it is possible to export the report to different platforms, in addition to common use, in the development environment of the tool itself. Its ability to integrate with different data sources and the ease of creating customized data models allow the tool to be adapted to meet the specific needs of different business contexts. This makes it possible to build dashboards and reports that can be adapted for each application. The integration of Power BI with other tools is an essential aspect for its effectiveness and relevance in application for companies, and its ability to integrate with a variety of data sources and systems allows for a broader approach to analyzing and interpreting information [15]
Proper access management is an important point in terms of data security, as Power BI's ability to configure specific permissions and access ensures that only authorized users have access to sensitive data, reducing the risks of security breaches and information leaks confidential. Confidential information may include information about billing, income, information under development about new applications, among others [20]
Power BI's ability to offer visuals in an accessible and simplified way is one of the main drivers of this tool's operational efficiency in the business environment. As highlighted by [21], planning within a company is essential for increasing its efficiency, reducing costs, increasing productivity, ensuring quality and, consequently, improving the company's profitability. Given this, it can be said that Power BI plays the role of simplifying the interpretation of complex data and enabling a proactive approach to management, contributing significantly to improving internal processes, boosting the efficiency and competitiveness of companies.
4. Action Research - implementation of Power BI indicators
As described, Power BI is a powerful tool when it comes to data analysis. In addition to being a Microsoft tool, it allows the connection of more company resources to produce more and more useful information. Therefore, the software was used to display project data from the innovation section of a multinational transformer company, using automation resources and project management concepts. The execution flow designed for the practical part is summarized in Figure 4.
The company that focuses on this application was founded in 1961, and one of the company's headquarters is located in Blumenau and produces small, medium and large transformers. With operations in more than 15 countries, its performance is among the world leaders in the sector, which means that the company needs to constantly update itself, embrace technology and constantly improve, to remain in the market. In view of this, the Planning, Development and Innovation section, the PDI, was born. Within the PDI, products are developed for the company itself, that is, resources that will facilitate the work and daily lives of employees. In addition to offering practicality, technology also promotes safety, standardizing processes and minimizing the risks of human errors.

Analysis and choice of tools to be used in the work.
О
Definition of the data to be analyzed and its source of origin: Jira and Excel spreadsheets.
О
Use of automation resources to develop the extraction: Python, VBA.

Relationship between tables, creation of measures and data transformation: Power Query and Power BI.
О
Layout definition, choice of visuals and user-friendly navigation.
Project Definitions
Data
Structuring
Automation for Extraction
Application in Power Bl
Interface with Result
Additional
Using the Power Apps tool to collect member data.
Use of Data Gateway to keep information updated with the database.
Fig. 4. Deployment Process Flow
Due to the growth of the section over the years and the increase in demand for new products, it was necessary to implement the role of the project manager to organize, plan and train employees within the requirements made by the company. The position demands time, dedication and constant study for improvements, methods and means of achieving results with increasingly structured applications and processes. Among the searches for improvements, the need for visual parameters to show section data was diagnosed, which is where the creation of indicators arises. Set as a target for the end of 2023, the application of indicators for information analysis, planning and decision-making began its execution process and resulted in this work.
The essential part of developing a data dashboard denotes understanding that the content of this information must contain an adequate structure to extract what is desired to carry out the application. Therefore, for this work, the data was structured in order to extract useful information for each BI visual. Therefore, when carrying out the application, the project management platform was taken into account, as well as members' responses to an application that collects responses and a database containing relevant information to present in the dash.
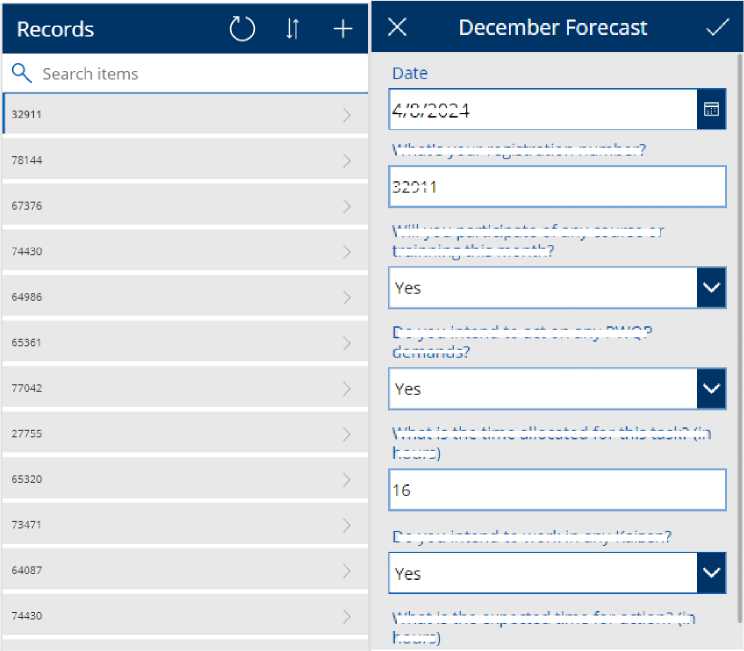
To present data on members' intentions, that is, their prediction of performance in activities, an application was created that requests simple responses from employees. The main objective of these responses is to represent in the application's visuals where people's focus is concentrated, in order to be able to act and encourage them to act more strongly towards the company's goals. The application was developed by the authors of this work on the Power Apps platform, a Microsoft resource to promote the creation of apps in a simple way, basically developed using block programming. Its properties can be modified to meet the developer's requirements, for example using drop-down lists, settings to accept only numeric values, among others. The data collected from employees were:
-
• Registration number;
-
• Participation in some training or course during the month;
-
• If you will work on any PWQP (Quality and Productivity Program) and/or kaizen (continuous improvement) demands;
-
• If there is a demand for quality or kaizen, the expected number of hours of participation in each of the activities is mentioned.
The details of the collected responses can be seen both in the application itself and in the table that is fed with them. There is a screen that presents all the records, listed by each registration number, which, when clicked, opens a screen with the record details. In Figure 5, two screens are shown, so that on the screen that lists the records, users enter new answers by clicking on the plus icon. On the other hand, on the detail screen, you can delete or edit the information provided.
4/8/2024
What's your registration number?
32?
Do you intend to work in any Kaizen?
trainningthis month?
demands?
What is the time allocated for this task? (in hours)
hours)
Fig. 5. Details of the application that collects information
Will you participate of any course or
Do you intend to act on any PWQP
What is the expected time for action? (in
The responses generated are also stored in a table in the company's cloud, shown in Figure 6 so that your responses can be read by employees interested and involved in the subject. This table comes from one of the sources of information that was processed within Power BI to perform the work.
|
Date Q |
What’s your — registration number? |
Will you participate of_ any course or trainnirW this month? |
Do you intend to act on any PWCQ demands? |
What is the time allocated for this ^ task? (in hours) |
Do you intend to work in any Q Kaizen? |
What is the expected time for action? (j^ hours) |
__Power Appsld_Q |
|
2023-11-10 |
102684 No |
Yes |
30 Yes |
10 DMR5KQcz4uY |
|||
|
2023-11-10 |
32911 |
No |
Yes |
16 No |
LuvsZw5KaSg |
||
|
2023-11-10 |
78144 NO |
No |
0 No |
0 kVuS7-6PZPY |
|||
|
2023-11-10 |
67376 Yes |
No |
No |
a6JPfq2klkA |
|||
|
2023-11-10 |
74430 No |
Yes |
50 No |
0 |
t9VHWa2Yvs |
||
|
2023-11-10 |
64986 No |
No |
No |
vhkCpjSYjyw |
|||
|
2023-12-05 |
45463 Yes |
No |
12 Yes |
0,5 |
a_0wMNhwNuc |
||
|
2023-11-10 |
65361 Yes |
No |
0 No |
0 hKt3kx4UOh8 |
|||
|
2023-11-10 |
77042 No |
Yes |
4 No |
0 aDzrGYwfrJg |
|||
|
2023-12-01 |
27755 Yes |
Yes |
200 No |
VO-CO3LZ5N4 |
|||
|
2023-12-04 |
65320 No |
Yes |
148 No |
160 ZR9CkNpUSEA |
|||
|
2023-11-10 |
73471 Yes |
Yes |
3 No |
UzSRQH2jY18 |
|||
|
2023-11-21 |
64087 Yes |
Yes |
3 No |
ogx90jgYlw8 |
|||
|
2023-11-30 |
74430 No |
Yes |
60 No |
0 o63TQacuf4Q |
|||
|
2023-11-30 |
64087 No |
Yes |
3 No |
XmlAFEylAk4 |
|||
|
2023-11-30 |
71406 Yes |
No |
6 No |
0 a7DH9oO5CQ |
|||
|
2023-11-30 |
2474 No |
Yes |
3 Yes |
2 Tgkd9ilKi5c |
|||
|
2023-11-30 |
77711 |
No |
No |
No |
IRa3673-9XA |
||
|
2023-12-01 |
65849 No |
No |
0 No |
0 VzQqBtowr_0 |
|||
|
2023-12-01 |
65679 Yes |
No |
40 No |
0 rpwTIOOblSU |
|||
|
2023-12-01 |
76634 Yes |
No |
No |
8QXi8V-73NU |
|||
|
2023-12-01 |
65483 Yes |
No |
No |
6r3Tjr7gN-0 |
|||
Fig. 6. Summary of records made in the application
Another source of application data are tables that contain information about each project extracted from the Jira management platform. In Jira, it is possible to create appropriate fields for each company, so the importance of extracting them to present useful data on the dashboard is clear. When extracting project information from the platform, it generates an Excel file with data for each project task and its assignment fields.
However, if this extraction process were done manually, it would be much more laborious, as the platform generates a new record file every time it is required, by nature. The objective is for the document to be overwritten, to avoid maintaining file names and the Power BI database itself, which receives its information through the file's storage path, so if a new file is generated, all metrics created for the old file will no longer work. Therefore, automation was developed to automatically extract this data from the management platform to the BI source file.
As an essential part of this work, the automation of data extraction was carried out by the authors, in collaboration with the work team, using VBA concepts and Python programming. For individual update purposes, the user can choose to open the spreadsheet that stores the information for each project and update. However, when the desire is to update all projects, this process becomes repetitive and time-consuming, so it can be automated. For the automation to work correctly, some steps must be followed, such as inserting the project together in the list in Figure 7, which represents a file that lists all projects, as well as their access key. Due to this key, the update occurs assertively, as each one refers to a unique project and only to it.
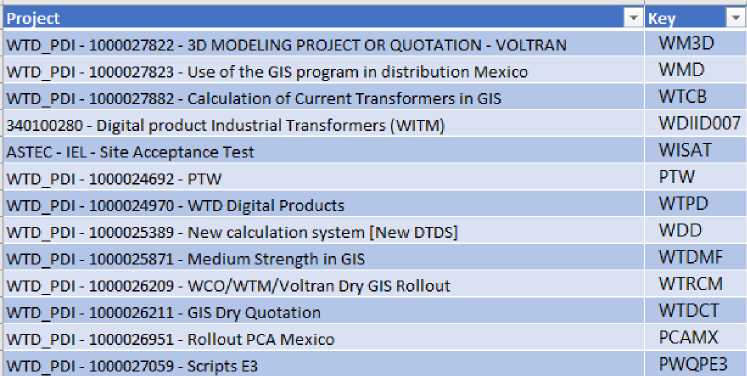
Fig. 7. Spreadsheet with project list
In case of positive validation, the automation will run and load all tasks present in the project, represented as lines, as well as their characteristics, represented as columns. Lastly, but equally important, a navigation tab was created, as the application interface allows the user to browse the data, selecting a specific project or even general section and member information. Figure 8 illustrates this application.
Tabs т
ASTEC
ASTEP 2.0
E3 Automation
GIS Quotation
GIS Strength
GIS Medium Strength MF Renovaveis Padmount Rollout
PCA Mexico Rollout Single-phase PCA PTW
Quality Systems Simulations
Support
PMO
Digital Products
Fig. 8. BI navigation tabs
5. Results
After implementation, as the process of choosing a project continues, the user is directed to the required page. On this page, some information regarding the project will be available, including:
-
• Brief description of the purpose of the application;
-
• Members working on the project;
-
• Project status;
-
• Release (version) the project is in;
-
• Expected delivery date for this Release;
-
• Hours recorded in project tasks;
-
• Development of the Release, that is, the tasks of this version, what is the classification of each one (measure progress);
-
• Priority classification among tasks that have not yet been covered;
-
• Information about impacts and risks registered in the project, as well as the action plan regarding them.
Figure 9 shows the layout model in which the data is presented. It is worth remembering that a page was developed for each project, each with its respective information, considering around 15 projects.
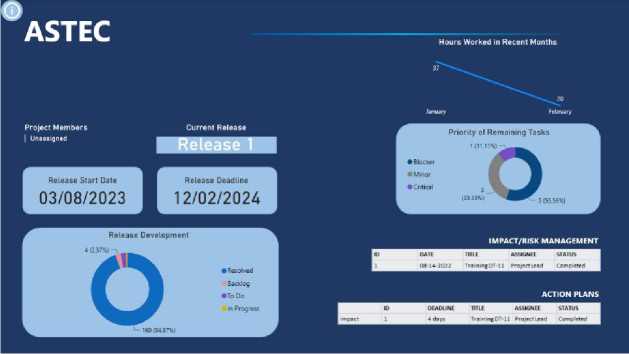
Fig. 9. Page template designed for each project
Furthermore, in the work execution area, there is a group of people focused on carrying out simulations of the transformer projects that will be manufactured. Normally simulations are requested when the transformer structure is not commonly manufactured, so it needs to undergo some tests. Given this, Figure 10 represents the page directed to the group of simulations, displaying relevant data about the team's performance, considering a period of five months:
• Number of simulations created and solved;
• Team productivity;
• Service class of simulations;
• Average waiting time for designers and average time dedicated to each simulation;
• Status and number of simulations that have not yet been resolved;
• Service for each simulation already carried out.
6. Conclusion
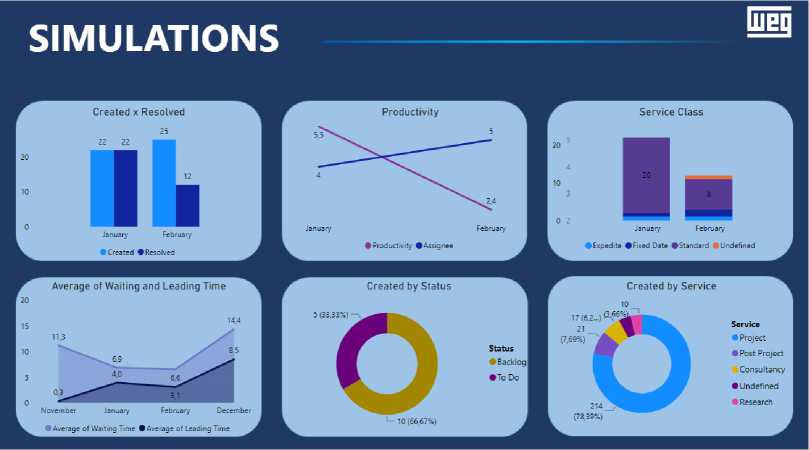
Fig. 10. Tab developed to present simulation data
Regardless of the change implemented in each organization, the challenges and limitations remain the same. Some authors mention employee engagement, training, and project management tools. These factors are crucial for the success in organizations to achieve industry’s best practices.[22]
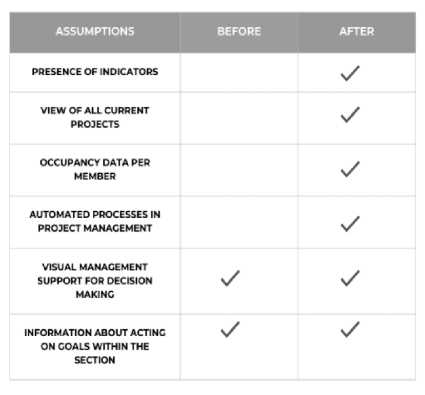
Fig. 11. Comparative results of applying Power BI in the company under study
A summary of the results is in Figure 11, which compares the improvements obtained with the automated implementation of the indicators. As mentioned, the main motivation for applying this work was the absence of indicators, so that, now, project management has automations that work in its favor, fulfilling the role foreseen by the project, which is support in management positions. management and decision-making.
This article aimed to automate indicators in a transformer company. To achieve this, the methodology followed a theoretical part focused on project management concepts and indicators. After the analyses, this methodology was implemented in the company. Thus, the results obtained showed that the project pages are used in handover meetings to the manager, so that, when the data is automatically updated, in a few minutes the visual is adapted to a current version of the project. Furthermore, the tab that shows ongoing projects has a strong contribution to alignment meetings, allowing project managers and the section head to visualize deliveries that are close or in continuity to be planned.
The main reason for the development of this work was resolved, which was the need to create indicators to assist in the management of the section where the project was applied. With its application, it was possible to provide useful information, previously non-existent, so that the possibility of making errors in planning and decisions was considerably minimized. As results for the company, it is worth mentioning the innovation of processing data through applications such as Power BI, in order to reduce the amount of work that was previously carried out. Furthermore, as the company has goals involving continuous improvements, this application contributed to increasing results regarding good practices, bringing profit to the company and employees.
In general, as a suggestion for progression on the subject, data extraction automation can be done in different ways. In this work, one of these forms was addressed, which is believed to have a lot of room for improvement. Furthermore, the visuals have a repetitive identity, which can be better explored with the use of filters and optimization of maintenance of this information that is exposed. The way the indicators were built, users are able to update the information, but not change its structure, so the knowledge is held in the hands of the developer. An instruction document was prepared, but training on the tool is recommended to have such autonomy.
In short, citing just a few of the various application examples that are being created based on the work done, it can be said that the development of the tool was successful and has real application in the company. In view of the above, the proposition of defining and developing automated and relevant indicators was achieved, with the help of an appropriate tool and research in the area of interest. However, it is common for some complications to arise along the way, such as the learning curve to understand the resources available in BI or even the challenge of creating connections and models that result in what is desired. Despite the difficulties, the estimated gains from this application are well seen within the management area, saving time in preparing complex analyzes that can be extracted directly from the indicators. Consequently, by having good project management, the section becomes more mature and prepared to carry out planning and adopt quality strategies.
References Indicator Automation with Power BI in the Innovation Sector of a Transformer Company
- T. P. Raptis, A. Passarella, and M. Conti, “Data Management in Industry 4.0: State of the Art and Open Challenges,” IEEE Access, vol. 7, pp. 97052–97093, 2019, doi: 10.1109/ACCESS.2019.2929296.
- J. Tidd and J. R. Bessant, Managing innovation: integrating technological, market and organizational change. John Wiley & Sons, 2020.
- S. Paton and B. Andrew, “The role of the Project Management Office (PMO) in product lifecycle management: A case study in the defence industry,” Int J Prod Econ, vol. 208, pp. 43–52, Feb. 2019, doi: 10.1016/j.ijpe.2018.11.002.
- A. J. Dal Forno, F. A. Forcellini, L. M. Kipper, and F. A. Pereira, “Method for evaluation via benchmarking of the lean product development process: Multiple case studies at Brazilian companies,” Benchmarking, vol. 23, no. 4, 2016, doi: 10.1108/BIJ-12-2013-0114.
- Ronielton. Rezende Oliveira and H. C. Martins, “Project management office performance: Divergence of the perceptions between academic instruction and professional experience.,” Innovar, vol. 30, no. 75, pp. 119–134, 2020.
- M. Li and Y. Liu, “The influence of digital innovation ecosystem of high-end equipment manufacturing on the intelligent maturity of enterprise – an empirical study on the configuration of the ‘three-layer core-periphery’ structure,” Business Process Management Journal, vol. 30, no. 1, pp. 199–221, Feb. 2024, doi: 10.1108/BPMJ-01-2023-0005.
- A. Erro-Garcés and J. A. Alfaro-Tanco, “Action Research as a Meta-Methodology in the Management Field,” Int J Qual Methods, vol. 19, p. 160940692091748, Jan. 2020, doi: 10.1177/1609406920917489.
- S. Iepsen, D. G. Helfer, R. Frozza, D. P. Lacerda, A. J. Dal Forno, and L. M. Kipper, “Competences for Industry 4.0 in Innovation Environments: A Field Study at Technology Parks in Rio Grande Do Sul, Brazil,” Academy of Entrepreneurship Journal , vol. 29, no. 6S, pp. 1–17, 2023.
- Chen, Chiang, and Storey, “Business Intelligence and Analytics: From Big Data to Big Impact,” MIS Quarterly, vol. 36, no. 4, p. 1165, 2012, doi: 10.2307/41703503.
- R. D. C. dos Santos, “Power BI: a experiência de implantação em um escritório de contabilidade,” Trabalho de Conclusão de Curso, UNIVERSIDADE FEDERAL DA PARAÍBA – UFPB, João Pessoa, 2018.
- D. Appelbaum, A. Kogan, M. Vasarhelyi, and Z. Yan, “Impact of business analytics and enterprise systems on managerial accounting,” International Journal of Accounting Information Systems, vol. 25, pp. 29–44, May 2017, doi: 10.1016/j.accinf.2017.03.003.
- C. L. da Silva and L. Assis, “Aplicabilidade do Planejamento Estratégico em Hospitais Universitários Federais,” Revista de Gestão em Sistemas de Saúde, vol. 5, no. 2, pp. 39–56, Dec. 2016, doi: 10.5585/rgss.v5i2.257.
- P. Girardin, C. Bockstaller, and H. Van der Werf, “Indicators: Tools to Evaluate the Environmental Impacts of Farming Systems,” Journal of Sustainable Agriculture, vol. 13, no. 4, pp. 5–21, Mar. 1999, doi: 10.1300/J064v13n04_03.
- W. S. de S. Costa, J. V. Queiroz, N. C. Lima, J. A. P. Silva, and F. C. B. P. Queiroz, “Indicadores como base para a gestão estratégica de supermercados varejistas,” Revista de Gestão e Secretariado, vol. 13, no. 3, pp. 1189–1217, Nov. 2022, doi: 10.7769/gesec.v13i3.1398.
- G. R. D. S. Costa, “Manutenção e confiabilidade: Um modelo para análise de dados de performance em caminhões de mineração utilizando o power bi.,” Trabalho de Conclusão de Curso, UFRA, Parauapebas, 2023.
- J. A. S. Riva, “Power BI como ferramenta de tomada de decisões: um estudo de caso na empresa Capgemini,” Trabalho de Conclusão de Curso, Faculdade de Tecnologia de Americana “Ministro Ralph Biasi,” Americana, 2022.
- K. Gowthami and M. R. P. Kumar, “Study on Business Intelligence Tools for Enterprise Dashboard Development,” International Research Journal of Engineering and Technology (IRJET), vol. 4, no. 4, pp. 2987–2992, 2017.
- Microsoft, “Microsoft Power BI,” www.microsoft.com. Accessed: May 21, 2024. [Online]. Available: www.microsoft.com
- L. T. Becker and E. M. Gould, “Microsoft Power BI: Extending Excel to Manipulate, Analyze, and Visualize Diverse Data,” Serials Review, vol. 45, no. 3, pp. 184–188, Jul. 2019, doi: 10.1080/00987913.2019.1644891.
- R. Bhatti, D. Gao, and W.-S. Li, “Enabling policy-based access control in BI applications,” Data Knowl Eng, vol. 66, no. 2, pp. 199–222, Aug. 2008, doi: 10.1016/j.datak.2008.03.003.
- N. A. Jalil, P. Prapinit, M. Melan, and A. Bin Mustaffa, “Adoption of Business Intelligence - Technological, Individual and Supply Chain Efficiency,” in 2019 International Conference on Machine Learning, Big Data and Business Intelligence (MLBDBI), IEEE, Nov. 2019, pp. 67–73. doi: 10.1109/MLBDBI48998.2019.00021.
- O. Zwikael and S. Globerson, “From Critical Success Factors to Critical Success Processes,” Int J Prod Res, vol. 44, no. 17, pp. 3433–3449, Sep. 2006, doi: 10.1080/00207540500536921.
