Infrared and Microwave Image Fusion for Rainfall Detection over Northern Algeria

Author: Fethi Ouallouche, Mourad Lazri, Soltane Ameur, Jean Michel Brucker, Mounir Sehad
Journal: International Journal of Image, Graphics and Signal Processing(IJIGSP) @ijigsp
Article in issue: 6 vol.6, 2014.
Free access
Rain areas delineation proposed in this paper is based on the image fusion from geostationary Meteosat Second Generation (MSG) satellite, with the low-earth orbiting passive Tropical Rainfall Measuring Mission (TRMM) satellite. The fusion technique described in this work used an artificial neural network (ANN). It's has been developed to detect instantaneous rainfall by using information from the IR images of MSG satellite and from TRMM Microwave Imager (TMI). The study is carried out over north of Algeria. Seven spectral parameters are used as input data of ANN to identify raining or non - raining pixels. Corresponding data of raining /non-raining pixels are taken from a PR (precipitation radar) issued from TRMM. Results from the developed scheme are compared with the results of SI method (Scattering Index) taken as reference method. The results show that the developed model performs very well and overcomes the deficiencies of use a single satellite.
Rainfall estimation, data fusion, MSG, TRMM, ANN
Short address: https://sciup.org/15013300
IDR: 15013300
Text of the scientific article Infrared and Microwave Image Fusion for Rainfall Detection over Northern Algeria
Published Online May 2014 in MECS DOI: 10.5815/ijigsp.2014.06.02
Precipitation is a key parameter of the global water cycle and affects all aspects of human life and ecosystem processes. Its coverage, frequency and amount is of great importance especially for agriculture, hydrology, water engineering, and ecology. However, the spatiotemporal characteristics of rainfall can hardly be reproduced by point observations using rain gauges. Ground based precipitation Radar is also an alternative to provide real time data of rainfall event. However, these systems actually are still rare to applied in Algeria because large areas remain uncovered where information about the occurrence and the intensity of precipitation are missing. In order to overcome the paucity of rainfall data several techniques using a satellite data have been developed [1]. Infrared (IR) satellite rainfall estimates have long since been available and suffered from the difficulty in associating cloud top features to precipitation at ground level [2-5]. In the IR band the brightness temperature of the hydrometeors is measured according their radiance [6]. The cloud top that have colder brightness temperature is associated to convective heavier rainfall [7, 8].
The limitation associated with the inability of IR sensors to detect signals from the cloud profile that affect rainfall generation can be overcome by the use of microwave (MW) sensors which respond primarily to precipitation-size hydrometeors in the cloud profile. The microwave (MW) has an important characteristic that can penetrate the cloud so it can contact directly to the hydrometeor. A more complex situation of the interaction between hydrometeors and electromagnetic radiation has been shown by MW band, since MW frequencies respond directly to hydrometeors [9]. Hydrometeor is not only emitting the MW but also absorbing or scattering it [6]. Currently, MW sensors are mounted only on low-altitude orbiting satellites and therefore the observations are snapshots that are available once or twice a day. Such observation frequency makes it difficult to capture the temporal dynamics of cloud systems [10].
The complementary strength of IR and MW sensors has led to the development of algorithms that use multispectral channels for rainfall detection [11]. The Microwave/Infrared Rainfall Algorithm (MIRA) computes a series of relationships (variable in space and time) between IR equivalent black body temperature and rain-rate, established from coincident observations of IR and MW rain-rate accumulated over a calibration domain [12]. The appropriate IR/ rain-rate relationship is then applied to IR imagery at full temporal resolution. Porcù [13] used MW rainfall estimates from SSM/I to calibrate a simple IR-based technique working mainly for convective clouds.
Therefore, motivated by the need to use complementary multispectral information to better rainfall detection, we used four spectral parameters, from IR images of SEVIRI (Spinning Enhanced Visible and Infrared Imager) radiometer, onboard Meteosat second generation (MSG) satellite, fused with three parameters calculated from Microwave Imager (TMI) of TRMM (Tropical Rainfall Measuring Mission) satellite. These seven parameters are used as the input of the artificial neural network (ANN) and the PR (Precipitation Radar) data from TRMM are used as the output of ANN. These neural networks include two stages, namely, i) the training and validation stage and ii) the application stage. When the training process is finished, the seven parameters of the pixels in the test dataset are put into the network to calculate the rain flag of each pixel. The result of ANN is compared with the rain areas delineated by Scatter Index, which is a widely method used in rain delineation, to evaluate the performance of this new method.
-
II. Study area
Algeria is located on the South shore of the Mediterranean region; it is bordered on the East by Tunisia and Libya, on the South by Niger and Mali, South-West by Mauritania and Western Sahara and West by Morocco. The rainy season extends from October to March, with maximum rainfall occurring during November-December. In the north, the climate is Mediterranean transit, marked by seasonal oscillations. The average annual rainfall is estimated at about 600 mm. The minimum rainfall is recorded in the southern regions. It is about 50 mm while the maximum is observed in the Djurdjura massif located in Kabylia and the massif of Edough located a little farther east, where it exceeds 1500 mm.
The study area selected is covering the northern of Algeria. The bounding coordinates are from 34° north to 37° north latitude and from 2° west to 9° east longitude as shown in Fig. 1.
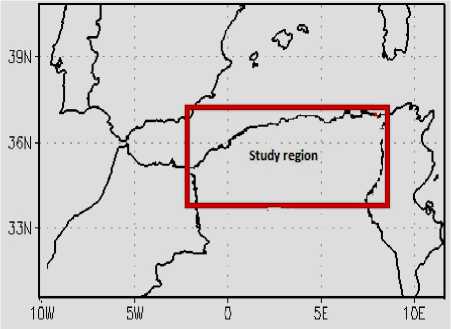
Fig 1: Study area.
-
III. Data
The satellite datasets used in this study include the coincident and collocated observation of SEVIRI infrared channels, microwave brightness temperature measured by TMI (TRMM 1B11) and rain flag derived from TRMM PR measurement (TRMM 2A25) for the area of north Algeria. These data collected during the period from October 2007 to March 2008 were used as rainfall information to train the models of neural network. A second dataset, from October 2008 to March 2009, is used to validate the developed scheme.
-
A. SEVIRI data
MSG satellites with the first one (MSG-1 now Meteosat-
-
8) was launched on 28th August 2002 and became operational in early 2004. The MSG-1 is a spinning stabilized satellite that is positioned at an altitude of about 36,000 km above the equator at 3.4° [14]. The Spinning Enhanced Visible and Infrared Imager (SEVIRI) sensor on board MSG has a high temporal resolution of 15 minutes and spatial resolution of 3×3 km2 at sub-satellite for all channels except 1km for high resolution visible (HRV) channel. Over northern Algeria, the satellite viewing zenith angle of SEVIRI is about 26°, and as a consequence the spatial resolution is reduced to about 4x5 km2.
We selected the channels sensitive to optical and microphysical properties of clouds (optical thickness, effective particles radius, cloud phase) as well as to the cloud tops temperature (CTT), and those located in the spectral absorption bands mainly affected by the water vapor. These channels correspond to WV7.3, IR8.7, IR10.8 and IR12.0 bands.
We stored the raw data (level 1.5), i.e the values of 3712 × 3712 pixels of the image, and the calibration coefficients to deduce the radiance for each pixel. The radiance can be converted into brightness temperature in infrared channels [15].
-
B. TRMM data
The Tropical Rainfall Measuring Mission TRMM [16] is a joint mission with Japan launched on November 27, 1997, aboard a Japanese H-II rocket. The TRMM orbit is non-sunsynchronous and initially was at an altitude of 350 km, until the satellite was boosted to 402 km on August 22, 2001. The spatial coverage is between 38 degrees North and 38 degrees south owing to the 35 degree inclination of the TRMM satellite [16-18].
The TRMM offers a unique instrumental design with a 220-km-wide common swath for the TRMM Microwave Imager (TMI) and the precipitation radar (PR).
The TMI is a 9 channels, 5 frequencies, linearly polarized, passive microwave radiometric system. The instrument measures atmospheric and surface brightness temperatures at 10.7, 19.4, 21.3, 37.0, and 85.5 GHz (hereinafter referred to as 10, 19, 21, 37, and 85 GHz). Each frequency has one vertically (V) and one horizontally (H) polarized channel, except for the 21.3 GHz frequency, which has only vertical polarization. The 10, 19, 21, and 37GHz channels are considered low resolution and the 85GHz channels are considered high resolution. The swath width is 878 km, covered by 104 low resolution pixels or 208 high resolution pixels.
The PR is active 13.8 GHz radar, recording energy reflected from atmospheric and surface targets. PR has a horizontal resolution at the ground of about 4 km and a swath width of 220 km. One of its most important features is its ability to provide vertical profiles of the rain and snow from the surface to a height of about 20 km. PR is able to detect fairly light rain rates down to about 0.7 mm/hr.
The 1B11 product of TMI (fig.2) has a horizontal resolution of 5 Km at 85 GHz and temporal resolution of two observations per day while the 2A25 products (fig.3) represent snapshot of rainfall rates with a horizontal resolution of 5 Km and the same temporal resolution [19, 20].
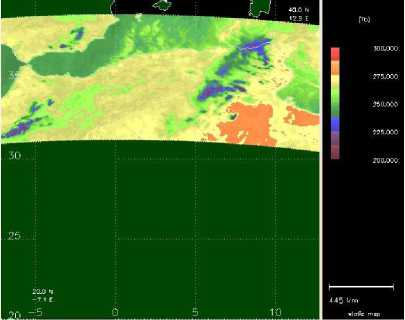
Fig 2: 1B11 product observed in northern Algeria.
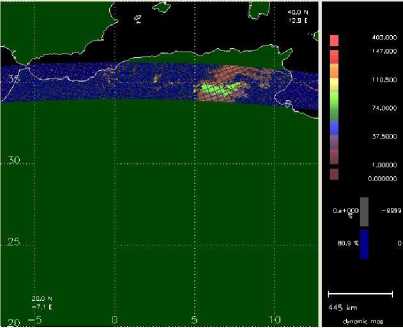
Fig 3: 2A25 product observed in northern Algeria.
As the difference of the swath width and the location of the center of the instantaneous field of view (IFOV) between TMI and PR, TRMM 1B11 should be collocated with TRMM 2A25 by the following method: for each pixel of TRMM 2A25, the nearest measurement of TRMM 1B11 in the scope of 0.05°*0.05° around the pixels is selected as the match point. If no measurement of TRMM 1B11 could be found in this scope, this pixel would be abandoned.
Before using SEVIRI images, we reduced their spatial resolution to the same from PR data i.e 5*5Km2. For each TRMM-PR overpass, the SEVIRI image closest in time was selected, which gives a maximum time difference of 7 min.
-
IV. Parameters for identification raining pixels
To identify the raining pixels, we have used four parameters derived from SEVIRI and three parameters derived from TMI. They are given as follows:
-
A. From SEVIRI
-
1. Information from IR10.8
-
2. Information from ∆TIR10.8-IR12.0
-
3. Information from ∆TWV7.3-IR12.0
-
4. Information from ∆TIR8.7-IR10.8
Brightness temperature ΤIR10.8 is an indication of the vertical extent of the cloud because, in general, brightness temperature of the system depends on the cloud-top height [21,22].
The brightness temperature difference ∆TIR10.8-IR12.0 being a good indicator of the cloud optical thickness is very effective in discriminating optically thick cumuliform clouds from optically thin cirrus clouds [21,23]. ΔT10.8–12.0 is positive at low optical thicknesses due to the increased water vapour absorption in the 12.0 μm channel relative to the 10.8 μm channel. Optically thick cumulus type cloud shows the smaller ∆TIR10.8-IR12.0 due to their black-body characteristics, while optically thin cirrus cloud shows the larger ∆TIR10.8-IR12.0 due to the differential absorption characteristics of ice crystals between the two channels. It is expected that optically thick and deep convective clouds are associated with rain [23]. Even though the split window technique is very effective in detecting and removing optically thin cirrus clouds with no precipitation, it sometimes incorrectly assigns optically thick clouds like cumulonimbus in place of optically thin clouds.
The ∆T WV7.3-IR12.0 is effective in distinguishing between high-level and low-level/mid-level clouds [24]. The 7.3-μm channel is dominated by atmospheric water vapor absorption. Low-level clouds produce temperatures at the 7.3-μm channel lower than their actual cloud top temperatures due to the absorption from water vapor above them. In contrast, their cloud-top temperatures at the 12.0-μm window channel are representative of actual cloud-top temperature since the atmosphere is transparent to this wavelength. As a result, ∆T WV7.3-IR12.0 tends to be very negative in sign for low-level clouds. In contrast, upper level thick clouds (being above most of this vapor and having absorption similar for both wavelengths due to ice crystals) produce temperatures at the 7.3-μm channel close to their actual cloud-top temperatures. In this case, ∆TWV7.3-IR12.0usually takes very small negative values. Semitransparent ice clouds, such as cirrus, constitute an exception to this rule since their differential transmission cause larger negative differences. Positive differences may occur when water vapor is present in the stratosphere above the cloud top, which is a sign of convective cloud tops [25, 26] as opposed to mere cirrus clouds.
This parameter is adequate for classifying the cloud phase as either “ice” or “water”. Cloud radiative properties in both channels are dependent upon the cloud particle size. Scattering processes and the dependence on particle size are stronger in the 8.7 μm channel relative to the 10.8 μm channel [27]. Therefore, for larger particles the ΔT8.7–10.8 increases. The water vapour absorption in the 8.7 μm channel is higher relative to the 10.8 μm channel [28, 29]. This is why ΔT8.7–10.8 is lower for low optical thicknesses. For higher optical thicknesses, the ΔT8.7–10.8 increases. As a result, ΔT8.7–10.8 reaches high values for large effective particle radius and large optical thicknesses. A low optical thickness in combination with small effective particle radius leads to minimum ΔT8.7–10.8. A low optical thickness with large particles and a large optical thickness with small particles result in medium values of ΔT8.7–10.8.
-
B. From TMI
-
1. Information from PCT at 85 Ghz
-
2. Information from ∆T37V-37H
-
3. Information from ∆T85V-37V
Experiments with microwave radiative transfer models indicate that the ice layer above the main rain layer basically determines the 85 GHz brightness temperature [30].
Surface water has low emissivity at 85 GHz resulting in brightness temperatures low enough to be confused with brightness temperatures depressed by scattering. For oblique viewing angles such as the TMI’s, the emissivity of surface water is a strong function of polarization [30]. To eliminate the effect of surface water, a polarization corrected temperature (PCT) is required.
The physical basis of the PCT is given in [31]. The PCT is calculated from the 85GHz horizontally and vertically polarized brightness temperatures by the following formula:
PCT is polarization corrected temperature; the T 85V and T 85H are the brightness temperature (BT) of vertical polarization and horizontal polarization at 85GHz respectively.
The polarization difference (PD) at 37GHz is calculated by subtracting the BT at horizontal polarization from the BT at vertical polarization. According to the study of [32], the PD is the function of surface type and frequency on land. Most of land surface types are highly polarized while the precipitation is almost un-polarized, so the PD of land surface is higher than precipitation.
The difference of TB37V and TB85V is another indicator for precipitation. Under no-rain condition, the emissivity of most land surface type increases along with the increasing frequency, thus the BT of 85GHz channel are always higher than the BT at 37GHz channel [33]. But under rain condition, the microwave radiation at 85GHz is much more sensitive to the raindrops and ice particles in the clouds, and the BT of 85GHz will descend seriously and become lower than the BT at 37GHz channel.
-
V. Methodology
In recent years, ANN’s have become extremely popular for rainfall detection, estimation and prediction
[1, 34, 35] as it provides a convenient and powerful means of performing nonlinear classification and regression.
In this study, a rain detection scheme based on Artificial Neural Networks (ANN) is developed that makes combining the spectral resolution of the SEVIRI data with TMI data. The nonparametric ANN approach approximates the best nonlinear function between multispectral information about pixel derived from MSG data and TMI data on one hand and rain information from PR data on the other hand to detect rainfall.
-
A. Artificial neural networks
An ANN is a mathematical model which has a highly connected structure similar the brain cells. They consist of a number of neurons arranged in different layers an input layer; on out layer and one or more hidden layers.
The input neurons receive and process the input signals and sends an output signal to other neurons in the network. Each neuron can be connected to the other neurons and has an activation function and a threshold function, which can be continuous, linear or non-linear functions. The signal passing through a neuron is transformed by weights which modify the functions and thus the output signal reaches the following neuron. Modifying the weights for all neurons in the network, changes the output. Once the architecture of the network is defined, weights are calculated so as to represent the desired output through a learning process where the ANN is trained to obtain the expected results [36].
The kind of neural network used for this study is a feed-forward multiple-layer perceptron (MLP). The MLP has a relatively simple architecture in which each node receives output only from nodes in the preceding layer and provides input only to nodes in the subsequent layer. Thus for the node j in the k th layer the net input lkj is a weighted average of the outputs of the ( k – 1)th layer.
-
l kj X ': ( k - j ( k - 1) i <2)
Where w ( k -1) ij is the weight connecting the output of the node i in the ( k -1)th layer to node j in the k th layer and Nk - is the number of nodes in the ( k - 1)th layer. The output of node j is a specified function of lkj.
Oy = f (lkj) (3)
The eventual output is then a function of the weighted combination of the final hidden-layer output values.
The transfer function relating input to output was a sigmoid function:
To ensure that the model has similar sensitivity to changes in the various inputs, all of the inputs were normalized to values between 0 and 1. For an input variable x with maximum xmax and minimum xmin we calculate the normalized value xA as:
x max - x min
The optimum weights were determined by training against the target values.
-
B. Training and testing data generation
A representative training data set consisting of the SEVIRI and TMI data and corresponding PR data are needed to develop a multilayer perceptron for the rainfall detection problem.
The connectional weights are updated during the backward error propagation according to the learning algorithm. This process is repeated until the error between the network output and desired output (PR measurements) meets the prescribed requirement. When the training process is complete, the network is ready for application. Rainfall detection can be obtained if combining SEVIRI and TMI data are applied to the network at this stage. The details of the algorithm are described by [37].
-
C. Application
The neural network was created using seven spectral parameters, which four were derived from SEVIRI infrared channels and three were calculated from TMI, in order to identify rain and no rain pixels (fig. 4). The number of the hidden layer neurons was selected using the network growing method [38] for the training phase. Therefore, the number of 8 neurons minimized the network’s error function (RMSE) after 800 iterations, thus, each MLP contains 7 neurons in input layer, 8 neurons in the hidden layers and 2 output neurons representing corresponding to PR data (rain, no-rain). Due to uncertainty in PR rainfall estimates at very low rain rates, the rain/no-rain threshold was set at 0.5mmh-1 [39].
The MPL rain detection algorithms were trained during the period October 2007 to March 2008.
-
VI. Results of identification and validation
In order to validate the developed model, we applied it to SEVIRI and TMI data from October 2008 to March 2009. The result of MLP is compared with the rain areas delineated by Scatter Index [40], which a widely used rain delineation method, to evaluate the performance of this new method.
According to [40] scattering index (SI) is defined as depression in the 85 GHz vertical polarized brightness temperature (T85V) due to scattering in the presence of rain. The SI is calculated using three vertically polarized radiances at 19, 21, and 85GHz. The depression is calculated by taking the difference between observed rain-affected (T85V) and its expected value (T85V*) under rain fee conditions. An SI exceeding 10°K indicates the rain pixel. Grody proposed the following relationship for scattering index (SI):
*
SI = T 85 V - T 85 V (6)
T 85 V = a l * T 21 V + a 2 * T 21 V + a 3 * T 19 V + a 4
The coefficients a 1 , a 2 , a 3 and a 4 in this equation are regressed by the TB of the pixels under no-rain condition in the training dataset.
Six categorical statistics are introduced to evaluate the performance of the two rain delineation methods in this study. These parameters are determined from Table (1) and are given as follows:
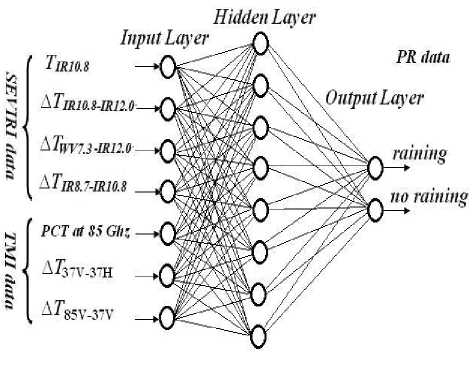
Fig 4: MLP for rain area delineation.
The Probability Of Detection ( POD) measures the fraction of observed events that were correctly identified:
a + c
The Probability Of False Detection ( POFD ) indicates the fraction of pixels incorrectly identified.
The False Alarm Ratio FAR measures the fraction of estimated events that were actually not events:
POFD = —— (9)
c + d
Table 1: O verview of the combinations in a contingency table .
|
Identified by the developed method |
Detected by PR |
|||
|
Rain |
No rain |
Total |
||
|
Rain |
a |
b |
a+b |
|
|
No rain |
c |
d |
c+d |
|
|
Total |
a+c |
b+d |
a+b+c+d |
|
The Frequency BIAS index ( Bias ) measures the overestimation or underestimation of the method. A Bias greater than 1 indicates an overestimation, while a bias lower than 1 indicates an underestimation.
Bias =
a + b
a + c
The Critical Success Index (CSI) measures the fraction of observed and/or estimated events that were correctly diagnosed:
CSI =
a
a + b + c
The Percentage of Corrects (PC) is the percentage of correct estimations:
PC =
a + d a + b + c + d
The statistical results of the verification for MLP and SI are given in table 2.
Table.2: RESULTS OF EVALUATION PARAMETERS
|
POD |
POFD |
FAR |
Bias |
CSI |
PC |
|
|
SI |
0.62 |
0.12 |
0.32 |
0.78 |
0.54 |
0.88 |
|
MLP |
0.79 |
0.05 |
0.20 |
1.05 |
0.69 |
0.94 |
|
Optimal values |
1 |
0 |
0 |
1 |
1 |
1 |
Fig.5. Fig. 5a shows the brightness temperature at the frequency of 85GHz observed by TMI; the study area is delimited by red rectangle. Fig.5 (b) and Fig.5 (c) show the rain areas delineated by SI and MLP respectively.
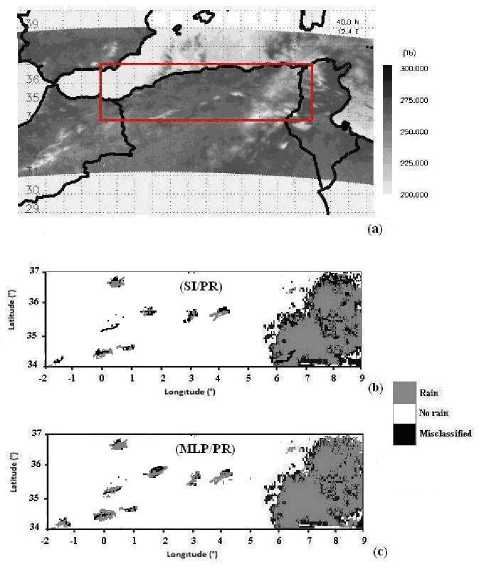
Fig 5: Delineated rain area for the scene from January 12, 2009 at 17:38 UTC .(a) is the TB at the frequency of 85GHz observed by TMI; (b) rain areas delineated by SI and PR; (c) rain areas delineated by MLP and PR.
We observe that the MLP outperforms the SI substantially in terms of probability of detection the raining clouds. Indeed, POD of SI is 0, 62 when the MLP one is 0.79. The bias for SI (<1) indicates underestimation, while the bias for MLP (>1) indicating slight over-estimation.
Compared with the SI method, the MLP method makes much less false alarmed pixels while correctly classifies. The PC parameter is high in both methods. In contrast, the CSI parameter depends on raining scenes which shows a good performance for the MLP algorithm with CSI (0.69) Compared to SI (CSI 0.54), this indicates an improvement for the MLP.
The scattering comes from the ice present on the top of the clouds, thus the scattering signal may completely be absent during warm rain conditions. The scattering signal works best for high grown convective clouds. Thus, the SI method may miss detection low rain that may often come from stratiform, warm and shallow clouds with small or no-ice present aloft. This indicates that using only data of microwave channel TMI is not effective to detect all rainfall zones. So, the infrared geostationary satellite imagery contains information pertaining to some other raining clouds.
To gain a visual impression of the performance of the introduced retrieval scheme, the classified rain area for a scene from January 12, 2009 at 17:38 UTC is depicted in
A visual inspection of the SI/PR and MLP/PR results in fig. 5.b and c reveals that the spatial patterns of the identified precipitation areas correspond quite well between both data sets. But more misclassified pixels are observed in SI than MLP method. Comparatively, SI under-detect rainfall than MLP. This confirms the statistical results obtained previously.
-
VII. Conclusion
In this study, we presented a new method to detect rainfall zone using a data fusion from IR and MW sensors. The result of this fusion has alleviated deficiencies of a single sensor method by using complementary data obtained from another sensor. Indeed, the results show that although SI can provide acceptable rain areas delineation over northern Algeria, this method tends to result in a number of false alarmed pixels. The relationship between a high SI and rain is not stable because the happening of the precipitation can be disturbed by many other factors as the presence of mountain areas. So there are some pixels under no-rainy condition but with high value of SI, and these pixels would be misclassified as rain areas. Also, some precipitating cloud areas are mainly formed by widespread lifting processes along frontal zones and are characterized by relatively warm top temperatures and a more homogeneous spatial distribution of the cloud top temperature, which differs not significantly between raining and non-raining regions.
The developed scheme allows rainfall detection in a finer way. This is due to the complementarity between the SEVIRI and TMI data on one side and the computational power of ANN on the other side. ANN's are not only powerful tools for defining relationships between parameters but also statistical means by which complex systems can be modeled. The training and testing of multilayer perceptrons based on combination of SEVIRI and TMI data from different days during demonstrate that the neural network has the ability to generate robust rainfall detect than the existing SI retrieval techniques. All seven inputs data (Four from MSG and Three from TMI) are used to gain implicit knowledge about the clouds characteristics. The results of this new technique are validated against PR data and indicate an encouraging performance concerning rainfall detection. Also, it has remedied the lack of a functional radar network in Algeria by the use of PR data to validate the proposed model.
References Infrared and Microwave Image Fusion for Rainfall Detection over Northern Algeria
- Lazri M., Ameur S., Brucker J. M., Testud J., Hamadache B., Hameg S., Ouallouche F. and Mohia Y. 2013: Identification of raining clouds using a method based on optical and microphysical cloud properties from Meteosat second generation daytime and nighttime data, Appl Water Sci, DOI 10.1007/s13201-013-0079-0.
- Arkin, P. A., Meisner, B. N., 1987. The relationship between largescale convective rainfall and cold cloud over the western hemisphere during 1982-84. Mon. Weather Review, 115, 51-74.
- Levizzani,V., 1999: Convective rain from a satellite perspective: Achievements and challenges. SAF Training Workshop- Nowcasting and Very Short Range Forecasting, Madrid, 9-11 Dec., EUMETSAT, EUM P 25, 75-84.
- Porcù, F., M. Borga, and F. Prodi, 1999: Rainfall estimation by combining radar and infrared satellite data for nowcasting purposes. Meteor. Appl., 6, 289-300.
- Amorati, R., Alberoni, P. P., Levizzani, V., Nanni, S., 2000. IR-based satellite and radar rainfall estimates of convective storms over northern Italy. Meteorol. Appl. 7, 1–18.
- Strangeways, I., 2007. Precipitation: theory, measurement and distribution,. Cambridge University Press. ISBN-13978-0-521-85117-6, 290 pp.
- Carleton, A.M., 1991, Satellite Remote Sensing in Climatology. London, Belhaven Press.
- Kuligowski, R., 2003, Satellite Rainfall Est, Vegetation, Snow, Soil Moisture Flood Inundation Other Applications, Remote Sensing in Hydrology.
- Saw, B. L., 2005. Infrared and passive microwave satelliterainfall estimate over tropics. Faculty of graduate school.
- Alemseged, Z., Njau, J., Mbua, E., 2009. Second conference of the East African Association for Paleoanthropology and Paleontology: fifty years after the discovery of Zinjanthropus. Evol Anthropol 18:235–236.
- Turk, F. J., Rohaly, G., Hawkins, J., Smith, E. A., Grose, A., Marzano, F.S., Mugnai, A., and Levizzani, V., 2000. Analysis and assimilation of rainfall from blended SSM/I, TRMM and geostationary satellite data. 10th AMS Conf. Sat. Meteor. and Ocean., 9-14 January, Long Beach, CA., 66-69.
- Todd, M. C., C. Kidd, D. Kniverton and T. J. Bellerby, 2001. A combined satellite infrared and passive microwave technique for estimation of small-scale rainfall. J. Atmos. Oceanic Technol., 18, 742-755.
- Porcù F., Prodi F., Dietrich S., Mugnai A. and Bechini R., 2000: Multisensor estimation of severe rainfall events, Proc. of the 2000 Eumetsat Meteorological Satellite Data Users' Conference. EUM P 29, Eumetsat, Darmstadt, 371-378.
- EUMETSAT, 2006. MSG CHANNELS Interpretation Guide: Weather, Surface conditions and Atmospheric constituents, http://oiswww.eumetsat.org.
- EUMETSAT, 2004. Applications of Meteosat Second Generation-conversion from counts to radiances and from radiances to brightness temperatures and reflectance. http://oiswww.eumetsat.org/WEBOPS/msg_interpretation/index.html.
- Kummerow, C. D. and Co-authors, 2000. The status of the Tropical Rainfall Measuring Mission (TRMM) after two years in orbit. J. Appl.Meteor., 39, 1965–1982.
- Smith, E.A., Hollis, T.D., 2003. Performance Evaluation of Level-2 TRMM Rain Profile Algorithms by Intercomparison and Hypothesis Testing. Meteorological Monographs 29: 207.
- Adler, R.F., Huffman, G.J., Chang, A., et al., 2003. The version-2 global precipitation climatology project (GPCP) monthly precipitation analysis (1979-present). J Hydrometeor 4 (6): 1,147 -1,167.
- Iguchi, T., Kozu, T., Meneghini, R., Awaka, J., Okamoto, K., 2000. Rain-Profiling Algorithm for the TRMM Precipitation Radar. J Appl Meteor 39(12): 2,038 - 2,052.
- Meneghini, R., Jones, J.A., Iguchi, T., Okamoto, K., Kwiatkowski, J., 2004. A Hybrid Surface Reference Technique and Its Application to the TRMM Precipitation Radar. J Atmos & Ocean Tech 21: 1,645-1,658.
- Feidas, H., Giannakos, A., 2011. Classifying convective and stratiform rain using multispectral infrared Meteosat Second Generation satellite data. Theor. Appl. Climatol. DOI 10.1007/s00704-011-0557-y.
- Thies, B., Nauss T., Bendix J., 2008. Delineation of raining from non-raining clouds during nighttime using Meteosat-8 data. Meteorol. Appl. 15, 219–230.
- Inoue, T., Wu, X., Bessho, K., 2001. Life cycle of convective activity in terms of cloud type observed by split window. 11th Conference on Satellite Meteorology and Oceanography, Madison, WI, USA.
- Lutz, H.J., Inoue, T., Schmetz, J., 2003. Notes and correspondence. Comparison of a split-window and a multi-spectral cloud classification for MODIS observations. J Meteor Soc Japan 81 (3), 623–631.
- Fritz, S., Laszlo, I., 1993. Detection of water vapor in the stratosphere over very high clouds in the tropics. J Geophys Res 98 (D12), 22959–22967.
- Schmetz, J., Tjemkes, S. A., Gube, M., Van de berg, L., 1997. Monitoring deep convection and convective overshooting with Meteosat. Adv. Space Res. 19, 433-441.
- trabala, K.I., Ackerman, S.A., Menzel, W.P., 1994. Cloud properties inferred from 8–12-μm data. J Appl Meteorol 33, 212–229.
- Soden, B. J., Bretherton, F. P., 1996. Interpretation of TOVS water vapour radiances in terms of layer-average relative humidities: Method and climatology for the upper middle, and lower troposphere. - Journal of Geophysical, Research-Atmospheres, 101: 9333–9343.
- Schmetz, J., Pili, P., Tjemkes, V., Just, D., Kerkmann, J., Rota, S., Ratier, A., 2002. An introduction to Meteosat Second Generation (MSG). Bulletin of the American Meteorological Society, 83: 977–992.
- Mugnai, A., Smith, E.A., and Tripoli, G.J., 1993. Foundations for statisticalphysical precipitation retrieval from passive microwave satellite measurements. Part- II: Emission-source and generalized weighting function properties of a time dependent cloud radiation model. J. Appl. Meteor., 32, 17-39.
- Spencer, R.W., Goodman, H.M., and Hood, R.E., 1989. Precipitation retrieval over land and ocean with the SSM/I : Identification and characteristics of the scattering signal. J. Atmos. Oceanic Technol., 6, 254-273.
- Ferraro, R.R., Smith, E.A., Berg, W., Huffman, G.J., 1998. A screening methodology for passive microwave precipitation retrieval algorithms. Journal of the Atmospheric Sciences 55, 1583-600.
- Neale, C.M.U., McFarland, M.J., Chang, K., 1998. Land-surface-type classification using microwave brightness temperatures from the special sensor microwave imager. IEEE Trans. Geosci. Remote Sensing 28, 829-38.
- Giannakos, A., Feidas, H., 2009. Detection of rainy clouds based on their spectral and textural features on Meteosat multispectral infrared data.
- Santosh Kumar Nanda, Debi Prasad Tripathy, Simanta Kumar Nayak, Subhasis Mohapatra,"Prediction of Rainfall in India using Artificial Neural Network (ANN) Models", IJISA, vol.5, no.12, pp.1-22, 2013. DOI: 10.5815/ijisa.2013.12.01.
- Mohammad Saber Iraji,Azam Tosinia,"Skin Color Segmentation in YCBCR Color Space with Adaptive Fuzzy Neural Network (Anfis)", IJIGSP, vol.4, no.4, pp.35-41,2012.
- Azimi-Sadjadi M. R. and R. Liou, "Fast learning process of multilayer neural networks using recursive least squares method," IEEE Trans. Signal Proc., vol. 40, pp. 446–450, Feb. 1992.
- Kr?se, B., and P. A. T. R. I. C. K. Van Der Smagt. "An Introduction to Neural Networks; 1996." Presso: http://citeseer. ist. psu. edu/ose96introduction. html.
- Wang J, Wolff D (2009) Comparisons of reflectivities from the TRMM precipitation radar and ground-based radars. J Atmos Oceanic Technol 26(5):857–875.
- Grody, N.C., 1991. Classification of snow cover and precipitation using the special sensor microwave imager. J. Geophys. Res.-Atmos. 96, 7423-35.
