Innovation potential of regions within the Arctic zone of the Russian Federation: assessment methodology, comparative analysis, development prospects

Author: Kuznetsova Marina N., Vasilyeva Anastasia S.
Journal: Economic and Social Changes: Facts, Trends, Forecast @volnc-esc-en
Section: Science, technology and innovation development
Article in issue: 2 т.16, 2023.
Free access
Innovation potential, which determines economic competitiveness of a region (country) is an important indicator of sustainable development and growth of territories. Many existing approaches to measuring this indicator require further discussion within the academic community. It is necessary to supplement and expand the tools to improve the assessment of the quality of the indicator under consideration. The Arctic zone of the Russian Federation is in the scope of Russia’s strategic interests due to the geopolitical and geo-economic positions of this territory in the modern world (12-15% of the country’s GDP is created here, and 25% of exports is provided). Eight RF constituent entities belonging to the Arctic territories are the object of our study. Methodological basis includes analysis of documents that define strategic development of territories within the framework of the innovation direction, and review of existing approaches to assessing innovation potential level. Regional statistical data serve as the information base. The aim of the research is to develop a methodology for assessing innovation potential using objective indicators grouped into blocks and calculated using the integral method. The results are visualized on a radar chart that contains indicators for the regions included in the RF Arctic zone. This makes it possible to compare RF constituent entities according to the degree of innovation potential and determine their position. We suggest clustering regions, identifying leaders and outsiders so as to substantiate proposals to stimulate key areas in innovation activity. We provide an interpretation of the values of innovation potential level. The findings of the research indicate the necessity to design programs for regional development of territories with the involvement of large business as a potential investor.
Innovation, innovation potential, resource approach, integral method, index method, cluster analysis, assessment methodology, regions of the arctic zone of the russian federation
Short address: https://sciup.org/147240791
IDR: 147240791 | UDC: 332.14 | DOI: 10.15838/esc.2023.2.86.4
Text of the scientific article Innovation potential of regions within the Arctic zone of the Russian Federation: assessment methodology, comparative analysis, development prospects
In the contemporary context of economic functioning, an important development factor of a country (region) is an increasing of innovation potential, which becomes one of the main indicators, allowing effectively competing at the national economy level. To raise the innovation activity, it is necessary to orient to regions’ innovative opportunities. Thus, synergetic effect is demonstrated, ensuring sustainable socio-economic development of a country.
The aim of the research is to work out a methodology for assessing innovation potential of a territory and its testing on statistical data of the regions, included in the Arctic zone of the Russian Federation.
To solve the purpose, we have defined the following tasks:
– to summarize theoretical aspects of problem (comparison and clarification of the conceptual framework, analysis of approaches and methods for assessing innovation potential level with an emphasis on their strength and weaknesses) on the basis of a review of literature resources;
– to justify an algorithm for calculating the indicator under consideration in the framework of the proposed methodology;
– to conduct a comparative analysis of the results by ranking regions by innovative potential level and reveal leaders and outsiders;
– to assess the development prospects of the entities from the perspective of innovation activity.
The research object are the territories of the Arctic zone of the Russian Federation, which are of strategic interest for Russia, based on geopolitical, geo-economic position of the region in the modern world.
The RF Arctic zone includes eight regions. Three territories (the Murmansk Oblast, Chukotka AO, Yamalo-Nenets AO) are fully part of the RF Arctic zone; the Arkhangelsk Oblast and Nenets Autonomous Okrug (NAO), Republic of Karelia, Republic of Komi, Krasnoyarsk Krai, and Republic of Sakha (Yakutia) are partially included1.
The regions’ geography is vast, the territories are included in different federal districts of the RF. The Northwestern Federal District includes the Murmansk Oblast, the Arkhangelsk Oblast and NAO, Republic of Karelia, Republic of Komi; the Siberian Federal District – Krasnoyarsk Krai; the Far Eastern Federal District – Chukotka AO, Republic of Sakha (Yakutia). The Ural Federal District includes Yamalo-Nenets AO. The population of the Arctic zone is 2.6 million people, and the total area of the Arctic territories is 5 million square kilometers.
Table 1. Comparative characteristics of the regions of the RF Arctic zone
RF constituent entity Area of Arctic territories, thousand km2 Population living in the Arctic territories, thousand people Average population density, people per km2 Composite innovation index* Rank by innovation index Republic of Karelia 71.4 109.0 3.3 0.325 47 Republic of Komi 127.4 152.0 1.9 0.333 42 Arkhangelsk Oblast 222.9 627.0 1.9 0.347 34 Murmansk Oblast 144.9 724.5 5.0 0.335 41 Yamalo-Nenets AO 769.3 552.1 0.7 0.293 61 Krasnoyarsk Krai 1094 237.0 1.2 0.427 8 Chukotka АО 721.5 50.0 0.1 0.13 85 Republic of Sakha (Yakutia) 1608.8 68.0 0.3 0.309 56 Note: data on the composite innovation index are given for Russia’s constituent entities without distinguishing the territories included in the Arctic zone of RF (such information is missing). *Rating of Innovative Development of the Constituent Entities of the Russian Federation. Issue 7. Moscow: National Research University “Higher School of Economics”, 2020. 274 p. (accessed: January 16, 2023). Source: Available at: (accessed: March 3, 2023).
Table 1 gives a characteristic of the regions of the RF Arctic zone.
The RF Arctic zone is characterized by unfavorable climatic living conditions, low population density (from 0.1 to 5.0 people per square kilometer; in general in Russia the population density is 8.6 persons per square kilometer)2, local character of territory development and industrial and economic activity, orientation of the economy on the extraction of hydrocarbons and export of resources to other Russia’s constituent entities and abroad, dependence on supplies of vital goods.
The Arctic territory of the Arkhangelsk Oblast occupies 222.9 thousand square kilometers (4th place), the population is 627.0 thousand people (2nd place). The population density index is presented taking into account the NAO (in the NAO the population density is 0.23 people per 1 sq. km). Composite innovation index of the territory is 0,347 (without NAO; in NAO this value is equal to 0,155 (rank 84)).
Functioning of territories is impossible without innovation activity, which contributes to the effective development of a constituent entity. The costs of innovation activities of organizations in the RF Arctic zone amounted to 0.63% in 2019, in 2020 – 0.62% of the total amount of these costs in the Russian Federation3.
Given the importance of the Arctic at the federal level, a number of documents defining the RF state policy on the time lag until 20354 and the strategic development of the territory within the framework of an innovative approach were developed5.
The development strategy for the Arctic zone includes three stages. Currently, the first stage (2020–2024) is being implemented; it consists of the formation of approaches to the economic and social development of the territories and elaboration of the regulatory and legal framework, taking into account their specifics.
Within the framework of the strategy, the state program “Social and economic development of the Arctic zone of the Russian Federation”6 is being implemented. The document gives target indicators of the development of the RF Arctic zone and the provision of national security through to 2035. The target values of the indicators are established for the periods through to 2024, 2030 and 2035 by the Presidential Decree7.
Each constituent entity of the Russian Federation belonging to the Arctic zone develops documents at the mesolevel, taking into account the features of the region.
Many Russian and foreign scientists refer to the issues of innovation development, assessment of innovation potential of territories, differentiation of strategies of innovation development of the subjects of the regional economy (Tab. 2) .
Table 2. Theoretical foundations of the research
|
Authors |
Research content |
|
L.S. Arkhipova, G.Yu. Gagarina (Arkhipova, Gagarina, 2014) |
The authors consider approaches to assessment of innovation economy development in Russia’s constituent entities, analyze qualitative and quantitative methods of calculation of innovation potential of territories, and offer methods of assessment of innovation development using index and rating methods |
|
A.R. Bakhtizin, E.M. Bukhvald, A.V. Kolchugina (Bakhtizin et al., 2016) |
Rating method of assessment of the indicator, ranking Russia’s constituent entities on innovation, investment and social potential |
|
A.B. Gusev (Gusev, 2009) |
The author raises the question about the development of a methodology for determining the rating of regions by level of innovation development with their subsequent differentiation |
|
Yu.A. Gadzhiev, M.M. Styrov, D.V. Kolechkov, N.V. Shlyakhtina (Gadzhiev et al., 2016), N.V. Kuznetsova (Kuznetsova, 2017) |
The authors discuss the problem of assessment and analysis of innovation potential on the basis of the cluster method using statistical data |
|
E.S. Gubanova, O.S. Moskvina (Gubanova, Moskvina, 2020), I.G. Ershova, L.N. Guselnikova (Ershova, Guselnikova, 2020), O.F. Kotikhina (Kotikhina, 2007), N.A. Perevozchikova, D.G. Bagdasarova (Perevozchikova, Bagdasarova, 2020) |
The authors consider methodological aspects of the investment and innovation potential of the region based on the resource approach with the use of matrix and integral methods |
|
L.N. Guselnikova (Guselnikova 2020), O.A. Doni-chev, D.Yu. Fraimovich, S.A. Grachev (Donichev et al., 2018), V.N. Ovchinnikov (Ovchinnikov, 2016) |
The authors study the factors promoting innovation activity of the region, for the assessment of innovation potential they propose to use a mathematical apparatus based on the resource approach with the use of the correlation and regression method |
|
A. Bramanti, S. Tarantola (Bramanti, Tarantola, 2012) |
The authors consider methodology of innovation rating |
|
G. Carlino, W.R. Kerr (Carlino et al., 2014), E. Calik, F. Calisir, B. Cetinguc (Calik et al., 2017), M. Fraas (Fraas, 2004), M. Fritsch, R. Lukas (Fritsch, Lukas, 1991), M. Fritch (Fritch, 2002), Yu.S. Toktamysheva (Toktamysheva, 2015), T.F. Slaper, K.M. Harmon, B.M. Rubin (Slaper et al., 2018) |
The authors investigate the problem of assessing innovation potential at the regional level with an emphasis on the rating method of calculating the indicator |
|
L. Les a kov a (Les a kov a , 2011) |
The author discloses the process of forming a regional innovation strategy and assessing the level of innovation potential using the SWOT-analysis |
|
D.H.C. Chen, C.J. Dahlman (Chen, Dahlman 2006), J-M. Zabala-Iturriagagoitia, P. Voigt, F. Guti e rrez-Gracia, A. Jim e nez-S a ez, (Zabala-Iturriagagoitia et al., 2007) |
The authors propose models of innovation systems that allow determining the degree of their effectiveness by evaluating the level of innovation using different methods within the framework of the resource approach |
|
Source: own compilation. |
|
6 On approving the state program of the Russian Federation “Social and economic development of the Arctic zone of the Russian Federation”: RF Government Resolution 484, dated March 30, 2021 (amended October 30, 2021). Available at: (accessed: April 16, 2022).
7 On national goals and strategic objectives of the development of the Russian Federation for the period through to 2024: Presidential Decree 204, dated May 7, 2018. Available at: (accessed: April 18, 2022).
Based on the data in Table 2, we can conclude that the topic is relevant and discussed in the scientific community. The researchers emphasize the analysis of existing and the search for new methods for assessing innovation potential in the framework of the developed approaches. Let us turn to the research subject and consider the methodological basis for assessing the level of innovation potential.
Innovation potential: essence, approaches to assessment, methods
In the conditions of contemporary trends of the development of territories, innovation potential is important, as it is determinant when assessing the effectiveness of the selected territory, level of its competitiveness (Porter, 1985, р. 134; Armstrong, 1993, р. 245).
Currently, many scientists focus on the problem of the assessment of innovation potential at the microlevel (enterprise), mesolevel (region), macrolevel (state). Realizing the essence of the question, let us considering methodological aspects (the concept “innovation potential”, approaches, methods for its assessment).
Table 3 presents approaches to the concept “innovation potential”.
Table 3. Approaches to the concept “innovation potential”
|
Source |
Definition of “innovation potential” |
Approach to assessment |
|
GOST R 54147–2010 |
“A set of different types of resources, including material, financial, intellectual, information, scientific, technical, and other resources necessary for the implementation of innovative activity” |
Resource |
|
(Berdnikova, 2015, p. 69) |
“A set of resources, reserves, and capabilities that enable innovative activities, achieve innovative goals, and improve performance” |
Resorce-resulting |
|
(Gadzhiev et al., 2016, p. 238) |
“The ability of the territory to create, perceive and implement innovations in the course of socio-economic development” |
Resource, resulting |
|
(Zhits, 2000, p.164) |
“The amount of economic resources that at any given moment can be used by society for its development. These resources are distributed between three main sectors (segments, directions) of the macrosystem: science and technology, education, investment. The aggregate of these segments forms the innovation potential of the macrosystem” |
Resource |
|
(Izjumova, 2011, p. 169) |
“A set of interrelated conditions and resources that ensure the reproduction of scientific, technical and technological innovations, possibility of innovation as the most competitive strategy for sustainable development of the regional economy system” |
Resorce-resulting |
|
(Kravchenko, Kladchenko, 2003, p. 89) |
“A set of different types of resources required to carry out innovative activities” |
Resource |
|
(Mitrofanova, Bend’, 2006, p. 186) |
“A set of resource capabilities, technological, commercial, managerial competencies for the generation, distribution and use of innovations to modernize the economy of a region” |
Resource |
|
(Perevozchikova, Bagdasarova, 2020, p. 93). |
“A set of potentials (human, financial and economic, industrial, scientific and technical), which gives the opportunity to carry out intense activities aimed at the economic development of the territory” |
Resource |
|
(Prokofiev, 2011, p. 13). |
“The ability and readiness of the territory to provide a continuous innovation process through resources and efficiency” |
Resorce-resulting |
|
(Tatarkin, Novikova, 2015, p. 280) |
An integral set of natural-geographical, financial-economic, socio-psychological, socio-political, scientific and educational resources and opportunities to create and use innovations in a particular territory” |
Resource |
|
Source: own compilation. |
||
We can see that the concept of “innovation potential” has various interpretations; there is no common approach to the assessment of this indicator in the scientific environment. Let us comment on the different points of view, since this category is the basis for further research.
Based on the normative-legislative framework (national standard in the field of strategic and innovation management, GOST R 54147–2010), we propose to consider innovation potential through the prism of the resource approach, thereby involving different types of resources (factors) as structural elements. Many authors (Zhits, 2000; Kravchenko, Kladchenko, 2003; Mitrofanova, Bend’, 2006; Prokofiev, 2011; Tatarkin, Novikova, 2015; Perevozchikova, Bagdasarova, 2020) hold such an interpretation. It is worth emphasizing that among them only N.A. Perevozchikova, D.G. Bagdasarova propose to use not a “set of resources” but a “set of potentials” in terminology. In this context, innovation potential is a comprehensive characteristic, focused on the assessment of individual components (potentials), allowing the implementation of opportunities for the active development of innovation in the activities of territories.
According to the researchers (Berdnikova, 2015; Izjumova, 2011; Prokofiev, 2011) the term
“innovation potential” is based not only on the set of resources, but also on the assessment of the degree of effectiveness of innovation activities. This statement means that the studied definition is considered from the perspective of the resourceresult approach, which takes into account both factors and the final outcome of functioning.
According to Y.A. Gadzhiev, M.M. Styrov, D.V. Kolechkov, N.V. Shlyakhtina, innovation potential is the ability to create, perceive and implement innovations in practical activities (Gadzhiev et al., 2016). The authors do not emphasize the set of resources and efficiency, but imply that the basis for calculating the indicator is the performance and resource blocks, which include a certain list of factors.
Based on the analysis we can conclude that there is no consensus on the multidimensionality of the concept of “innovation potential” . We propose to consider innovation potential as a set of resources used by an entity for effective socioeconomic development of the territory, capable of implementing innovations in practice.
The researchers distinguish three main approaches to the assessment of innovation potential: resource, resulting, resource-resulting, which further form the information base for calculating its level (Tab. 4).
Table 4. Characteristics of the main approaches to assessing innovation potential
|
Approach |
Essence |
Advantages |
Disadvantages |
|
Resource |
It is popular in the scientific community, as in the lexical meaning of the word “potential” it is initially laid down that this is a set of certain resources aimed at the development of an object |
The opportunity to study the strengths and weaknesses of innovation processes, identify further growth prospects |
The use of a costly mechanism in the assessment of innovation potential; does not allow assessing the effect of innovation |
|
Resulting |
It is focused on determining a specific result from the use of available resources |
It makes it possible to quantify the result of innovative activity |
It is impossible to determine and compare the degree of effectiveness of innovation activities due to the lack of information about the necessary resources |
|
Resource-resulting |
It represents a synthesis of resource and performance approaches |
It provides an opportunity to assess the effectiveness of innovation activity; determines the structure of potential in the context of two directions (resources and results) |
It requires the collection of information on two blocks: resource and effective |
|
Source: own compilation. |
|||
Within the framework of these approaches, the authors use different methods of assessment: integral, rating, factor, matrix, cluster. Let us dwell on their features.
We can carry out integral assessment of innovation potential using the following methods: expert, normative, index, correlation and regression. They both have advantages and disadvantages (Tab. 5).
To evaluate the innovation development level, the application of the integral method can be complemented by the rating method. The articles (Arkhipova, Gagarina, 2014, p. 12; Bakhtizin et al., 2016, p. 14; Gusev, 2009, p. 165) describe foreign and Russian methods for assessing innovation potential, which have a rating character. We should emphasize that there is no universally accepted approach to ranking. The advantage of such methods is the determination of the integral index with the use of a specific set of indicators (the list depends on the chosen methodology). However, there are problems associated with the lack of statistical data or comparability of indicators, which leads to the impossibility of differentiating the territories by the studied integral index.
Recently, the cluster method of assessing the innovation potential level based on the k-means method has gained popularity (Gadzhiev et al., 2016, p. 240; Kormishkina, Koloskov, 2017, p. 222; Kuznetsova, 2017, p. 163). Indicators grouped by blocks are used for calculation. The authors form the list of indicators by themselves. It is proposed to allocate clusters according to different criteria, for example with high, increased, average, low innovation activity (Gadzhiev et al., 2016, p. 245; Kuznetsova, 2017, p. 167) or according to the value of the “index of knowledge economy of the region” (Kormishkina, Koloskov, 2017, p. 228). However, the scientists do not specify the gradation by which they carry out the positioning of territories.
The matrix method usually focuses on two indicators. In the article (Gubanova, Moskvina, 2020, p. 49), innovation potential is considered as a result component, investment potential – as a resource component (resource-resulting approach). Each structural element includes partial potentials
Table 5. Methods of integral assessment of innovation potential
The analysis of methods for assessing the innovation potential level shows that there is no single approach to solving this complex problem. The issue is debatable, requiring deep reflection. When developing a methodology for assessing innovation potential, most often researchers focus on the resource approach, using different combinations of methods (integral and rating, integral and cluster, integral and matrix, factor and rating) in its framework.
The author’s methodology for assessing innovation potential is focused on the use of a combination of integral and rating methods as part of the resource approach. This solution is considered to be appropriate. First, the integral method provides a comprehensive assessment of the innovation potential level. At the same time, it is important to take into account the list of included indicators influencing the value under consideration, the features of the tools used. The study proposes using the index method, which gives an objective assessment of factors, allows making a comparative analysis of relative indicators. Second, the rating method is used to rank the regions, which provides a quantitative assessment of the level of innovation activity in a particular territory.
Methodological foundations of the research
The mentioned problem and the subject of the research lead to the conclusion that it is necessary to complement and expand the tools to assess the level of innovation potential of the region.
The developed methodology for assessing innovation potential is based on the resource approach, as during the review of the conceptual apparatus, we have determined that innovation potential is a set of resources, which are used by a subject for effective socio-economic development of the territory.
The algorithm for assessing the innovation potential level includes the following stages: preparatory, calculation and analytical, and final.
The preparatory stage is aimed at selecting and substantiating the indicators necessary for calculating private potentials. Our methodology assumes that the innovation potential level is estimated with the help of factors (private potentials), included in the following blocks: personnel-educational potential, scientific potential, information potential, and economic potential. Each block contains a certain list of indicators (Tab. 6) , formed taking into account the selected resource. The personnel-educational block contains indicators that take into account the level of development of higher education, the degree of specialists’ training in the region and their demand, the scientific potential – the level of research and development results, the information potential – the degree of digitalization of the territory, and the economic potential – the ability to function effectively in market conditions.
The selection of these very indicators in each block makes it possible to evaluate private potentials and ensure calculation of innovation potential of the territory. The information base for the assessment and analysis of the innovation potential level is statistical information8.
At the second stage (calculation and analytical) , we calculate individual indices (i) for each block; as the basis we take the maximum values from the array of data on a particular indicator. The exception is the indicator “degree of fixed assets depreciation”
Table 6. List of indicators of innovation potential by blocks
The weights of the indicators in the blocks are taken equal. Such a decision means that the parameters presented in Table 6 are equivalent in assessing the innovation potential level and the list does not include insignificant indicators. Thus, the subindices (S) (personnel-educational potential, scientific potential, information potential, economic potential) represent the arithmetic average of individual indices. To visualize the obtained results, we use a petal diagram, which contains the subindices by region.
The integral indicator of innovation potential ( I ) is a weighted average of the four subindices (S1,
S2, S3, S4). The significance (weight) of the subindices is calculated as the ratio of the number of indicators included in a particular block to the total number of indicators for all blocks (formula 1). The personnel-educational potential includes 4 indicators, the scientific potential – 6 indicators, the informational potential – 3 indicators, the economic potential – 5 indicators. The total number of indicators is 18.
I = - x 51 + - * 52 + - * 53 + - x 54 . (1) 18 18 18 18
Subindex S2 (scientific potential) has the greatest importance in formula (1), the least is S3 (informational potential). Subindices S1 (personnel-educational potential) and S4 (economic potential) are intermediate values. It can be explained by the fact that when calculating the individual subindices, a different number of indicators are used, the list of which was determined by taking into account the importance and materiality.
At the third stage (final stage), we form an array of calculated data of the indicators of innovation potential of the studied entities of Russia, included in the Arctic zone. It makes it possible to rank and compare the territories by the degree of innovation potential. The interpretation of the values of the innovation potential level in the author’s methodology has 5 levels: critical (unacceptable) ( I < 0.3), low (0.3 ≤ I < 0.5), medium (0.5 ≤ I < 0.8), increased (0.8 ≤ I < 0.9), and high (0.9 ≤ I ).
The methodology introduces the concept of “quality indicator of the innovation potential level”. The indicator is the ratio of the value of the innovation potential level of a particular region to the value of the innovation potential level of the leading region. The proposed indicator varies in the range from 0 to 1 inclusive. The value equal to 1 indicates the leading position by the presented indicator. The value less than 1 indicates the degree of lagging behind the region.
The proposed indicator makes it possible to assess the gap between the leading region and the evaluated region, but this requires the formation of an array of data on the constituent entities.
We propose to cluster the regions using four private potentials, to group the territories by level of innovation potential, to identify leaders and outsiders in order to substantiate proposals to stimulate key areas in innovation activity. The use of k-means method excludes the weighting of private potentials for the calculation of innovation potential, as we propose in our methodology. The calculations use individual indices that have the same degree of significance. Comparison of the results obtained by our method and the method of k-means will allow estimating the degree of divergence of the results and the practical significance of the model.
Research results
Based on the described methodology, we assess the innovation potential of the regions included in the RF Arctic zone, in order to carry out a comparative analysis and further ranking of the territories.
Table 7 summarizes the information by block including data for 2020, necessary to assess the innovation potential level.
Table 7. Indicators of innovation potential by blocks in the regions, in the RF Arctic zone
|
Indicators |
о Е Л |
О |
о "го Е |
2 < л« |
го |
Е |
"го го |
го (Z) £ |
|
1. Personnel-educational potential |
||||||||
|
Change in the average annual number of employees, % to the previous year |
96.1 |
100.2 |
98.6 |
97.5 |
97.7 |
95.6 |
97.1 |
97.5 |
|
Employment rate, % |
61.5 |
76.2 |
72.1 |
53.7 |
53.5 |
57.0 |
58.9 |
62.7 |
|
Number of academic staff of organizations carrying out educational activities on bachelor’s, specialist’s and master’s degree programs, persons |
358 |
4 |
12 |
987 |
736 |
547 |
4486 |
1532 |
End of Table 7
Indicators о Е 2 О о "го Е О о л ™ го Е "го го го (Z) Number of students enrolled in bachelor’s, specialist’s and master’s degree programs, per 10 thousand people 90 28 7 153 177 170 233 242 2. Scientific potential Issuance of patents for invention, units 23 0 27 56 38 32 326 54 Internal expenditures on research and development, million rubles 2837.4 -* 224.8 1574.6 1062.1 2097.7 26588.1 3076.2 Number of organizations which performed research and development, units 35 7 7 34 19 25 71 31 Number of personnel engaged in research and development, people 1988 -* 135 999 1113 1468 8334 2140 Level of innovation activity of organizations, % 9.4 6.7 5.9 4.4 7.0 8.0 6.7 8.6 Expenditures on innovation activities, million rubles 3438.5 70.0 1419.6 1930.0 4748.6 5423.3 53845.9 6544.3 3. Information potential Use of digital technology in organizations (organizations that use personal computers), % 79.4 87.1 80.1 84.6 87.4 79.2 80.1 80.2 Number of personal computers per 100 employees, units 53 54 41 50 62 53 53 51 Use of the Internet by population, % of the total population of the entities 90.7 93.1 95.3 83.7 86.5 84.0 83.8 94.3 4. Economic potential Investment volume in fixed capital, billion rubles 191.1 31.6 1075.3 198.8 56.9 140.4 478.8 221.7 GRP per capita, thousand rubles 828.4 1898.6 5710.5 780.6 527.8 873.1 938.0 1258.7 Population growth rate, % 98.8 98.5 100.5 99.2 99.7 99.2 99.6 101 Indices of industrial production, % 101.0 101.0 100.5 93.2 105.5 91.2 91.2 95.3 Depreciation degree of fixed assets, % 42.7 48.9 57.3 54.8 53.8 55.1 46.7 57.3 * Data are not published in order to ensure the confidentiality of primary statistical data received from organizations in accordance with Federal Law 282-FZ, dated November 29, 2007 “On official statistical records and the state statistical system in the Russian Federation” (Paragraph 5 of Article 4, Part 1 of Article 9). Source: Federal State Statistics Service. Available at:
It is worth noting that there are no data for Chukotka AO on the indicators “Internal expenditures on research and development”, “Number of personnel engaged in research and development” in the section “Scientific potential”. As a consequence, the calculation of the innovation potential level in this Russia’s entity is limited and can affect the results of the final calculations.
Table 8 shows the calculation of individual indices, subindices and the integral index of innovation potential by regions using our methodology (formula 1).
According to the data in Table 8, the integral index of innovation potential in the regions does not exceed 1. The interpretation of the values of the innovation potential level in our methodology indicates that the Arctic territories are regions with
Table 8. Individual indices, subindices and integral index of innovation potential in the regions of the RF Arctic zone
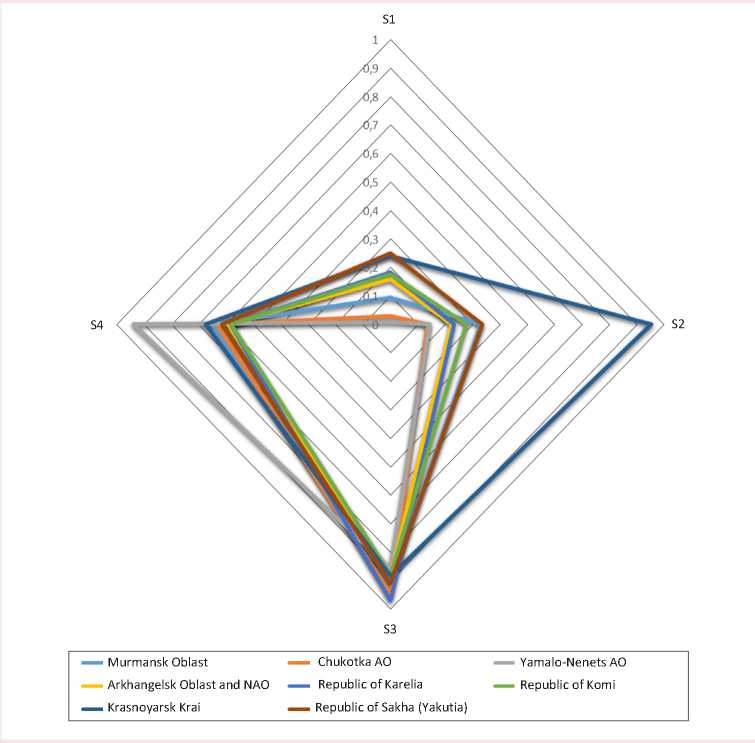
To visualize the results, we use a radar chart containing subindices (private potentials) by region (Fig.) .
We can see that the values of the subindices for the blocks of personnel and educational potential ( S1 ), scientific potential ( S2 ), and economic potential ( S4 ) do not exceed 0.5 or slightly deviate from this level. The exceptions are Krasnoyarsk Krai ( S2 = 0.952), Yamalo-Nenets AO ( S4 = 0.940). The information potential ( S3 ) in all the regions tends to unity.
Table 9 presents the ranking of the regions included in the RF Arctic zone, according to the innovation potential level and gives the values of the quality indicator of the innovation potential level.
The leading region by the innovation potential level is Krasnoyarsk Krai. The last and penultimate places in the rating are occupied by Chukotka AO and the Arkhangelsk Oblast and NAO. The results of the calculations for Chukotka AO require commenting, as there is no information on individual indicators of the block “Scientific potential”, which leads to an underestimation of the S2 subindex and a decrease in the innovation potential level.
Subindices of innovation potential of the regions included in in the RF Arctic zone
Source: own compilation based on Rosstat data.
Table 9. Ranking of regions in the Arctic zone of RF according to the innovation potential level
|
Entity |
Quality indicator of innovation potential level |
Rating regions |
|
Krasnoyarsk Krai |
1.000 |
1 |
|
Republic of Sakha (Yakutia) |
0.694 |
2 |
|
Murmansk Oblast |
0.655 |
3 |
|
Yamalo-Nenets AO |
0.643 |
4 |
|
Republic of Karelia |
0.627 |
5 |
|
Republic of Komi |
0.623 |
6 |
|
Arkhangelsk Oblast and NAO |
0.597 |
7 |
|
Chukotka AO |
0.547 |
8 |
|
Source: own compilation based on Rosstat data. |
||
We should emphasize that the territories considered in the work by the quality indicator of the innovation potential level insignificantly differ from each other, there is a scatter of values from 0.547 to 0.694 (see Tab. 9). Consequently, the development of the regions is in general even. The exception is Krasnoyarsk Krai, which occupies the leading position.
Let us refer to the k-means method to assess the practical significance of our methodology. Within the framework of the use of the cluster method by private potentials: personnel-educational potential (S1) , scientific potential (S2) , information potential (S3) , economic potential (S4) , we allocate two clusters. The first cluster includes the Murmansk Oblast, the Arkhangelsk Oblast and NAO, the Republic of Karelia, the Republic of Komi, Krasnoyarsk Krai, the Republic of Sakha (Yakutia), the second cluster is Chukotka AO, Yamalo-Nenets AO.
The application of the cluster method has led to the conclusion that the outsiders are Chukotka AO and Yamalo-Nenets AO. According to our method with the cluster method, we record differences in the calculations for two entities: the Arkhangelsk Oblast and NAO and Yamalo-Nenets AO, as in our method the significance of the block “Economic potential” is high (formula 1), and in the cluster method the weights of all indicators are of equal value.
As a result, in our methodology the subindex (S4) significantly influenced the integral index of innovation potential and brought Yamalo-Nenets AO to the 4th place in the rating, and the Arkhangelsk Oblast and NAO – to the 7th place. The discrepancy in the results cannot negatively affect the expediency of the application of the methodology. It is possible to expand the list of indicators included in the blocks “Personnel-educational potential” (S1) and “Information potential” (S3) .
Thus, the proposed methodology makes it possible to assess the innovation potential using integral and rating methods in the framework of the resource approach. The methodology has the following advantages: easy to use, provides accessibility in obtaining relevant, reliable statistical information on the studied particular indicators, makes it possible to rank the regions and conduct a comparative analysis of territories in order to identify problems associated with innovation development.
Innovative activities in the RF Arctic zone
According to the research results, the regions of the RF Arctic zone are referred to the territories with low innovation activity. Using the numerical material obtained in the course of testing the methodology, we present a qualitative assessment of the innovation potential level of the Arctic territories of Russia’s entities (Tab. 10).
Table 10. Qualitative assessment of innovation potential level of the regions of the RF Arctic zone
|
RF constituent entity |
Qualitative assessment of innovation potential level |
|
Krasnoyarsk Krai |
It is an innovatively developed region. High level of personnel-educational, scientific and digital potentials. However, it is worth noting that the innovation structure is concentrated in large cities and its impact on the growth of peripheral Arctic territories is insignificant. Innovation structure includes a cluster, business incubators, innovation and technology centers, territories of advanced socio-economic development, innovation centers, information centers, centers of collective use and other facilities. The region is a leader in terms of investment needs. Innovation activity is associated with the mining industry. |
|
Republic of Sakha (Yakutia) |
There is an average level of innovation activity, but at the expense of territories outside the RF Arctic zone. Particular attention is paid to diamond and gold mining, electric power industry, fuel industry. The entity has a high level of economic potential. Innovation structure includes a cluster, business incubator, innovation center, territories of advanced socio-economic development. |
|
Murmansk Oblast |
It has positive trends in the region’s development, high level of scientific and digital potential. The region has well-developed transport infrastructure (ports, airports, an extensive network of rail and road transport), industrial enterprises. Innovative development is carried out in the following sectors: energy, transport, extraction and transportation of hydrocarbon raw materials. Innovation structure includes a cluster, business incubator, innovation center, territories of advanced socio-economic development. |
|
Yamalo-Nenets AO |
The region has low human resources and educational and scientific potential. It is worth noting that the Sabetta sea port, railway transport corridors and airports have been actively developed recently. Innovative development is aimed at the growth of the fuel-industrial complex, processing and transportation of hydrocarbons. Innovation structure is represented by technoparks, innovation and technology center, and funds. |
|
Republic of Karelia |
The region has the average level of personnel-educational, scientific potentials. Active development of timber, woodworking, mining industry, fishery, fur farming. Innovation structure includes a cluster, business incubator, innovation center, territories of advanced socio-economic development. |
|
Republic of Komi |
The region has a low level of scientific, personnel-educational potential. Remoteness of the Arctic territories from the center. Development of fuel and energy complex (oil production, oil refining, gas, coal and electricity industries), reindeer breeding. Innovation structure consists of a cluster, business incubator, innovation center, territory of advanced socio-economic development, technology transfer centers. |
|
Arkhangelsk Oblast and NAO |
The Arkhangelsk Oblast is considered together with NAO, as a result, the indicators of innovation activity are not high. Innovation infrastructure consists of scientific-educational and technological complexes with the participation of the Northern (Arctic) Federal University, technoparks and business incubators. There is a low scientific-educational potential in Nenets AO, poorly developed transport logistics. Innovative development and modernization of the economy of the region is carried out in the following sectors: agriculture, energy, housing and communal services, transport, extraction and transportation of hydrocarbons. Particular attention is paid to the implementation of innovations at the enterprises of timber and agro-industrial complexes, shipbuilding. |
|
Chukotka AO |
It is the lowest level of personnel-educational and scientific potential (harsh climatic conditions, low population density, mono-industrial character of industry development: mining industry). The main areas of agriculture in the region are reindeer breeding and hunting. Innovative structure consists of the territory of advanced socio-economic development. |
Source: own compilation.
To summarize, we should emphasize that in the Arctic regions there is an innovative development of the following industries: energy, transport, extraction and transportation of hydrocarbon raw materials. This is due to the features of the territories: rich mineral deposits, orientation of the economy on hydrocarbon production, export of resources to other Russia’s entities and abroad, dependence on supplies of vital goods and food, underdeveloped transport network, focal nature of territory development and conducting industrial and economic activity. Therefore, the main directions of innovation policy can include the improvement of mining technology, search for alternative energy sources, development of transport system (timely modernization and expansion of port, railway infrastructure, regional aviation, application of digital technologies in transport logistics), intensification of agriculture to improve food security. It is important to carry out systematic work not only in the regional centers, but also on the periphery ensuring the integrated development of territories.
Sustainable and stable growth of the regions requires dynamic and purposeful work consisting in the preparation and implementation of programs related to innovation and investment activities. Regional government should set achievable targets in the state programs aimed at innovative development and modernization of the economy. The main thing is to improve the quality of planning targets taking into account the current and future situation.
This approach will make it possible to introduce the latest technology, create additional jobs, reduce unemployment, increase tax revenues to regional budgets, improve the socio-economic condition of the entities, increase the attractiveness of the Arctic territories and the quality of life, thereby reducing migration outflows to other Russian regions.
The effective innovative development of territories requires not only qualitative normative-legislative base, but also the presence of innovative structures in the regions. Particular attention should be paid to the production and technological component: clusters, technology parks, innovation and information centers, business incubators and other significant objects.
Conclusions
In conclusion, we should highlight that in modern conditions of functioning of the regional economy special attention should be paid to the issue of innovative development of territories. This approach gives a powerful impetus to the creation of favorable conditions for sustainable growth and improvement of socio-economic systems (regions), makes it possible to carry out forecasting, analysis, monitoring of the functioning of entities, to develop measures to increase their innovation activity.
The theoretical foundations of the study consist in the consideration of the methodological aspects of assessing the region’s innovation potential. We analyze the term “innovation potential” and confirme the existence of a variety of interpretations and ambiguity of judgments about it. It allows substantiating the relevance of the research, identifying the main approaches to assessing the innovation potential level, analyzing the existing methods used in the resource, performance and resource-result approaches, and proposing a methodology to assess innovation potential.
We have carried out the testing on the statistical data of the regions included in the RF Arctic zone. The methodology makes it possible to obtain a ranked array including the assessment of the innovation potential level by entities, and to make their rating by the studied indicator.
The spatial analysis of the innovation potential level of the territories of the RF Arctic zone reveals the following:
– generally equal innovative development of the regions; the exceptions are Chukotka AO (the outsider – 8th position in the rating) and Krasnoyarsk Krai (the leader – 1st position in the rating);
– low level of the studied indicator due to the features of regional development: low degree of development, uneven location of settlements and production facilities, remoteness of facilities from the main transport routes (large areas and hard-to-reach places);
– focus on a single-sector nature of the economy;
– emphasis on the intensification of innovations in energy, transport, production and trans- portation of hydrocarbons (the Northern Sea Route currently determines the trajectory of the national economy);
– disproportions in the spatial dislocation of the innovation structure (absence in the peripheral Arctic territories and concentration in the regional centers).
The results of the study can be used in the process of making managerial decisions related to the development of the regional economy. The prospective direction of work consists in expanding the list of evaluated factors and testing the methodology on the statistical indicators of other Russia’s federal districts.
References Innovation potential of regions within the Arctic zone of the Russian Federation: assessment methodology, comparative analysis, development prospects
- Arkhipova L.S., Gagarina G.Yu. (2014). Approaches to estimating the innovational economics development in the regions of Russia. Vestnik Udmurtskogo universiteta. Seriya Ekonomika i pravo=Bulletin of Udmurt University. Series Economics and Law, 4, 7–17 (in Russian).
- Armstrong H. (1993). Regional Economics and Policy. New York.
- Bakhtizin A.R., Bukhvald E.M., Kolchugina A.V. (2016). Ranking the subjects of the Russian Federation based on their potential and rates of socio-economic development. Region: Ekonomika i sotsiologiya=Region: Economics and Sociology, 2(90), 3–22. DOI: 10.15372/REG20160201 (in Russian).
- Berdnikova L.F. (2015). Resource component of innovative development of a modern organization. Vektor nauki Tol’yattinskogo gosudarstvennogo universiteta=Science Vector of Togliatti State University, 1(31), 65–69 (in Russian).
- Bramanti A., Tarantola S. (2012.) Regional Innovation Index Regional Champions within National Innovation Systems. Luxembourg: Publications Office of the European Union.
- Calik E., Calisir F., Cetinguc B. (2017). A scale development for innovation capability measurement. Journal of Advanced Management Science, 5(2), 69–76. DOI: 10.18178/joams.5.2.69-76
- Carlino G., Kerr W.R. (2014). Agglomeration and innovation. NBER Working Paper Series, 20367, 1–62.
- Chen D.H.C., Dahlman C.J. (2006). The Knowledge Economy, the KAM Methodology and World Bank Operations. Washington: World Bank Institute.
- Donichev O.A., Fraimovich D.Yu., Grachev S.A. (2018). Regional system of economic and social factors in the formation of innovation development resources. Ekonomicheskie i sotsial’nye peremeny: fakty, tendentsii, prognoz=Economic and Social Changes: Facts, Trends, Forecast, 11(3), 84–99. DOI: 10.15838/esc.2018.3.57.6 (in Russian).
- Ershova I.G., Guselnikova L.N. (2020). Assessment of the innovative potential of the region in the conditions of the digital economy. Estestvenno-gumanitarnye issledovaniya=Natural-Humanitarian Studies, 32(6), 175–180. DOI: 10.24412/2309-4788-2020-10709 (in Russian).
- Fraas M. (2004). Oslo Innovation Scoreboard. Revealed Regional Summary Innovation Index for the Oslo Region. Oslo.
- Fritch M. (2002). Measuring the quality of regional innovation systems: A knowledge production approach. International Regional Science Review, 25, 86–101.
- Fritsch M., Lukas R. (1991). Innovation, cooperation, and the region. In: Audretsch D.B., Thurik R. (Eds.). Innovation, Industry Evolution and Employment. Cambridge: Cambridge University Press.
- Gadzhiev Yu.A., Styrov M.M., Kolechkov D.V., Shlyakhtina N.V. (2016). Analysis of innovation potential of northern Russian regions. Ekonomicheskie i sotsial’nye peremeny: fakty, tendentsii, prognoz=Economic and Social Changes: Facts, Trends, Forecast, 6(48), 236–254. DOI: 10.15838/esc.2016.6.48.13 (in Russian).
- Gubanova E.S., Moskvina A.S. (2020). Methodological aspects of the assessment of the investment and innovation potential of a region. Ekonomicheskie i sotsial’nye peremeny: fakty, tendentsii, prognoz=Economic and Social Changes: Facts, Trends, Forecast, 13(2), 41–55. DOI: 10.15838/esc.2020.2.68.3 (in Russian).
- Guselnikova L.N. (2020). Factors influencing the dynamics of the region’s innovative potential. Vestnik Akademii znanii=Bulletin of the Academy of Knowledge, 6(41), 99–105. DOI: 10.24412/2304-6139-2020-10768 (in Russian).
- Gusev A.B. (2009). Formation of ratings of innovative development of Russian regions. Nauka. Innovatsii. Obrazovanie=Science. Innovations. Education, 4(1), 158–173 (in Russian).
- Izjumova O.N. (2011). Management toolkit in innovative potential of region in the conditions of it is steady-reproduction developments (on materials of the Volgograd region). Terra Economicus, 9(4-3), 168–172 (in Russian).
- Kormishkina L.A., Koloskov D.A. (2017). Innovation approaches to the formation of investment policy tools from the perspective of a neo-industrial economic development paradigm. Ekonomicheskie i sotsial’nye peremeny: fakty, tendentsii, prognoz=Economic and Social Changes: Facts, Trends, Forecast, 10(6), 218–233. DOI: 10.15838/esc.2017.6.54.14 (in Russian).
- Kotikhina O.F. (2007). Methodological approaches to assessing innovation potential. Vestnik Yuzhno-Ural’skogo gosudarstvennogo universiteta. Seriya: Ekonomika i menedzhment=Bulletin of the South Ural State University. Economics and Management, 17(89), 32–37 (in Russian).
- Kravchenko S.I., Kladchenko I.S. (2003). Studying the essence of innovation potential. Nauchnye trudy Donetskogo tekhnicheskogo universiteta. Seriya: Ekonomicheskaya, 68, 88–96 (in Russian).
- Kuznetsova N.V. (2017). Potential for Asia-Pacific countries innovative development. Ekonomicheskie i sotsial’nye peremeny: fakty, tendentsii, prognoz=Economic and Social Changes: Facts, Trends, Forecast, 10(3), 150–170. DOI: 10.15838/esc.2017.3.51.8 (in Russian).
- Lesáková L. (2011). The process of forming the regional innovation strategy. Acta Polytechnica Hungarica, 8(1), 5–22.
- Mitrofanova I.V., Bend’ A.S. (2006). Innovation potential of the region: Problems of formation and use. In: Sbornik materialov mezhdunar. nauch.-prakt. konf. “Upravlenie innovatsiyami” [Proceedings of the International Scientific and Practical Conference “Innovation Management”]. Moscow: Dobroe slovo (in Russian).
- Ovchinnikov V.N. (2016). The system-supplementing effect of the interaction between innovative capacity and institutional environment factors of a region. Ekonomika regiona=Economy of Region, 12(2), 537–546. DOI: 10.17059/2016-2-18 (in Russian).
- Perevozchikova N.A., Bagdasarova D.G. (2020). Innovative potential of the region: Essence and methodological approaches to its assessment. Vestnik Instituta ekonomicheskikh issledovanii=Vestnik of Institute of Economic Research, 3(19), 91–99 (in Russian).
- Porter M. (1985). Competitive Advantage. New York: The Free Press.
- Prokofiev K.Yu. (2013) Innovative capacity of the region: Essence, structure. Regional’naya ekonomika: teoriya i praktika=Regional Economics: Theory and Practice, 30(309), 12–18 (in Russian).
- Slaper T.F., Harmon K.M., Rubin B.M. (2018). Industry clusters and regional economic performance: A study across U.S. metropolitan statistical areas. Economic Development Quarterly, 32(1), 44–59. DOI: 10.1177/0891242417752248
- Tatarkin A.I., Novikova K.A. (2015). Territorial innovative potential in behavioral assessment of the population. Ekonomika regiona=Economy of Region, 3(43), 279–294. DOI: 10.17059/2015-3-23 (in Russian).
- Toktamysheva Yu.S. (2015). Indicators of innovative development of regions of the Russian Federation in the analysis of the potential of their economic growth. Vestnik Belgorodskogo gosudarstvennogo tekhnologicheskogo universiteta im. V.G. Shukhova=Bulletin of BSTU named after V.G. Shukhov, 3, 153–158 (in Russian).
- Zabala-Iturriagagoitia J-M., Voigt P., Gutiérrez-Gracia, F.Jiménez-Sáez A. (2007). Regional innovation systems: How to assess performance. Regional Studies, 41(05), 661–672.
- Zhits G.I. (2000). Innovatsionnyi potentsial i ekonomicheskii rost [Innovation Potential and Economic Growth]. Saratov: Saratovskii gosudarstvennyi tekhnicheskii universitet.
