Innovation Potential of the Arctic Regions of Russia

Author: Tsukerman V.A., Goryachevskaya E.S.
Journal: Arctic and North @arctic-and-north
Section: Social and economic development
Article in issue: 49, 2022.
Free access
The paper provides a comparative analysis of foreign and Russian methodologies for assessing innovation potential. It is shown that foreign methodologies cannot be used to determine the innovation potential of the Arctic regions of Russia due to specific indicators that are not calculated by Russian statistics. It is determined that the use of Russian methodologies for an objective assessment of the Arctic regions in terms of innovation potential is difficult. In this regard, the authors developed a comprehensive methodology for assessing innovation potential, the principal novelty of which consists, firstly, in the use of specific indicators (in other methods, the authors use not specific, but absolute statistical indicators); secondly, only indicators that characterize innovation development are used; thirdly, expert research methods are excluded. According to the results of the analysis of statistical data, it is determined that the Arctic regions have low rates of innovation development and lag behind the average Russian values. Based on the proposed methodology, the innovation potential was calculated and the Russian regions were ranked for ten years, including 2011, 2013, 2017 and 2020, in order to compare the dynamics of the Arctic regions. It is shown that the Arctic regions are characterized by rather low values of innovation potential and are mostly below 50th place in the ranking of Russian regions.
Innovation potential, Arctic region, methodology, ranking, assessment, rating
Short address: https://sciup.org/148329264
IDR: 148329264 | UDC: [332.14:338.45-048.57:001.895](985)(045) | DOI: 10.37482/issn2221-2698.2022.49.70
Text of the scientific article Innovation Potential of the Arctic Regions of Russia
Innovative potential and implementation of innovative projects are of paramount importance for supporting sustainable economic growth and competitiveness of the Arctic regions [1].
Monitoring of innovative development of the Arctic economic systems is the basis for formation of innovative activities, taking into account the peculiarities of the territories.
Literature review and research methodology
Recently, much attention has been paid to the study and evaluation of the innovative development of countries and regions. Foreign organizations have developed various assessment methods at the country level, including the Commission of the European Communities — Innovation index 1 , the World Bank — Knowledge index 2 , the Organization for Economic Cooperation and
* © Tsukerman V.A., Goryachevskaya E.S., 2022
Development — Knowledge, Technology and Industry index 3, the World Economic Forum — subindex of the Global Competitiveness index 4, INSEAD — Global Innovation index 5. Some methods were developed by foreign specialists, such as B. Lundvall [2], M. Fisher [3], R. Nelson [4], K. Freeman [5].
Foreign methodologies use specific indicators that are not calculated by Russian statistics in a territorial context, for example, expenditures of private companies on research and development, industrial value added, total business density. Many indicators are based on the results of surveys of company executives, which are not included in the statistical reporting. Thus, the methodology cannot be used to determine the innovative potential of the Russian Arctic regions.
Foreign methodologies, due to specific indicators that are not calculated by Russian statistics, cannot be used to determine the innovative potential of the Russian Arctic regions. In this regard, organizations have developed appropriate Russian methodologies. Thus, the Higher School of Economics annually forms an innovation rating of regions based on 53 different indicators that characterize the scientific and technical potential, innovation activity, socio-economic status, export activity and the quality of innovation policy [6]. The regions were ranked in four groups within the framework of descending values from the leading region. According to the 2018–2019 ranking, the first group with the highest rating was made up of six regions: Moscow, St. Petersburg, the Republic of Tatarstan, Tomsk, Nizhniy Novgorod and Moscow oblasts. The second group includes the Murmansk Oblast, which occupies 41st place. The third group includes the Yamalo-Nenets Autonomous Okrug (61st place). The lowest fourth group includes the Nenets and Chukotka Autonomous okrugs, which occupy 84th and 85th place out of 85, respectively.
The Innovation Index, developed by the Center for Strategic Research “North-West”, provides for the calculation of 15 indicators combined into four groups on human capital, innovative products, creation of new knowledge, and application of knowledge 6. According to the latest data for 2016, Moscow, St. Petersburg, Nizhniy Novgorod Oblast occupy the first three places. The next three places are occupied by the Republic of Tatarstan, Tomsk Oblast, Moscow Oblast. The Arctic regions occupy places in the second half of the ranking. Thus, the Murmansk Oblast ranks 44th, the Yamalo-Nenets Autonomous Okrug — 70th, the Chukotka Autonomous Okrug — 79th, the Nenets Autonomous Okrug — 83rd.
Expert RA rating agency calculates the investment potential innovation index according to 9 indicators that characterize the development of the scientific and technical sphere and innova- tion activity 7 [7]. According to the results of 2020, according to the criterion of innovative potential, Moscow takes the 1st place, the Moscow Oblast — the 2nd place, St. Petersburg — the 3rd place, the Nizhniy Novgorod Oblast — the 4th place, the Republic of Tatarstan — the 5th place, the Novosibirsk Oblast — the 6th place. As for the Arctic regions, the Yamalo-Nenets Autonomous Okrug ranks 49th, the Murmansk Oblast — 63rd, the Nenets Autonomous Okrug — 84th, the Chukotka Autonomous Okrug — 85th.
The Association of Innovative Regions of Russia calculates the rating of regions based on 29 indicators, which are divided in four areas: socio-economic, research and development, innovative activity, innovative performance 8 . The latest data on the ratings of regions is presented for 2018. St. Petersburg has the highest rating, the Republic of Tatarstan is the second, Moscow is the third, Tomsk Oblast is the fourth, Moscow Oblast is the fifth, and Novosibirsk Oblast is the sixth. The Arctic regions — the Murmansk Oblast, the Yamalo-Nenets, Nenets and Chukotka Autonomous okrugs — occupy 59th, 70th, 83rd and 84th place out of 85, respectively.
Russian scientists have developed original methods for assessing innovative potential. Thus, the work of A.A. Bykova and M.A. Molodchik [8] proposes an assessment of innovation potential on the basis of 13 indicators characterizing human resources, creation, as well as transfer and application of knowledge, implementation of innovation. The authors carried out the study only for ten regions, the Arctic regions were not included.
T.S. Zimnyakova [9] suggests applying the methodology based on 70 indicators, united in three blocks on formation, use, dissemination of innovation technologies and new knowledge to assess innovation potential of the regions, providing raw material specialization. Assessment of the innovative potential of 22 selected regions was carried out in 2016. The first three places were taken by the Republic of Tatarstan, the Samara Oblast and the Tyumen Oblast. The Arctic regions (Murmansk Oblast, Nenets, Yamalo-Nenets and Chukotka Autonomous okrugs) took 9th, 19th, 20th and 21st places out of 22, respectively.
-
I.S. Vladimirova [10] proposes to use a methodology of assessing innovative potential based on four blocks of indicators that characterize scientific personnel and the effectiveness of research, the effectiveness of innovative activities. The paper assessed and presented 10 leading regions in terms of innovation potential. The first place was taken by Moscow, the second — by St. Petersburg, the third — by the Republic of Tatarstan.
-
S.V. Makar and A.M. Nosonov [11] propose a typology of Russian regions in terms of innovative development based on three blocks of indicators: objects of innovative infrastructure, scientific and technical potential, and innovative activity. All regions are divided into four groups in decreasing order of innovative potential. Calculations were made for 2015.
The monograph [12] considers a methodology for assessing the scientific and innovative potential based on 19 indicators divided into 4 blocks (scientific personnel, research funding, formation of scientific personnel, innovative potential). According to 2000–2006 data, Northern regions are grouped into 4 clusters, the Murmansk Oblast is assigned to the second cluster with an average level of scientific and innovative potential, the Chukotka, Nenets and Yamalo-Nenets Autonomous okrugs — to the fourth cluster with a low level of potential.
-
V.K. Zausaev, N.Yu. Krivoruchko and S.P. Bystritskiy [13] propose a methodology that allows assessing the innovative potential of regions. The calculation is made according to five groups of indicators that have a direct impact on the implementation of innovative activities (legal, macroeconomic, economic, infrastructural, personnel).
-
S.V. Panikarova and M.V. Vlasov [14] suggest assessing innovation potential by three components, including the knowledge index, economic and social position of the region. The Northern and Arctic regions are divided into groups. The first group (with high potential) includes the Murmansk Oblast. The fourth group (with low potential) includes the other three Arctic regions.
E.S. Gubanova and O.S. Moskvina [15] propose to evaluate the investment and innovation potential on the basis of 7 evaluation blocks (labor, production, material and technical, financial, educational, scientific and technical, information and communication potential). According to the data for 2017, the regions of Russia are divided into 9 groups according to potential reduction. The Murmansk Oblast was in the sixth group “Problem regions”. Chukotka, Nenets and Yamalo-Nenets Autonomous okrugs were assigned to the last group “Crisis regions”.
-
I .L. Tukkel, N.E. Egorov, G.F. Detter and G.S. Kovrov [16] propose a methodology for rating the regions of the North and the Arctic in terms of innovative development based on the triple helix model, which provides for determination of patent activity, share of innovative products in the total volume of shipped products and budget expenditures for scientific research in the expenditures of regional budgets. The calculations were carried out for eight northern regions. According to 2015 data, the Krasnoyarsk Krai ranked first, the Arkhangelsk Oblast — second, the Yamalo-Nenets Autonomous Okrug — third, the Murmansk Oblast — fifth, the Chukotka Autonomous Okrug — seventh, the Nenets Autonomous Okrug — eighth.
It should be noted that the reviewed methodologies provide for the calculation of various indicators, including socio-economic conditions, which, as a rule, indirectly affect innovative development. In addition, some methods use highly specialized data that are not available in the public domain, as well as expert research methods, which reduces the possibility of their application for an objective assessment of the Arctic regions in terms of innovative potential.
Analysis of the innovation development of the Arctic regions
The paper considers regions fully related to the Arctic zone of the Russian Federation 9.
The study showed a positive dynamics of industrial production growth in the Arctic regions of the Russian Federation, as shown in Figure 1.
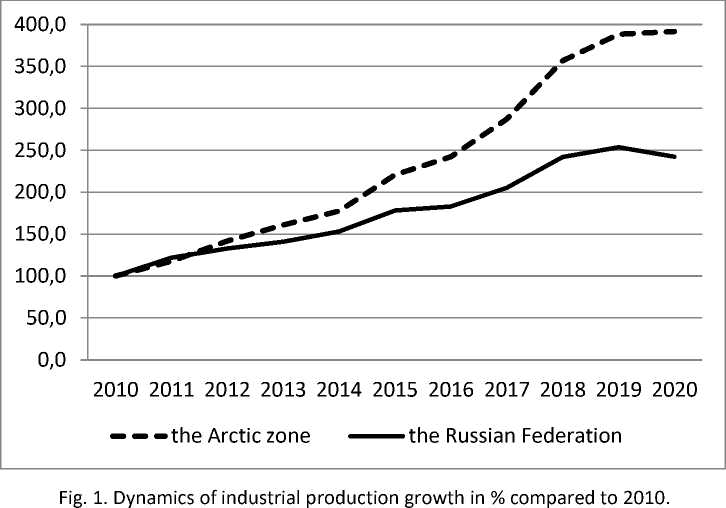
Undoubtedly, the implementation of innovative technologies and projects affects the improvement of industrial production indices in the Arctic regions [17]. This applies primarily to the Murmansk Oblast and the Yamalo-Nenets Autonomous Okrug (Fig. 1).
Table 1
Organizations implementing technological innovations (as a percentage of the total number) 10
|
2011 |
2012 |
2013 |
2014 |
2015 |
2016 |
2017 |
2018 |
2019 |
2020 |
|
|
Chukotka AO |
12.5 |
14.3 |
21.4 |
29.2 |
17.8 |
7.2 |
10.7 |
10.7 |
9.4 |
11.7 |
|
Nenets AO |
8.6 |
5.3 |
4.7 |
3.1 |
5.0 |
3.1 |
4.6 |
2.8 |
5.3 |
4.9 |
|
Yamalo-Nenets AO |
7.4 |
7.2 |
4.7 |
7.3 |
6.3 |
6.8 |
7.0 |
15.0 |
13.2 |
9.0 |
|
Murmansk Oblast |
5.9 |
6.6 |
9.9 |
8.2 |
7.8 |
5.7 |
6.8 |
16.3 |
19.0 |
19.9 |
|
The Russian Federation |
8.9 |
9.1 |
8.9 |
8.8 |
8.3 |
7.3 |
7.5 |
19.8 |
21.6 |
23.0 |
Only two regions (Nenets and Chukotka Autonomous okrugs) show a decrease in innovation activity.
Table 2 shows the share of innovative products as a percentage of total innovation output.
Table 2
Share of innovative goods as a percentage of shipped products 11
|
2011 |
2012 |
2013 |
2014 |
2015 |
2016 |
2017 |
2018 |
2019 |
2020 |
|
|
Yamalo-Nenets AO |
1.3 |
1.4 |
0.0 |
0.0 |
0.2 |
0.1 |
0.0 |
- |
0.4 |
0.4 |
|
Murmansk Oblast |
0.0 |
0.1 |
0.3 |
2.4 |
1.6 |
1.1 |
0.9 |
0.5 |
5.6 |
12.1 |
|
Chukotka AO |
0.0 |
0.9 |
1.5 |
0.0 |
0.1 |
0.7 |
1.0 |
0.5 |
0.4 |
0.3 |
|
Nenets AO |
0.0 |
- |
- |
- |
- |
0.0 |
0.0 |
0.0 |
0.0 |
0.0 |
|
The Russian Federation |
6.1 |
7.8 |
8.9 |
8.2 |
7.9 |
8.4 |
6.7 |
6.0 |
6.1 |
6.4 |
In 2020, the Murmansk Oblast is characterized by an excess of the share of innovative products over the Russian Federation indicator. Despite the growth in the share of innovative products, the values of the Chukotka Autonomous Okrug lag behind the Russian average. The Nenets and Yamalo-Nenets Autonomous Okrugs are characterized by a negative trend in the volume of innovative products.
There is a serious backlog of the Arctic regions in terms of developed innovative technologies compared to the average Russian values (Table 3).
Table 3
Developed innovative technologies (units) 12
|
2011 |
2012 |
2013 |
2014 |
2015 |
2016 |
2017 |
2018 |
2019 |
2020 |
|
|
Yamalo-Nenets AO |
4 |
1 |
4 |
16 |
13 |
22 |
12 |
12 |
15 |
20 |
|
Chukotka AO |
- |
- |
- |
2 |
2 |
- |
- |
- |
- |
0 |
|
Nenets AO |
- |
1 |
1 |
- |
- |
- |
- |
- |
- |
0 |
|
Murmansk Oblast |
- |
- |
- |
- |
- |
- |
- |
- |
- |
0 |
|
The Russian Federation |
1138 |
1323 |
1429 |
1409 |
1398 |
1534 |
1402 |
1565 |
1620 |
1989 |
Among the Arctic regions, only the Yamalo-Nenets Autonomous Okrug is characterized by positive dynamics of innovative technologies development.
Meanwhile, it should be noted that there is a serious imbalance in the number of developed and used production technologies in the Arctic regions (Table 4).
Table 4
Innovative technologies in use (units) 13
|
2011 |
2012 |
2013 |
2014 |
2015 |
2016 |
2017 |
2018 |
2019 |
2020 |
|
|
Yamalo-Nenets AO |
3769 |
3920 |
3971 |
3930 |
4052 |
3627 |
4354 |
4242 |
5178 |
4288 |
|
Murmansk Oblast |
1557 |
1154 |
1106 |
1135 |
1201 |
1236 |
1145 |
1380 |
1375 |
1535 |
|
Nenets AO |
18 |
25 |
8 |
n/d |
25 |
36 |
63 |
78 |
103 |
143 |
|
Chukotka AO |
- |
- |
- |
392 |
402 |
410 |
221 |
247 |
142 |
189 |
|
The Russian Federation |
191650 |
191372 |
193830 |
204546 |
218018 |
232388 |
240054 |
254927 |
262645 |
242931 |
In the Arctic regions, there is a significant lag in the implementation of developed innovative technologies compared to the average indicators for the Russian Federation. Many of the im- plemented technologies at industrial enterprises in Russia can be effectively used for resource enterprises in the Arctic regions.
A serious lag is observed in the Arctic regions in terms of the number of patent applications (Table 5).
Table 5
Number of patent applications in the Russian Federation (per 10.000 people) 14
|
2011 |
2012 |
2013 |
2014 |
2015 |
2016 |
2017 |
2018 |
2019 |
2020 |
|
|
Murmansk Oblast |
0.55 |
0.74 |
0.40 |
0.40 |
0.47 |
0.38 |
0.40 |
0.24 |
0.36 |
0.31 |
|
Yamalo-Nenets AO |
0.45 |
0.31 |
0.26 |
0.48 |
0.60 |
0.62 |
0.58 |
0.70 |
0.62 |
0.77 |
|
Nenets AO |
- |
- |
- |
- |
- |
0.23 |
- |
- |
- |
- |
|
Chukotka AO |
- |
- |
- |
- |
- |
0.20 |
- |
- |
- |
- |
|
The Russian Federation |
1.85 |
2.00 |
2.00 |
1.65 |
2.00 |
1.83 |
1.55 |
1.70 |
1.59 |
1.63 |
It should be noted that inventive activity in the Arctic regions is below the average Russian level. The Murmansk Oblast is characterized by a decrease in patent activity by 43%, which is incommensurable with a decrease in the number of scientific personnel by 10% (Table 6).
Table 6
Number of researchers (persons) 15
|
2011 |
2012 |
2013 |
2014 |
2015 |
2016 |
2017 |
2018 |
2019 |
2020 |
|
|
Murmansk Oblast |
984 |
1030 |
1007 |
1029 |
1023 |
977 |
923 |
876 |
873 |
885 |
|
Yamalo-Nenets AO |
27 |
45 |
49 |
52 |
55 |
59 |
62 |
69 |
68 |
65 |
|
Nenets AO |
20 |
23 |
25 |
26 |
27 |
24 |
20 |
22 |
18 |
24 |
|
Chukotka AO |
11 |
11 |
n/d |
n/d |
n/d |
n/d |
n/d |
n/d |
n/d |
n/d |
|
The Russian Federation |
374746 |
372620 |
369015 |
373905 |
379411 |
370379 |
359793 |
347854 |
348221 |
346497 |
According to statistics, the Murmansk Oblast had the largest decrease in the number of researchers among the Arctic regions and in relation to the average Russian values.
There is neither know-how nor industrial designs in the Arctic regions among the intellectual activities presented in Table 7.
In the Arctic regions, certain types of intellectual property are typical for the Murmansk Oblast and the Chukotka Okrug.
-
14 Coefficient of inventive activity. URL: https://rosstat.gov.ru/folder/11186 (accessed 31 January 2022).
-
15 Number of staff involved in research and development. URL: https://rosstat.gov.ru/folder/11186 (accessed 29 April 2022).
Table 7
Intellectual property indicators (2020) 16
|
Type of intellectual property |
|||||
|
Inventions |
Utility models |
Industrial designs |
Databases |
Computer programs |
|
|
Murmansk Oblast |
5 |
3 |
- |
25 |
39 |
|
Chukotka AO |
- |
- |
- |
- |
2 |
|
The Russian Federation |
20636 |
7098 |
2825 |
2517 |
16920 |
Comprehensive ranking of the Arctic regions by innovation potential
The authors of the article have developed a comprehensive methodology for assessing the innovative potential according to statistical data [18]. The fundamental novelty of the comprehensive methodology lies, firstly, in the use of specific indicators (in other methods, the authors use not specific, but absolute statistical indicators). The methodology uses only indicators that characterize innovative development (in most methods, in addition to these indicators, indicators of socio-economic conditions are calculated, which, as a rule, indirectly affect innovative development). The proposed methodology does not use expert methods (for example, when determining the significance of factors). The rating is based on an assessment of all specific indicators, for which the Russian regions were ranked in descending order of values.
Based on a comprehensive methodology, indicators were calculated and the Russian regions were ranked for 2011, 2013, 2017 and 2020 in order to compare the dynamics of the innovation potential of the Arctic regions.
Table 8 presents the ranking of the Arctic regions by patents per person employed in the economy, calculated according to the comprehensive methodology.
Table 8
Ranking of the Arctic regions by patents per person employed in the economy 17
|
Place among Russian regions |
||||
|
2011 |
2013 |
2017 |
2020 |
|
|
Murmansk Oblast |
64 |
57 |
68 |
71 |
|
Yamalo-Nenets AO |
78 |
69 |
67 |
65 |
|
Nenets AO |
81 |
81 |
83 |
84 |
|
Chukotka AO |
81 |
81 |
85 |
84 |
The Arctic regions rank below 57th in terms of patents employee. The Nenets Autonomous Okrug, the Murmansk Oblast and the Chukotka Autonomous Okrug are characterized by negative dynamics by 3, 7 and 3 points. The Yamalo-Nenets Autonomous Okrug moved up 13 places in terms of patent activity due to an 8-fold increase in the number of issued patents.
Table 9 presents the ranking of Arctic regions in terms of developed technologies per person employed in the economy.
-
16 Information on the use of intellectual property objects by constituent entities of the Russian Federation. URL: https://rosstat.gov.ru/folder/14477 (accessed 31 January 2022).
-
17 Calculated by the authors.
Table 9
Ranking of the Arctic regions by developed technologies per person employed in the economy 18
|
Arctic regions |
Place among Russian regions |
|||
|
2011 |
2013 |
2017 |
2020 |
|
|
Yamalo-Nenets AO |
28 |
40 |
18 |
9 |
|
Nenets AO |
62 |
16 |
65 |
52 |
|
Murmansk Oblast |
62 |
67 |
65 |
52 |
|
Chukotka AO |
62 |
67 |
65 |
52 |
In terms of technologies, the leader among the Arctic regions is the Yamalo-Nenets Autonomous Okrug, which improved its position from 28th place in 2011 to 9th place in 2020 due to a 5fold increase in the number of developed technologies, while the growth in the number of employees was 12.6 %. The Chukotka Autonomous Okrug and the Murmansk Oblast are below 50th place, although these regions are characterized by a positive trend of the indicator by 10 points due to a decrease in the number of people employed in the economy. The Nenets Autonomous Okrug in 2020, compared to 2013, improved its position by 10 points, but in 2013 the region ranked 16th among all Russian regions in the presence of developed advanced technology.
Table 10 presents the ranking of Arctic regions in terms of technologies used per person employed in the economy.
Table 10
Ranking of the Arctic regions by technology used per person employed in the economy 19
|
Arctic regions |
Place among Russian regions |
|||
|
2011 |
2013 |
2017 |
2020 |
|
|
Yamalo-Nenets AO |
1 |
1 |
2 |
3 |
|
Murmansk Oblast |
23 |
35 |
39 |
27 |
|
Nenets AO |
75 |
77 |
63 |
23 |
|
Chukotka AO |
82 |
81 |
8 |
10 |
It should be noted that the Yamalo-Nenets Autonomous Okrug and the Murmansk Oblast have reduced their indicators in terms of the advanced production technologies used by 2020. The Chukotka and Nenets Autonomous okrugs improved their rating by 72 points (from 82nd to 10th place) and 52 points (from 75th to 23rd place), which can be explained by a significant increase in the number of advanced technologies used in industry.
Table 11 presents the ranking of Arctic regions in terms of innovative products per person employed in the economy.
Table 11
Ranking of the Arctic regions by innovative products per person employed in the economy 20
|
Arctic regions |
Place among Russian regions |
|||
|
2011 |
2013 |
2017 |
2020 |
|
|
Yamalo-Nenets AO |
23 |
68 |
78 |
35 |
|
Nenets AO |
71 |
79 |
77 |
79 |
|
Murmansk Oblast |
76 |
60 |
55 |
1 |
|
Chukotka AO |
77 |
32 |
35 |
51 |
In terms of the volume of shipped innovative products, the Murmansk Oblast and the Chukotka Autonomous Okrug showed a positive trend by 75 and 26 positions due to the growth in the volume of innovative products by 381 and 66 times and a decrease in the number of employees by 18% and 2%, respectively. The Yamalo-Nenets and Nenets Autonomous Okrugs are characterized by negative dynamics by 12 and 8 points.
Table 12 presents the ranking of Arctic regions in terms of expenditures on technological innovations to GRP.
Table 12
Ranking of the Arctic regions by expenditure on technological innovation as a percentage of GRP 21
|
Arctic regions |
Place among Russian regions |
|||
|
2011 |
2013 |
2017 |
2020 |
|
|
Yamalo-Nenets AO |
61 |
73 |
71 |
81 |
|
Murmansk Oblast |
68 |
55 |
67 |
59 |
|
Chukotka AO |
74 |
70 |
53 |
79 |
|
Nenets AO |
81 |
79 |
82 |
85 |
The Arctic regions are below 50th place in terms of expenditure on innovation. The Yamalo-Nenets, Chukotka and Nenets Autonomous okrugs are characterized by a decrease in the rating by 20, 5 and 4 points, respectively, due to a larger growth in GRP compared to the costs of technological innovation. Only the Murmansk Oblast is characterized by a positive trend of 9 points due to a 4-fold increase in costs compared to the GRP, which increased by 2 times. Table 13 presents the ranking of Arctic regions in terms of research and development costs to GRP.
Table 13
Ranking of the Arctic regions by research and development costs (as a percentage of GRP)
|
Arctic regions |
Place among Russian regions |
|||
|
2011 |
2013 |
2017 |
2020 |
|
|
Murmansk Oblast |
24 |
24 |
37 |
41 |
|
Chukotka AO |
76 |
78 |
82 |
83 |
|
Nenets AO |
82 |
82 |
85 |
84 |
|
Yamalo-Nenets AO |
83 |
83 |
84 |
85 |
In terms of research and development costs, the Murmansk Oblast has the best rating — 24th place in 2011 and 41st in 2020, which is explained by the functioning of the Federal Research Center in the region, specializing in scientific research and problems of the Arctic [19, 20]. The de- crease in the rating of the region by 17 positions can be explained by the fact that costs increased by 36%, and GRP doubled. Chukotka, Nenets and Yamalo-Nenets Autonomous okrugs also lowered their ratings by 7, 2 and 2 positions, respectively, mainly due to the growth of GRP.
Table 14 presents the ranking of Arctic regions in terms of the number of organizations that implement technological innovations.
Table 14
Ranking of the Arctic regions by the share of organizations implementing technological innovations (as a percentage of the total number) 22
|
Arctic regions |
Place among Russian regions |
|||
|
2011 |
2013 |
2017 |
2020 |
|
|
Chukotka AO |
16 |
1 |
12 |
48 |
|
Nenets AO |
22 |
53 |
59 |
60 |
|
Yamalo-Nenets AO |
28 |
53 |
31 |
50 |
|
Murmansk Oblast |
38 |
21 |
33 |
36 |
According to the implementation of technological innovations among the Arctic regions, only the Murmansk Oblast improved its rating by 2 positions. The Nenets, Chukotka and Yamalo-Nenets Autonomous okrugs are characterized by negative dynamics by 38, 32 and 22 points due to a decrease in innovation activity by 72%, 46% and 41%, respectively.
Table 15 shows the place of the Arctic regions in the rating of innovative potential, calculated using a comprehensive methodology.
Table 15
Rating of the Arctic regions by innovative potential, calculated using a comprehensive methodology 23
|
Arctic regions |
Place among Russian regions |
|||
|
2011 |
2013 |
2017 |
2020 |
|
|
Yamalo-Nenets AO |
40 |
56 |
54 |
44 |
|
Murmansk Oblast |
57 |
37 |
56 |
33 |
|
Chukotka AO |
74 |
62 |
50 |
60 |
|
Nenets AO |
75 |
68 |
83 |
70 |
The Arctic regions are mostly ranked below 50th place by innovation potential. Only the Yamalo-Nenets Autonomous Okrug is characterized by a negative dynamics of the innovation development rating by 4 positions during the period under consideration, mainly due to a decrease in the rating of innovation activity and costs for technological innovation. In the Murmansk Oblast, the Chukotka and Nenets Autonomous okrugs, there is an improvement in the rating of innovative development by 24, 14 and 5 positions.
Conclusion
Foreign and Russian methodologies for assessing innovation potential have been analyzed. It has been determined that foreign methodologies, due to specific indicators that are not calculated by
Russian statistics, cannot be used to determine the innovative potential of the Arctic regions of Russia. The considered Russian methodologies provide for the calculation of various indicators, including socio-economic conditions, which, as a rule, indirectly affect innovative development. In addition, some methods use highly specialized data, as well as expert research methods, which reduces the possibility of their use for an objective assessment of the Arctic regions in terms of innovation potential.
According to the results of the analysis of statistical data, it was determined that the Arctic regions have low rates of innovative development and lag behind the average Russian values.
The authors of the article developed a comprehensive methodology for assessing the innovative potential. Based on the methodology, the indicators were calculated and the Russian regions were ranked for 2011, 2013, 2017 and 2020 in order to compare the dynamics of the innovation potential of the Arctic regions. The analysis of the innovation potential of Russia’s Arctic regions according to the developed comprehensive methodology has shown that the Arctic regions are characterized by low values of innovation potential and are mostly below 50th place in the overall ranking of Russian regions.
The practical significance of the work is due to the fact that the developed methodology allows assessing the level of innovative potential of the regions, which can help in choosing a development strategy for the territories and formulating science-based solutions to increase innovation activity, which is several times lower in the Arctic regions of Russia compared to the subarctic countries.
Further scientific research is required to increase the innovative potential of the Arctic regions, especially those with resource enterprises.
References Innovation Potential of the Arctic Regions of Russia
- Komkov N.I., Selin V.S., Tsukerman V.A., Goryachevskaya E.S. Problemy i perspektivy innovatsion-nogo razvitiya promyshlennogo kompleksa rossiyskoy Arktiki [Problems and Perspectives of Innova-tive Development of the Industrial System in Russian Arctic Regions]. Studies on Russian Economic Development, 2017, no. 1 (160), pp. 41–49.
- Lundvall B. National Systems of Innovation: Toward a Theory of Innovation and Interactive Learning. New York, 2010, 404 p.
- Fischer M., Fröhlich J. Knowledge, Complexity and Innovation Systems. Berlin, 2001, 482 p.
- Nelson R. National Innovation Systems: a Comparative Analysis. Oxford University Press, 1993, 560 p.
- Freeman C. The National System of Innovation in Historical Perspective. Cambridge Journal of Eco-nomics, 1995, no. 19, pp. 5–24.
- Gokhberg L.M., ed. Reyting innovatsionnogo razvitiya sub"ektov Rossiyskoy Federatsii. Vyp. 7 [Rat-ing of Innovative Development of Subjects of the Russian Federation. Issue 7]. Moscow, NRU HSE Publ., 2021, 274 p. (In Russ.)
- Piyanzina A.A., Grischuk V.A. Investitsionnaya privlekatel'nost' kak sostavlyayushchaya razvitiya re-giona [Investment Attractiveness as a Component of the Development of the Region]. Obshchestvo, ekonomika, upravlenie [Society, Economy, Management], 2018, no. 3, vol. 3, pp. 32–39.
- Bykova A.A., Molodchik M.A. Problemy pozitsionirovaniya regiona v novoy ekonomike [Problems of Positioning the Region in the New Economy]. Innovatsii [Innovations], 2007, no. 1 (99), pp. 66–72.
- Zimnyakova T.S. Otsenka innovatsionnogo potentsiala regiona syr'evoy spetsializatsii [Assessment of the Innovative Potential of the Region of Raw Material Specialization]. In: Materialy 2-y Mezhdu-narodnoy nauchno-prakticheskoy konferentsii «Regional'naya ekonomika: tekhnologii, ekonomka, ekologiya i infrastruktura» [Proceedings of the 2nd International Scientific and Practical Conference "Regional Economy: Technology, Economy, Ecology and Infrastructure"]. Kyzyl, Tuva Institute for the Integrated Development of Natural Resources, Siberian Branch of the Russian Academy of Sci-ences Publ., 2017, pp. 53–59.
- Vladimirova I.S. Postroenie reytingovoy sistemy otsenki innovatsionnogo razvitiya regionov Ros-siyskoy Federatsii [Creation of Rating System for the Assessment of Innovative Development of Rus-sian Regions]. Upravlenie ustoychivym razvitiem [Managing Sustainable Development], 2016, no. 3 (04), pp. 33–40.
- Makar S.V., Nosonov A.M. Otsenka i prostranstvennye zakonomernosti razvitiya innovatsionnoy deyatel'nosti v regionakh Rossii [Assessment and Spatial Regularities of the Innovative Activity De-velopment in the Regions of Russia]. Ekonomika. Nalogi. Pravo [Economics, Taxes & Law], 2017, vol. 10, no. 4, pp. 96–106.
- Gadzhiev Yu.A., Akopov V.I., Kolechkov D.V., Styrov M.M., Orlenko S.I., Tikhomirova V.V. Mak-roekonomicheskaya dinamika severnykh regionov Rossii [Macroeconomic Dynamics of the Northern Regions of Russia]. Syktyvkar, 2009, 336 p.
- Zausaev V.K., Bystritskiy S.P., Krivoruchko N.Yu. Innovatsionnyy potentsial vostochnykh regionov Rossii [Innovative Potential of the Eastern Regions of Russia]. EKO [ECO], 2005, vol. 1, no. 10, pp. 40–50. DOI: 10.30680/ECO0131-7652-2005-10-42-50
- Panikarova S.V., Vlasov M.V. Severnye regiony Rossii: otsenka urovnya innovatsionnogo razvitiya [The Northern Regions of Russia: Assessment of the Level of Innovation Development]. Regional'na-ya ekonomika: teoriya i praktika [Regional Economics: Theory and Practice], 2015, no. 29 (404), pp. 2–12.
- Gubanova E.S., Moskvina O.S. Methodological Aspects of the Assessment of the Investment and In-novation Potential of a Region. Economic and Social Changes: Facts, Trends, Forecast, 2020, vol. 13, no. 2, pp. 41–55. DOI: 10.15838/esc.2020.2.68.3
- Tukkel I.L., Egorov N.E., Detter G.F., Kovrov G.S. Otsenka innovatsionnogo razvitiya regionov arkticheskoy zony Rossiyskoy Federatsii [Assessment of Innovative Development of Regions of the Arctic Zone of the Russian Federation]. Nauchno-tekhnicheskie vedomosti Sankt-Peterburgskogo gosudarstvennogo politekhnicheskogo universiteta. Ekonomicheskie nauki [St. Petersburg State Pol-ytechnical University Journal. Economics], 2017, vol. 10, no. 4, pp. 60–71. DOI: 10.18721/JE.10406
- Tsukerman V.A., Kozlov A.A. Innovative Development Management of Mining Industrial Companies in the Russian Arctic Zone. IOP Conf. Series: Materials Science and Engineering, 2020, no. 753. P. 062020. DOI: 10.1088/1757-899X/753/6/062020
- Tsukerman V.A., Goryachevskaya E.S. Ranzhirovanie arkticheskikh regionov po innovatsionnomu razvitiyu [Spatial Indicators of Innovation Development of the Arctic Regions]. Drukerovskiy vestnik [Drucker's Bulletin], 2020, no. 5 (37), pp. 221–235. DOI: 10.17213/2312-6469-2020-5-221-235
- Nizhegorodtsev R.M., Reznik S.D., eds. Vysshee obrazovanie v Rossii: vyzovy vremeni i vzglyad v bu-dushchee: monografiya [Higher Education in Russia: Challenges of the Time and a Look into the Fu-ture]. Moscow, INFRA-M Publ., 2020, 610 p. (In Russ.). DOI: 10.12737/1045402
- Kozlov A., Kankovskaya A., Teslya A., Zharov V. Study of Experience in Blended Learning During the Pandemic: Comparative Analysis of Russian Universities. International Scientific Siberian Transport Forum TransSiberia. 2021. TransSiberia 2021. Lecture Notes in Networks and Systems, 2022, vol. 403, pp. 1131–1141. DOI: 10.1007/978-3-030-96383-5_126
