Integration of Clustering, Optimization and Partial Differential Equation Method for Improved Image Segmentation

Author: Jaskirat Kaur, Sunil Agrawal, Renu Vig
Journal: International Journal of Image, Graphics and Signal Processing(IJIGSP) @ijigsp
Article in issue: 11 vol.4, 2012.
Free access
Image segmentation generally refers to the process that partitions an image into mutually exclusive regions that cover the image. Among the various image segmentation techniques, traditional image segmentation methods like edge detection, region based, watershed transformation etc. are widely used but have certain drawbacks, which cannot be used for the accurate result. In this paper clustering based techniques is employed on images which results into segmentation of images. The performance of Fuzzy C-means (FCM) integrated with the Particle Swarm optimization (PSO) technique and its variations are analyzed in different application fields. To analyze and grade the performance, computational and time complexity of techniques in different fields several metrics are used namely global consistency error, probabilistic rand index and variation of information are used. This experimental performance analysis shows that FCM along with fractional order Darwinian PSO give better performance in terms of classification accuracy, as compared to other variation of other techniques used. The integrated algorithm tested on images proves to give better results visually as well as objectively. Finally, it is concluded that fractional order Darwinian PSO along with neighborhood Fuzzy C-means and partial differential equation based level set method is an effective image segmentation technique to study the intricate contours provided the time complexity should be as small as possible to make it more real time compatible.
Fuzzy C-means (FCM), Particle Swarm Optimization (PSO), Darwinian PSO (DPSO), Fractional Order DPSO (FO-DPSO), FCM neighborhood (FCMN)
Short address: https://sciup.org/15012456
IDR: 15012456
Text of the scientific article Integration of Clustering, Optimization and Partial Differential Equation Method for Improved Image Segmentation
Published Online September 2012 in MECS
Image segmentation is the process of subdividing an image into its constituent parts and extracting the parts of interest. Segmentation algorithms for monochrome images generally are based on one of the two basic properties of image intensity values: discontinuity and similarity [1]. In the first category, the approach is to partition an image based on abrupt changes in intensity, such as edges in an image. Second category is based on partitioning an image into regions that are similar according to a set of predefined criteria. The basic idea for segmentation can be described mathematically as follows: Given a set of p-dimensional data =
-
{%1 , %2,……․․, Хэд } ⊂ RP and a uniformity predicate P, a partition of the data into disjoint nonempty groups { C*i , C2 ……․,C^} is obtained subject to following conditions:
∪ill С =Х
С ∩ Сj = ∅ і ≠ј
Р(С ) =TRUE i=1,2,……,K
Р(С∪С j )=FALSE і≠ј
The first condition ensures that every data value must be assigned to a group, while the second condition ensures that a data value can be assigned to only one group. The third and the fourth conditions imply that every data value in one group must satisfy the uniformity predicate while data values from two different groups must fail the uniformity criterion.
One view of image segmentation is that of a clustering problem to determine which pixels in an image belong together most appropriately. There is extensive literature on methods that perform image segmentation based on clustering techniques [2]. These methods usually perform clustering in one ways, either by partitioning, in which the whole image is divided into regions that are “good” according to some criteria, or by grouping, in which pixels are collected together based on some assumptions that determine how to group preferably [3].
When viewing segmentation as clustering, a measure of similarity of clusters is an important component. There are a wide variety of similarity measures that cluster the pixels of an image. In partitioning based methods, the entire image is regarded as a cluster, and the clusters are recursively split so that a better affinity can be achieved. In grouping based methods, each pixel is regarded as a cluster, and the clusters are recursively merged when they are close enough.
Classical, so called “crisp” image segmentation techniques, while effective for images containing well-defined structures such as edges, do not perform well in the presence of ill-defined data. In such circumstances, the processing of images that possess ambiguity is better performed using fuzzy segmentation techniques, which are more adept at dealing with imprecise data. The K-means algorithm is a standard way to cluster into a known number of clusters. Its objective is to find clustering where a measure such as maximum diameter of a cluster is minimized. Though the K-means algorithm is effective and has been in use for a long time, still it has some major drawbacks. Firstly, K-means clustering is associated with computational expensiveness with respect to the cluster similarity distance measures [4]. Secondly, as compared to Fuzzy C-means no fuzziness parameter is defined. The membership function defined is crisp in nature which does not allow taking into account the finer details of an image.
The Fuzzy C-means clustering algorithms is one of the most widely used methods for image segmentation and many newly proposed fuzzy segmentation algorithm originate from it [5]. Its success chiefly attributes to the introduction of fuzziness for the belongingness of each image pixel. Compared with the other clustering algorithms, Fuzzy C-means can retain more information from the original image. It is based on minimization of the objective function. This method is frequently used in feature analysis, clustering in fields such as astronomy, geology, medical imaging and image segmentation [6]. Nowadays, the clustering and partial differential equation based methods are two types of fundamental tools for image segmentation. The former focuses on the statistical properties of image features, while the latter interests in achieving the constraints on boundary smoothness [7]. Optimization techniques are being used in image segmentation. However, almost all methods existed in the literature are unable to stress the two sides simultaneously.
-
II. PROBLEM FORMULATION
In this research work, Fuzzy C-means clustering, optimization techniques and partial differential equation based image segmentation method are used to overcome the limitations mentioned above. For this purpose, images from different fields have been downloaded from internet [8]. Unfortunately, the results of Fuzzy C-means technique depend on the clustering center initialization. To overcome this shortcoming of Fuzzy C-means synergistic Fuzzy C-means approach guided by particle swarm optimization is used. After that, to study the intricate varying boundaries partial differential equation based image segmentation method is used. Performance of this proposed method is evaluated on the basis of Normalized Probabilistic Rand index, Global consistency error and Variation of information. Various other clustering based image segmentation methods are also compared using the image quality parameters.
-
A. Fuzzy C-means Clustering
Fuzzy C-means clustering is an unsupervised technique that has been successfully applied to feature analysis, clustering such as astronomy, geology, medical imaging and image segmentation. An image over here is represented in various feature spaces, and the FCM algorithm classifies the image by grouping similar data points in the feature space into clusters.
In the FCM approach, the same given datum does not belong exclusively to a well defined cluster, but it can be placed in a middle way as shown in the diagram below. In this case, the membership function follows a smoother line to indicate that every datum may belong to several clusters with different values of the membership coefficient.
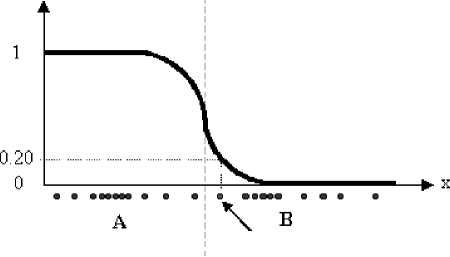
Figure 1. Membership function of fuzzy clustering
In the figure above, the datum shown as a red marked spot belongs more to the B cluster rather than the A cluster. The value 0.2 of ‘m’ indicates the degree of membership to A for such datum.
The classical FCM algorithm originates from the K-means algorithm. The K-means algorithm seeks to assign N objects, based on their attributes, into K clusters (K≤N). For image segmentation, N equals the number of image pixels N x ×N y . The desired results include the centroid of each cluster and the affiliations of N objects. Standard K-means clustering attempts to minimize the cost function:
J=∑m=l ∑n=l ||і -v ||2 (5)
Where i n is the specific image pixel, v m is the centroid of the m th cluster, and ||·|| denotes the norm. The ideal results of a k -means algorithm maximize the inter-cluster variations, but minimize the intra-cluster ones.
In K-means clustering, every object is limited to one and only one of K clusters. In contrast, an FCM utilizes a membership function μmn to indicate the degree of membership of the nth object to the mth cluster. The cost function in an FCM similar to the above equation is given by:
Where l (>1) is a parameter controlling the fuzziness of the resultant segmentation. The membership functions are subject to the following constraints:
J=∑m=l ∑n=l μInn||і -v ||2
∑m=l μ =1; 0≤ μ ≤1; ∑n=lμ >0
The membership functions μ mn and the centroids v m are updated iteratively
µ = || || -2 ⁄(
µ = ∑ k=i ||in-vk ||⁄
v =
∑n=i M-mnin
∑n = l Hmn
The standard FCM algorithm is optimized when pixels close to their centroid are assigned high membership values, while those that are far away are assigned low values.
-
B. Fuzzy C-means Clustering with Neighborhood Information (FCMN)
One of the most important characteristics of an image is that neighboring pixels are highly correlated. These neighboring pixels possess similar feature values, and the probability that they belong to the same cluster is great. Therefore, it becomes important in clustering but is not utilized in Fuzzy C-means algorithm [9] [10]. Since image noise and artifacts often impair the performance of FCM segmentation, it would be attractive to incorporate spatial information into an FCM. Cai et al. [10] proposed a generalized FCM algorithm that adopts a similarity factor to incorporate local intensity and spatial information. Chuang et al. [9] proposed another spatial FCM algorithm in which spatial information can be incorporated into fuzzy membership functions directly using:
„Р hq
∑i uP„h?
∑
Where p and q are the parameters to control the relative performance of the functions. For the noisy pixel, this equation reduces the weighting of a noisy cluster by the labels of its neighboring pixels. As a result in misclassified pixels from noisy regions can be corrected. FCM taking into account neighboring pixels can be termed as FCMN. When the value of p is 1 and q is 0, this algorithm becomes identical to the conventional Fuzzy C-means. The variable h mn includes spatial information by:
h = ∑keNn μnk
Where N n denotes a local window centered around the image pixel n . The weighted μ mn and the centroid v m are updated as usual according to Eqs. 8 and 9. The spatial function of a pixel for a cluster is large if the majority of its neighborhood belongs to the same clusters. The clustering over here is a two pass process at each iteration.
The first being the same as in standard FCM to calculate the membership function in the domain.
In the second pass, the membership information of each pixel is mapped to the spatial domain, to compute the spatial function. Then the FCM iteration proceeds with the new membership function that is incorporated in the spatial function.
-
C. Integration of FCMN and Level Set Method (FCMNL)
The algorithm begins with Fuzzy C-means clustering with neighborhood information, whose results are utilized to initiate level set segmentation, estimate controlling parameters and regularize level set evolution. The enhanced level set function can accommodate FCM results directly for evolution. The component of interest in an FCM results is R k : {r k =μ nk , n=x×N y +y}. It is efficient to initiate the level set function as
∅ 0(х,у)= -4Ԑ(0․5-Вк)
Where Ԑ is a constant regulating the Dirac function. The Dirac function is then defined as follows:
0, | X |>Ԑ
5 Ԑ( ' )= { ; Ԑ 01+соѕ. Ԑ /1,| X |≤ Ԑ}
B k is a binary image obtained from
Bк=Rк≥bО (14)
Where b 0 ( ∈ (0, 1)) is an adjustable threshold.
This algorithm takes the degree of membership of each image pixel μ k as the distance to the specific component of interest R k . An enhanced balloon force is proposed here to pull or push the dynamic interface adaptively towards the object of interest:
G(Rк)=1-2Rк
The resultant force G( R k ) ( ∈ [-1, 1]) is a matrix with a variable pulling or pushing force at each image pixel. In other words, the level set function will be attracted towards the object of interest regardless its initial position. Then, the evolutionary equation is transformed into ξ(g, ∅ )=λ δ( ∅ )dіv.g | ∇∅ | /+gG(Rк)δ( ∅ ) (16)
The level set evolution is now adapted to the distance to the genuine object. Once approaching the object, the level set function will automatically slow the evolution down and will become totally dependent on the smoothing term. Since a conservative λ is adopted here, level set evolution stabilizes automatically.
-
D. Particle Swarm Optimization (PSO)
The original PSO was developed by Eberhart and Kennedy in 1995 based on social and computer science. The PSO basically takes advantages on the swarm intelligence concept, which is the property of a system, whereby the collective behaviors of unsophisticated agents that are interacting locally with their environment, create coherent global functional patterns [11]. Algorithm works like flock of birds where each bird cries at an intensity proportional to the amount of food that it finds at its current location. At the same time each bird can perceive the position of neighboring birds and can tell which of the neighboring birds emits the loudest cry. There is a good chance that the flock will find a spot with the highest concentration of food if each bird follows a trajectory that combines three directions:
-
a) Keep flying in the same direction
-
b) Return to the location where it found the highest concentration of insects so far
-
c) Move toward the neighboring bird that cries the loudest
In the traditional PSO, the candidate solutions are called particles. These particles travel through the search space to find an optimal solution, by interacting and sharing information with neighbor particles, namely their individual best solution (local best) and computing the neighborhood best. Also, in each step of the procedure, the global best solution obtained in the entire swarm is updated. Using all of this information, particles realize the locations of the search space where success was obtained, and are guided by these successes. In each step of the algorithm, a fitness function is used to evaluate the particle success. To model the swarm, each particle moves in a multidimensional space according to position ( xt ) and velocity ( vn ) values which are highly dependent on local best ( ̆ ? ), neighborhood best ( ̆t ) and global best information: ( ̆ t )
vt+l =wvtn + ρ 1 r 1 (ğ t -хt)+ρ2r2 (х̆ t”-хt)+ ρ3r3 (n̆ t -хt) (17)
хt+l = хt +vt+l (18)
The coefficients w , Pl , P2 and Рз assign weights to the inertial influence, the global best, the local best and the neighborhood best when determining the new velocity, respectively. Typically, the inertial influence is set to a value slightly less than 1. Pl , p2 and Рз are constant integer values, which represent “cognitive” and “social” components. However, different results can be obtained by assigning different influences for each component. For example, several works do not consider the neighborhood best and Рз is set to zero. Depending on the application and the characteristics of the problem, tuning these parameters properly will lead to better results. The parameters Г1 , r2 and r3 are random vectors with each component generally a uniform random number between 0 and 1. The intent is to multiply a new random component per velocity dimension, rather than multiplying the same component with each particle’s velocity dimension.
-
E. Fractional Order Darwinian Particle Swarm
Optimization (FO-DPSO)
Fractional calculus has attracted the attention of several researchers [12], being applied in various scientific fields such as engineering, computational mathematics, fluid mechanics etc. The Grünwald– Letnikov definition based on the concept of fractional differential with fractional coefficient α ∈ C of a general signal ( t) , is given by:
D“ [ x (‘)] =lіm h →0[ ha ∑k=0 ( ⌈( ) 1 )⌈( ; ) ( +i )- ) ] (19)
Where ⌈ is the gamma function. Discrete time implementations expression is defined as:
D“ [ x ( 1 )]=0 ∑ k=0 ( ⌈( ) 7 )⌈(; ) ( + 1)- ) 1 (20)
Where T is the sampling period and r is the truncation order.
The characteristics revealed by fractional calculus make this mathematical tool well suited to describe phenomena such as irreversibility and chaos because of its inherent memory property. Considering the inertial influence of equation (12) w =1, assuming T =1 and based on [13] work, the following expression can be defined:
D“ [ Vt+1 ]= ( ̆?- xP )+ Р2Ч ( ̆ ? - xP )+
P3T3 ( ̆t- XP ) (21)
Hence, using only the first terms of differential derivative given by (16), equation (17) can be rewritten as (18):
vp+i = + ^av"-i +6 й(1-a)vp_2 + ма(1-a)(2-a)vP-з + РЛ ( ̆?- xp)+ РгЧ ( ̆?- X?)+
P3T3 ( ̆-
XP ) (22)
From the above equation, one can conclude that the DPSO is then considered as being a particular case of the FO-DPSO when Ct =1. Moreover, the FO-DPSO may also be seen as a collection of FO-PSO’s as in [13] in which each swarm individually performs with some natural selection rules.
Although this new equation incorporates the concept of fractional calculus, the difficulty to understand the influence inherent to the fractional coefficient α still remains: What should be the most adequate value for α? As described in [14] and [15], a swarm behavior can be divided into two activities: a) exploitation; and b) exploration. The first one is related with the convergence of the algorithm, thus allowing a good short-term performance. However, if the exploitation level is too high, then the algorithm may be stuck on local solutions. The second one is related with the diversification of the algorithm which allows exploring new solutions, thus improving the long-term performance. However, if the exploration level is too high, then the algorithm may take too much time to find the global solution. As first presented by Shi and Eberhart [16], the trade-off between exploitation and exploration in the classical PSO has been commonly handled by adjusting the inertia weight. A large inertia weight improves exploration activity while exploitation is improved using a small inertia weight. Since the FO-DPSO presents a fractional calculus strategy to control the convergence of particles, the coefficient α needs to be defined in order to provide a high level of exploration while ensuring the global solution of the mission.
-
F. Performance Metrics
-
a) Probabilistic Rand Index (PRI)
Rand Index is the function that converts the problem of comparing two partitions with possibly number of classes into a problem of computing pair wise label relationships. PRI counts the fraction of pairs of pixels whose labeling are consistent between the computed segmentation and the ground truth, averaging across multiple ground truth segmentations to account for scale variation in human perception. It is a measure that combines the desirable statistical properties of the Rand index with the ability to accommodate refinements appropriately. A set of manually segmented (ground truth) images {St,S2, Sg ……․․Sк} correspond to an image Х= {х t ,х2 ……,х ․․хN}, where a subscript indexes one of the N pixels. Stest is the segmentation that is to be compared with the manually labeled set. The label point х is denoted by l $test in segmentation Stest and by l in manually segmented image SK . It is assumed that each label l can take values in a discrete set of size LK and correspondingly l i can take one of the Ltest values.
||(l = l $k ) are the binary numbers for each pair of pixels
(х ,хj). The set { pij } for all unordered pairs (і,ј) defines a generative model of correct segmentations for the image Х. PRI is given as:
PR ( Stest,{Sk})= N∑ ,j [ ||(l i = l j )pij +
./i<;
||(lStest = l j )(1-рij )]
сij denote the event of a pair of pixels і and ј having the same label in the test image S :
сij = ||(lStest = l j )
Then the PRI can be written as:
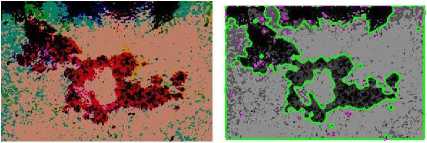
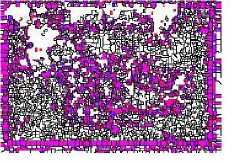
PR ( Stest,{Sk})= N∑ ,j [сij р ij +(1-сij)(1-рij )] .2/ i This measure takes values in [0,1], where 0 means Stest and { S t,S2,……S ^ } have no similarities (i.e. when S consists of a single cluster and each segmentation in { Sx,S2,……S ^ } consists only of clusters containing single points, or vice versa) to 1 when all segmentations are identical. Since сij € {0,1}, the above equation can be equivalently written as : PR (Stest,{Sk})= N∑ ,j [рijCii (1-рij )( 1 см )] (26) .2/ i b) Variation of Information (VOI) It measures the sum of information loss and information gain between the two clustering, and thus it roughly measures the extent to which one clustering can explain the other. The VOI metric is nonnegative, with lower values indicating greater similarity. It is based on relationship between a point and its cluster. It uses mutual information metric and entropy to approximate the distance between two clustering across the lattice of possible clustering. Precisely, it measures the amount of information that is lost or gained in changing from one cluster to another. It is basically a measure of distance between two clusters. A clustering with clusters {Х t ,Х2․․․․ХK} is represented by a random variable Х with Х={1…․․K} such that р |Х |/n і € Х and n= ∑ Х the variation of information between two clustering Х and Y so represented is defined to be: VI(Х, Ү) =Н(Х)+Н(Ү)- 2І(Х, Ү) (27) Where Н(Х) is the entropy of Х and І(Х, Ү) is the mutual information between Х and Ү. VI(Х, Ү) measures how much the cluster assignment for an item in clustering Х reduces the uncertainty about the item’s cluster in clustering Ү. c) Global Consistency Error (GCE) Global Consistency Error (GCE) measures the extent to which resulting segmentation can be viewed as a refinement of the other segmentation. Segmentations related are considered to be consistent, since they could represent the same image segmented at different scales. Segmentation is simply a division of the pixels of an image into sets. The segments are sets of pixels. If one segment is a proper subset of the other, then the pixel lies in area of refinement, and the error should be zero. If there is no subset relationship, then the two regions overlap in an inconsistent manner. The formula for GCE is as follows: GCE = n mіn{∑iE(s1, s2, pi),∑(E s2, s1, pi)} (28) Where, segmentation error measure takes two segmentations ѕ1 and ѕ2 as input, and produces a real valued output it the range [0 1] where zero signifies no error. For a given pixel рі consider the segments in ѕ1 and ѕ2 that contain the pixel. III. Experimental implementation and Result ANALYSIS A. Experimental Implementation In this main part of research work, images from different fields are taken which have some area of interest to be analyzed with refinement. Firstly, image is processed through the Particle swarm optimization based on fractional order Darwinian particle swarm optimization which optimizes the candidate clusters for the Fuzzy C-means algorithm which incorporates the spatial information as well. Furthermore, MATLAB tool is used to develop and implement the integration of the above technique with the level set method to analyze the intricate contours of an image. This method is termed as the virtual method or the combined method and its performance the combined performance. On the other hand, other variations of the above integrated method are also used to analyze the improvement in the performance of image segmentation. Proposed algorithm and its earlier variations are applied to the performance metrics chosen and its effect on classification accuracy is observed. Time and computational complexity of the proposed method is also analyzed. Finally, the visual results of the images and the supporting objective parameters calculated are given in this section. B. Result Analysis The experiments and performance evaluation were carried on images from different modalities, including cancer, tumour and cell nucleus images. Both algorithms of spatial FCM and the proposed fuzzy level set method were implemented with MATLAB R2009b. The first experiment is designed to evaluate the usefulness of an initial fuzzy clustering for level set segmentation. It adopted the fast level set algorithm as in [35] for the curve optimization, where the initialization was by manual demarcation, intensity thresholding and spatial fuzzy clustering. The experiment is carried out in various number of application fields and some of them are shown along with the numerical values. The numerical values of the performance parameters namely global consistency error, variation of information and Probabilistic Rand Index test the efficiency of the algorithm. Figure 2. depicts the performance comparison on the skin cancer image. Obviously, due to the weak boundaries, in Figure 2(b) the initial ground truth did not lead to an optimal level set segmentation. On the contrary, both fractional order Darwinian particle swarm optimization and Fuzzy C-means clustering attracted the dynamic curve quickly to the boundaries of interest. It is noteworthy that an image inhomogeneity resulted in boundary leakage during Fuzzy C-means clustering. In contrast, the proposed segmentation algorithm with spatial restrictions remedied it substantially in Figure 2(d). Figure 2(e) depicts the percentage area infected with cancer. TABLE 1. Statistical Parameters performance for the PROPOSED ALGORITHM IN MEDICAL FIELD Medical Image Segmentation Algorithms FCM FCMN FCMN+FODPSO+ LEVEL SET GCE 0.8762 0.8025 0.7934 VOI 9.4257 9.6437 9.5328 PRI 0.8043 0.7527 0.8632 (a) (b) Table I. shows the performance of the parameters chosen for the proposed algorithm. It is clear from this table that minimum value of global consistency error is provided by FO-DPSO based FCMNL algorithm. It continuously improves from neighborhood information being incorporated to the optimization technique applied. Variation of information is least for fuzzy c-means but probabilistic rand index being the maximum for the proposed algorithm. Bar-graph given in Figure 3. visualizes the performance of the statistical parameters for the proposed algorithm in medical images. It is evident from this figure that the FODPSO based FCMNL algorithm has maximum classification accuracy for the medical image shown. (c) (d) 9.4257 9.6437 9.5328 0.9 0.4 гтт ■ GCE ■ VOI (e) Figure 2. Skin Cancer Image and results of the Intermediate Steps of the proposed algorithm (a) Original skin cancer image (b) Ground truth of the original image (c) Optimized clusters of an image using optimization method (d) Result of PDE based level set method studying intricate contours (e) Percentage of colored area depicting cancer ■ PRI Figure3. Statistical Parameters performance for the proposed algorithm in medical field From all this discussion and analysis of various types of images, it is evident that FO-DPSO based FCMNL gives better performance in terms of GCE, VOI and PRI. The proposed algorithm seems trivial in some field of images with comparatively clear boundaries. However, in images without distinct boundaries, it would be very important to control the motion of the level set contours. The operator has to monitor level set evolution continuously and adjust various controlling parameters frequently; otherwise inappropriate segmentation would come into being. In contrast, algorithm is able to find out the controlling parameters from Fuzzy C-means clustering automatically. In particular, its solutions are robust and nearly optimal in all cases. But time complexity of the proposed method remains high as compared to the other techniques mentioned. Finally, it is concluded that the proposed algorithm provides a better and improved image segmentation technique. C. Conclusions From all this analysis using four popular image segmentation algorithms: fuzzy c-means, K-means, PDE based level set method and fractional order Darwinian particle swarm optimization, we can conclude following points: • Fuzzy clustering in this algorithm is able to obtain the approximate boundaries of potential components of interest, and is thus suitable to initiate image segmentation. However, the standard FCM algorithms, which are concerned with intensity information only, are not robust enough for all types of image segmentation, due to noise and artifacts. The enhanced spatial FCM attempts to unify intensity and spatial information as a whole. • Level set evolution is subject to various forces from the active curve itself and the image under investigation. It is difficult to coordinate these forces for an optimal image segmentation. Optimal parameters can be achieved only by trial and error for the specific images. The new algorithm is advantageous, because the implicit interface stabilizes once it approaches the genuine boundaries. • Also in the proposed algorithm, it is possible to estimate the nearly optimal controlling parameters from the results of spatial fuzzy clustering automatically. • Finally, Fuzzy clustering is able to obtain the potential components of interest adaptively. It therefore serves as an effective source of prior knowledge for improved level set segmentation. • Computational complexity is largely reduced using the proposed algorithm as it does not require any more four to five stages processing of an image for the proper image segmentation results. • The proposed algorithm with spatial information can approximate the boundaries of interest well. Therefore, level set evolution will start from a region close to the genuine boundaries. • Also, the new algorithm estimates the controlling parameters from fuzzy clustering automatically. This has reduced manual intervention.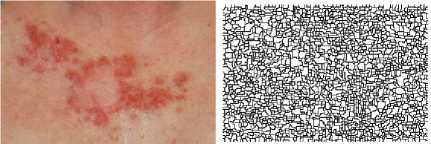
References Integration of Clustering, Optimization and Partial Differential Equation Method for Improved Image Segmentation
- Gonzalez, Woods, and Eddins, Digital Image Processing Using MATLAB, Prentice Hall 2004.
- A.K. Jain, M.N. Murty, P.J. Flynn, Data Clustering: A Review, ACM Computing Surveys, Vol. 31, No. 3, September 1999.
- Hui Zhang, Improved Clustering-Based Image Segmentation through Learning, A Dissertation, Department of Computer Science and Engineering, August 2007.
- R. Harikumar, B.Vinoth Kumar, G.Karthick, Performance Analysis for Quality Measures Using K means Clustering and EM models in Segmentation of Medical Images, International Journal of Soft Computing and Engineering, Volume-1, Issue-6, January 2012.
- Feng Zhao, Licheng Jiao, Spatial improved fuzzy c-means clustering for image segmentation, International Conference on Electronic and Mechanical Engineering and Information Technology, IEEE 2011, pp 4791-4794.
- Keh-Shih Chuang, Hong-Long Tzeng, Sharon Chen, Jay Wu, Tzong-Jer Chen, Fuzzy c-means clustering with spatial information for image segmentation, Computerized Medical Imaging and Graphics, 2006, pp 9-15.
- Zhenping Xie Shitong Wang, A New Level Set Method For Image Segmentation Integrated with FCM, Fourth International Conference on Fuzzy Systems and Knowledge Discovery, IEEE Computer Society- 2007.
- http://www.eecs.berkeley.edu/Research/Projects/CS/vision/bsds/
- Chuang KS, Hzeng HL, Chen S, Wu J, Chen TJ, Fuzzy c-means clustering with spatial information for image segmentation, Computerized Medical Imaging and Graphics. 2006, pp. 9–15.
- Cai W, Chen S, Zhang D, Fast and robust fuzzy c-means clustering algorithms incorporating local information for image segmentation, Pattern Recognition. 2007, pp. 825–838.
- Micael S. Couceiro, Rui P. Rocha, N. M. Fonseca Ferreira1 and J. A. Tenreiro Machado, Introducing the Fractional Order Darwinian PSO, Springer London Volume 1 / 2007 - Volume 6 / 2012.
- Ortigueira, M. D., & Tenreiro Machado, J. A., Special Issue on Fractional Signal Processing, Signal Process, 2003 83, 2285- 2480.
- Pires, E.J.S., Machado, J.A.T., Oliveira, P.B.M., Cunha, J.B. and Mendes, L., Particle swarm optimization with fractional-order velocity, Journal on Nonlinear Dynamics, 2010, 61: 295–301.
- Yasuda, K., Iwasaki, N., Ueno, G. and Aiyoshi, E. Particle Swarm Optimization: A Numerical Stability Analysis and Parameter Adjustment Based on Swarm Activity, IEEJ Transactions on Electrical and Electronic Engineering, Wiley InterScience, 2008, vol. 3, pp. 642-659.
- Shi, Y. and Eberhart, R., Fuzzy adaptive particle swarm optimization. In Proc. IEEE Congr. Evol. Comput., 2001, vol. 1, pp. 101–106.
- S. Thilagamani1 and N. Shanthi, A Survey on Image Segmentation Through Clustering, International Journal of Research and Reviews in Information Sciences, Vol. 1, No. 1, March 2011 pp 14-17.
