Intelligent Analysis of Ukrainian-language Tweets for Public Opinion Research based on NLP Methods and Machine Learning Technology

Author: Oleh Prokipchuk, Victoria Vysotska, Petro Pukach, Vasyl Lytvyn, Dmytro Uhryn, Yuriy Ushenko, Zhengbing Hu
Journal: International Journal of Modern Education and Computer Science @ijmecs
Article in issue: 3 vol.15, 2023.
Free access
The article develops a technology for finding tweet trends based on clustering, which forms a data stream in the form of short representations of clusters and their popularity for further research of public opinion. The accuracy of their result is affected by the natural language feature of the information flow of tweets. An effective approach to tweet collection, filtering, cleaning and pre-processing based on a comparative analysis of Bag of Words, TF-IDF and BERT algorithms is described. The impact of stemming and lemmatization on the quality of the obtained clusters was determined. Stemming and lemmatization allow for significant reduction of the input vocabulary of Ukrainian words by 40.21% and 32.52% respectively. And optimal combinations of clustering methods (K-Means, Agglomerative Hierarchical Clustering and HDBSCAN) and vectorization of tweets were found based on the analysis of 27 clustering of one data sample. The method of presenting clusters of tweets in a short format is selected. Algorithms using the Levenstein Distance, i.e. fuzz sort, fuzz set and Levenshtein, showed the best results. These algorithms quickly perform checks, have a greater difference in similarities, so it is possible to more accurately determine the limit of similarity. According to the results of the clustering, the optimal solutions are to use the HDBSCAN clustering algorithm and the BERT vectorization algorithm to achieve the most accurate results, and to use K-Means together with TF-IDF to achieve the best speed with the optimal result. Stemming can be used to reduce execution time. In this study, the optimal options for comparing cluster fingerprints among the following similarity search methods were experimentally found: Fuzz Sort, Fuzz Set, Levenshtein, Jaro Winkler, Jaccard, Sorensen, Cosine, Sift4. In some algorithms, the average fingerprint similarity reaches above 70%. Three effective tools were found to compare their similarity, as they show a sufficient difference between comparisons of similar and different clusters (> 20%). The experimental testing was conducted based on the analysis of 90,000 tweets over 7 days for 5 different weekly topics: President Volodymyr Zelenskyi, Leopard tanks, Boris Johnson, Europe, and the bright memory of the deceased. The research was carried out using a combination of K-Means and TF-IDF methods, Agglomerative Hierarchical Clustering and TF-IDF, HDBSCAN and BERT for clustering and vectorization processes. Additionally, fuzz sort was implemented for comparing cluster fingerprints with a similarity threshold of 55%. For comparing fingerprints, the most optimal methods were fuzz sort, fuzz set, and Levenshtein. In terms of execution speed, the best result was achieved with the Levenshtein method. The other two methods performed three times worse in terms of speed, but they are nearly 13 times faster than Sift4. The fastest method is Jaro Winkler, but it has a 19.51% difference in similarities. The method with the best difference in similarities is fuzz set (60.29%). Fuzz sort (32.28%) and Levenshtein (28.43%) took the second and third place respectively. These methods utilize the Levenshtein distance in their work, indicating that such an approach works well for comparing sets of keywords. Other algorithms fail to show significant differences between different fingerprints, suggesting that they are not adapted to this type of task.
Public Opinion, trend, clustering, stemming, similarity of clusters, Bag of Words, TF-IDF, BERT, K-Means, Agglomerative Hierarchical Clustering
Short address: https://sciup.org/15019121
IDR: 15019121 | DOI: 10.5815/ijmecs.2023.03.06
Text of the scientific article Intelligent Analysis of Ukrainian-language Tweets for Public Opinion Research based on NLP Methods and Machine Learning Technology
Public opinion research is an integral element of feedback from the people to the state. As of today, the main methods of gathering public opinion in Ukraine are surveys of citizens in offline or online formats [1]. These surveys are usually conducted by sociological centers. In most cases, such a process is partially automatic (conducting a questionnaire followed by machine processing). The disadvantage of such a survey is the inaccuracy of the data obtained due to not covering a large number of strata of the population and various social groups, the chaotic and longterm nature of data collection, which also leads to the loss of relevance of the obtained results. In addition, people often give incorrect information in such questionnaires. Analysis of the reactions of social groups to this or that event/information in social networks does not hide their true emotional reaction. The automatic collection and analysis of such information leads to obtaining operative actual data on certain problematic issues for further research of the relevant public opinion.
Collecting, extracting, and processing data on public opinion is an important component of decision-making processes in various areas of the state, such as politics, business, and social issues. For each stakeholder, it is crucial to know the current state of affairs in the country in order to make timely, beneficial, and informed decisions.
The main source of data on social opinion in Ukraine currently relies on the results of citizen surveys conducted by relevant centers. However, this method of researching public opinion has several drawbacks [2-6]:
-
• Cost : The traditional processes of collecting public opinion, carried out by social centers, require a significant
amount of manual labor. Each research topic requires separate processes that need to be financed, which creates a need for research sponsors.
-
• Vulnerability : The reliability and accuracy of the results of conducted research depend directly on the
organization conducting it. The stages of data collection, processing, and presentation are entirely concentrated in the respective organizations. In the case where social organizations are driven by self-interest, research results can be distorted, manipulated, or presented in a way that benefits certain individuals or groups.
-
• Transience : The results of a specific survey remain relevant for only a short period of time after its conduct.
The larger the time gap between the survey date and the analysis, the greater the difference between the results and the reality. To address the consequences of changing public opinion, social centers conduct repeated surveys at specific intervals. However, this leads to additional costs and resource requirements.
These drawbacks can be addressed through the automation of the processes involved in researching public opinion. Unbiased algorithms can eliminate the possibility of manipulating results in favor of interested parties, while repeatability is one of the main advantages of automated systems, allowing for the continuous maintenance of data relevance.
The paper considers the technology of analyzing the information flow of Ukrainian-language tweets with their metadata (date of publication, hashtags, repost/publication, geography, gender of the author, likes, depth of repost, etc.) in social networks, for research/forecasting of public opinion. This is quite relevant today, when in the conditions of war, it is important to obtain operational and timely data on the change in the dynamics of opinion and its tonality of social groups on the reactions of relevant events in order to form/correct the strategy of state administration and steps/algorithms for the development/reconstruction of the country. In addition, the automation of the process will make it possible to create an independent publicly available source of information with chronological data, for example, for the possibility of forecasting the reactions of the population to changes in the state administration process.
The purpose of the article is to develop a technology for analyzing the flow of Ukrainian-language content in social networks for researching public opinion on the subject of multiple tweets. To achieve the goal, the following tasks must be solved:
• determination of an effective approach to forming a sample and preliminary processing of Ukrainian-language tweets based on NLP methods;
• experimental research of methods and tools for creating clusters of Ukrainian- language tweets to analyze the effectiveness of their application when obtaining the best results on large volumes of input data;
• development of a method for calculating the popularity of clusters formed at different points in time based on experimental tests.
2. Literature Review
Research object: The process of automating the research and analysis of public opinion.
Research subject: Tools for creating an automated system for researching public opinion that relies on the resources of electronic computing machines, operates in the online space, and gathers research data from social media networks.
The development of a system that allows for the automatic collection and compilation of public opinion from Ukrainian users on the social media platform Twitter is proposed. The solution aims to be user-friendly and serve as a valuable and cost-effective addition to existing tools and methods for researching public opinion in Ukraine. The system should regularly collect data from Twitter, analyze it, and provide easy and convenient access to the resulting statistics, either through a website interface or in the form of textual data via an API. This way, each stakeholder can easily and consistently obtain up-to-date statistics and utilize them for their own purposes or to improve the state of affairs in Ukraine. The provided statistics aim to highlight popular and important topics, as well as those generating significant discussions, showing both positive and negative trends that require attention.
The core of the system is a daily pipeline process that covers the entire range of tasks from data collection to the creation of final statistics, utilizing both conventional and intelligent data processing algorithms. The pipeline includes the collection of tweets using the Twitter API v2 and their filtering, preprocessing of tweets through stemming, lemmatization, and regular expression-based text processing, transforming tweets into numerical vectors and clustering them, merging clusters by checking the similarity of their profiles, and applying processors that transform the stream of clusters into statistics of public opinion.
The most critical stage of the entire pipeline is the grouping of similar tweets. From the tens and hundreds of thousands of tweets received as input to the process, it is necessary to identify groups of tweets that are related based on certain automatically determined characteristics. These tweet groups will determine the popularity and content of specific topics. Intelligent clustering algorithms, including K-Means, Agglomerative clustering, and HDBSCAN, are utilized for extracting such groups.
Public opinion must be analyzed based on the sources of its free expression. Social media is great for this role, as it allows people to freely share their thoughts or emotionally truthfully respond to information posted about certain events. Statistics show that data from social networks is not enough to obtain a full-fledged result, because a considerable percentage of people do not use social networks [2]. The authors in [3] claim that the confidence interval using the time series estimator is within [11.830;14.102] %, which is significantly narrower than the confidence interval using the last survey estimator, which ranges from [3.965;21.435] %. However, the automation of post-monitoring of publications of even such a stratum of the population is already a good result for analyzing the dynamics of public opinion changes in accordance with events in the country/world and, accordingly, for further correction of state administration processes.
There are examples of successful research of public opinion in social networks. For example, such research of public opinion is the analysis of information about COVID-19 in China based on the Weibo social network [3] or vaccination in Italy based on the Twitter network [4].
Such studies are conducted for specific topics. Based on the results, the society's attitude to these topics is established. The analysis is carried out with the help of classification or clustering, that is, messages are grouped according to certain criteria and topics. Usually, the collection and processing of the information flow of tweets is implemented programmatically, but in this direction, there are few studies on the influence of various NLP methods on the accuracy and speed of obtaining the result of clustering according to the thematic classification of tweets. Also, the effectiveness of processing the relevant regional language significantly affects the results of the research. Another important criteria/metrics of the effectiveness of public opinion research is the collection and analysis of metadata of tweets, for example, time data of publication/repost, depth of repost, network of reposts according to the age range of authors and/or gender, etc., as well as the frequency of data collection and their frequency (1-2 times a day/week). In a study on halal tourism (Halal tourism is a subcategory of tourism that is aimed at Muslim families who follow the rules of Islam) [5] the collection of temporal tweet data was implemented. However, the study is limited to one topic. However, the authors in [5] claim that timely dissemination of targeted and authoritative information by the government as a responsive reaction to public opinion has helped alleviate panic and promote social stability. At the same time, less than 10% of "seeking help" and "making donations" indicate that more attention should be given to information directly related to the consequences of natural disasters: "seeking help" and "donations" are extremely important. During the early stage of COVID-19 in China, the most expressed topic was "opinions and attitudes" with a frequency of 34.42%. Therefore, social media is an important channel through which the public evaluates risks and shares thoughts and emotions during emergencies, especially during times of war.
In [6], the study is based only on the analysis of the statistics of the occurrence of keywords related to COVID-19 on Twitter from September 2016 to August 2017 in Italy, and the unit of measurement is a word or phrase, not a cluster, the imprint of which is stored for analysis, or a merger with other clusters. Social media has become a common way for people to express their personal opinions on various events in society, especially during the war in Ukraine. For example, in [6], the authors found that based on a general analysis by categories, 60% of tweets were classified as neutral, 23% were against vaccination, and 17% were in favor of vaccination. It was found that vaccine-related events can influence the quantity and polarity of opinions in tweets. The analysis of fingerprints allows obtaining additional results, for example, the emotional coloring of a set of tweets on a certain topic [7]. In [8], the process of clustering tweets for topic trend analysis was investigated. Experiments were conducted on a small data set - 2184 text data that went through several stages, such as cleaning, duplicate removal, pre-processing such as expression words and stop words. The selection of tweets is also limited to one topic – elections in Indonesia.
The stream of topics should contain enough information in the form of markers (keywords, time data such as dates/periods, main theses, territoriality/regionalism, etc.) for the possibility of a comprehensive study of the dependence of public opinion on the topic, its popularity and emotional coloring (positive, negative, neutral) to the possibility of predicting changes in opinion over time depending on events within a specific topic. The analysis of public opinion in Twitter posts has shown that it is a potentially valuable and timely process of monitoring the current information flow to assess the orientation of public opinion towards various events. It effectively contributes to the development of relevant communication and information strategies. The accuracy of tweet analysis results directly influences the formation of effective strategies for state governance based on timely analysis of public opinion. Accuracy depends not only on the choice of methods but primarily on the adaptability of the selected methods to the characteristics of natural language, which is the main component of the analyzed tweets from the target audience on Twitter.
3. Materials and Methods
To develop the technology for analyzing Ukrainian-language tweets, a pipeline of processes that will be performed with a certain periodicity is implemented (Fig. 1). To maintain constant access to up-to-date data, the periodicity of pipeline execution should be at least once a day. The interactivity of the analysis somewhat changes the usual process of processing the information flow of content over a long period of time and adds several necessary steps to the pipeline. In general, the algorithm consists of 5 steps. Let's consider each of them.
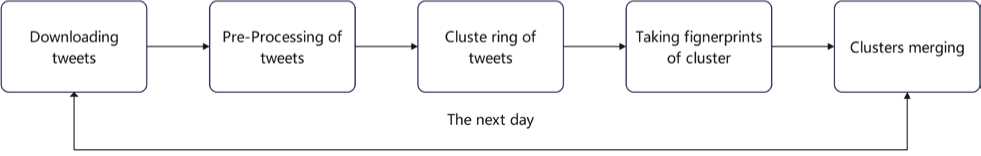
Fig. 1. Tweet analysis pipeline
Downloading tweets - The most optimal option for collecting tweets is to use the Twitter API [9]. To receive tweets in Ukrainian, can be used the "lang:uk" filter. The Twitter API does not always return tweets only in Ukrainian. There are tweets in other languages, in particular in Russian, with small sprinkles of Ukrainian. Including such tweets in the analysis will worsen the quality of the results. To improve the selection, we can put a geographical restriction on tweets, or exclude from the search tweets that contain certain letters of other alphabets, for example "-y". Tweets published at any time of the day or only during the day should also be searched to improve the quality of the sample. Then there is filtering without the participation of the Twitter API. Tweets less than 3-5 words long and tweets containing no words but only symbols, numbers, emojis or hash tags should be removed from the sample. Improving sampling is by filtering duplicates. Since performing n×n operations is an expensive/long/resource-intensive process, the algorithm is optimized by filtering only those duplicates published in a very narrow time interval.
Pre-processing of tweets - consists in the implementation of relevant processes such as cleaning the text from noise, removing stop words, stemming and lemmatization. Stop words are not limited to the set of natural language service words [10] (over 450 words for SpaCy [11]). This set can include up to 2,000 Ukrainian-language words [12]. The set of stop words can be expanded with words that are redundant only for the relevant research context. An example of such words can be the proper names of news organizations. These names are contained in every tweet of the organization and do not carry any meaning. Other proper names can influence the content, enhancing the emotional coloring.
Clustering of tweets - is used to combine tweets on common topics when analyzing the dynamics of mood changes of social groups based on their publications or reposts of Ukrainian-language tweets in social networks. For this, it is necessary to analyze the semantic content of tweets, and not to group them according to the content of keywords [6-8]. Clustering algorithms work with numeric vectors, but tweets are text data. First, you need to convert the text into a numeric vector. There are text vectorization algorithms for this. Within this research, we will consider three algorithms: Bag of Words (BOW), Term Frequency–Inverse Document Frequency (TF-IDF) and Bidirectional Encoder Representations from Transformers (BERT) [13-14]. For the obtained results, we will apply K-Means clustering algorithms, Agglomerative Hierarchical Clustering [15] and Hierarchical Density-Based Spatial Clustering of Applications with Noise (HDBSCAN) [16] within the scope of the study. This will make it possible to find the optimal combination of NLP technology with methods of clustering large information flows of Ukrainian-language text according to metrics such as execution time, evenness of distribution of clusters, silhouette assessment of clusters, share of noise clusters and share of messages with noise clusters.
Taking fingerprints of clusters - Depending on the size of the sample, the size of one cluster can reach more than 10 thousand messages. In daily analysis, the number of such clusters will grow very quickly to the point where storing and processing the clusters will become too expensive to maintain. To solve this problem, the term "cluster footprint" is used. This is a shortened version that allows you to represent the main content of the cluster and at the same time be short enough for convenient storage and quick processing. Such an imprint is implemented by various methods/technologies, for example, by saving tweets in the form of an abbreviated Bag of Words. Within the framework of this study, it was decided to create prints as sets of keywords of clusters. This format is convenient to save, use in further processing, and it does not lose the main content of the cluster. There are many tools for extracting keywords from text. This work uses the YAKE tool [17, 27-28].
Clusters merging - Since the process of creating clusters does not occur once, but daily, it is necessary to combine the results of the obtained clustering with the clusters obtained in previous days. This process is a cluster merge and is performed based on footprints. Two prints are checked for similarity. If the similarity crosses a certain threshold, then cluster footprints and their metadata, including the number of cluster tweets, are merged into one. The simplest merge option is to merge only the metadata without modifying the imprint. To obtain a more accurate result, prints are combined by markers. Sampling can be random or based on keyword weight. There are many tools for finding text similarity, in particular, for our research we will use Fuzz Sort, Fuzz Set, Levenshtein, Jaro Winkler, Jaccard, Sorensen, Cosine, Sift4.
Since the main function of the system is to research information, let's describe the organization of this process in more detail. The product should automatically collect and process the necessary information at a certain frequency, so the UML state diagram shown in Figure 2 is a great fit for describing this part.
The event has been received
Waiting
The limit of initialization attempts has been exceeded
Can’t find active text extractors
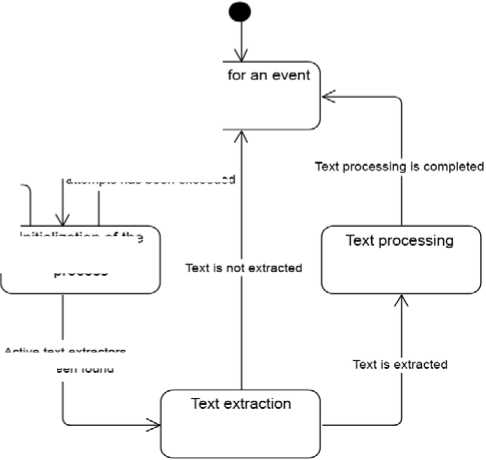

Initialization of the text extraction
process
Active text extractors have been found
Fig. 2 State diagram of the text extraction and processing system
When extracting and processing tweets, the starting point and input adapter of the component is the TextExtractionController (Fig. 3). This class is invoked after the execution environment receives a request over the network and interprets it into a programmatic call. The purpose of the class is to describe the interface for the input signal and pass it on to the TextExtractionService. This class orchestrates all the work that happens inside the component; it aggregates auxiliary components and adapters and delegates necessary tasks to them. One of its initial actions is to invoke available implementations of the TextExtractor interface. The service contains a list of different extractors and calls them in parallel.
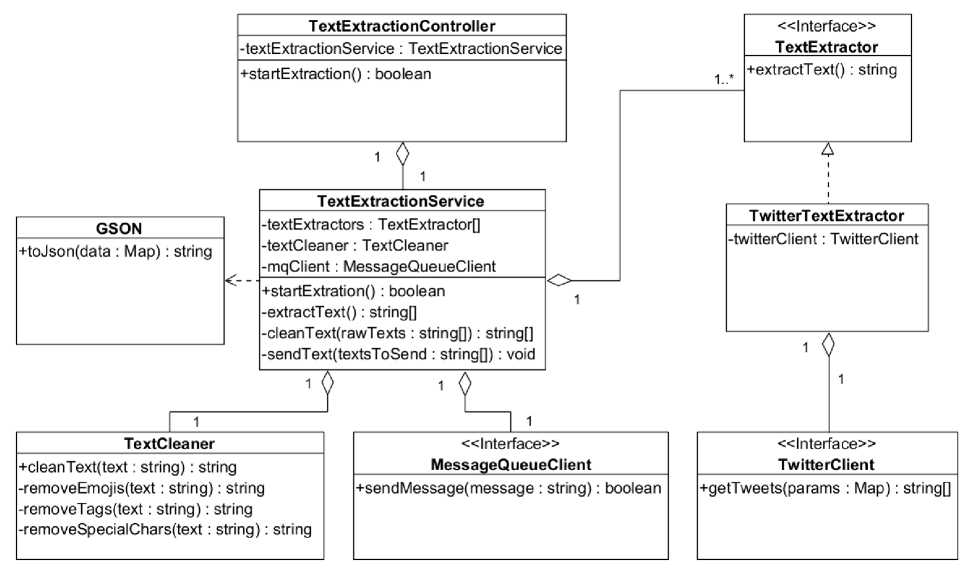
Fig. 3. Class diagram of the text extraction and processing component
TextExtractor is an interface that describes a typical extractor and its function. The purpose of this interface is to define an extractor as a class capable of gathering information from a specific source and returning it as a result of a method call. TwitterTextExtractor is an implementation of the aforementioned interface that retrieves information from the Twitter source. To achieve this, the class aggregates the implementation of the TwitterClient interface, whose methods allow retrieving data from the Twitter source. TwitterClient serves as a connector interface between the TwitterTextExtractor class and the Twitter network. The getTweets method allows retrieving tweets based on certain parameters.
After the information is collected, the service delegates the task to the TextCleaner class. The purpose of this class is to clean the text from unwanted elements that could hinder further information processing, such as special characters, tags, and more. Once the information is cleaned, the service creates a JSON object with the gathered text using the GSON class, on which it depends, and passes the text to the MessageQueueClient.
MessageQueueClient serves as a connector interface between the information gathering component and the message queue component. Through this queue, the JSON object can be passed to other components. The sendMessage method sends the message and returns the success of the operation. After modeling the information extraction and processing part of the application, it is important to consider another aspect, which is the consumption of information by users.
For a regular user, this path is quite simple: receiving data through a web application without authentication, registration, or other possible complications. However, the situation changes for an "API User." This type of user has the ability to directly obtain data from the system via the API, without using the web application. Typically, these are developers who use the data in their own systems. When opening an API, caution must be exercised, as machine processing is much faster than human processing. While a human may make 1 request, a machine can make 1000. To control this behavior, it is necessary to regulate the traffic available to each developer. The public opinion research system will utilize an external API gateway that provides similar functions. Further details on the processes involved in the API developer communication are described in the communication diagram shown in Figure 4.
A Communication diagram is a diagram that depicts the sequence of communication between different elements of the system for various processes. Steps in the diagram are identified by numerical and alphabetical notations and can expand into sub-steps and parallel steps.
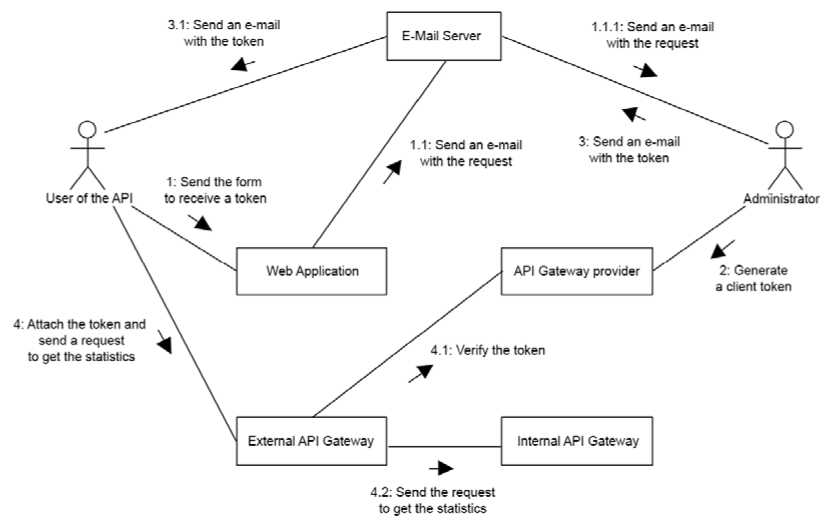
Fig. 4. Communication diagram for API user use cases
The communication of the API user in the created diagram consists of four scenarios, identified by the initial numbers from one to four, depicting the sequence of actions that the user must go through from "registration" to usage.
Authentication of API requests in the system is done using tokens, so the first scenario involves requesting this token from the system administrators. The user submits a registration form through the web application to the web server. The form includes an explanation of the purpose of API usage and an email for feedback. The web server sends an email to the system administrator via the email server.
Once the administrator processes and approves the request, they generate the required token in the API gateway provider through their account. The administrator can set usage restrictions for a particular token. When the token is generated, the administrator sends it, along with the system usage rules, to the requester via the email server.
The received token by the user signifies that they now meet all the requirements to make a request to the system. To do so, the user constructs a request, including the received token, and sends it to the server-side of the product. Initially, this request encounters the external gateway. Firstly, it verifies the authenticity of the token with the provider of this gateway and the token itself. If the token is valid, it forwards the request to the internal gateway, from where the request goes to the actual system. Before allowing the request to pass to the internal gateway, the external gateway performs a series of important checks to determine whether to allow the request or perform other actions. To describe these steps, an activity diagram was developed (see Figure 5).
An Activity diagram is a diagram that sequentially depicts actions and decisions involved in carrying out a specific process. The main elements of an activity diagram are actions, decisions, transitions, and swimlanes. Actions and decisions represent specific operations, transitions establish their sequence, and swimlanes indicate the participants executing the actions.
The modeled process starts with the user sending an API request to the external API gateway. Upon receiving the request, the verification process begins. Firstly, it is determined whether the request is anonymous (no token embedded) or not. If the request is anonymous, a guest token, shared among all anonymous users, is used for further checks. Otherwise, the token is passed to the provider for validation. The provider verifies the authenticity and expiration status of the token. If the token is invalid or expired, the request is rejected. If it is valid, the gateway performs additional checks.
Firstly, the maximum number of available applications for this token is checked. If the limit has been reached, the request is rejected as this token cannot be used within certain time limits. If the token is still usable but its designated throughput for a unit of time has been exceeded, the request will be suspended, meaning the developer needs to retry the request after a certain period, for example, 1 second, for it to go through. When all the checks are successfully passed, the request becomes legitimate to be sent to the internal system.
Text extraction, processing, and gateways are important components of the system, but they are only parts of it. A detailed view of individual parts of the system is valuable for better understanding its operational principles, but obtaining a holistic view of the developed product is critically important in system design. Several UML diagrams serve this purpose. They aim to illustrate the system's structure, its components, and the relationships between them. To start with, a component diagram was developed, depicted in Figure 6.
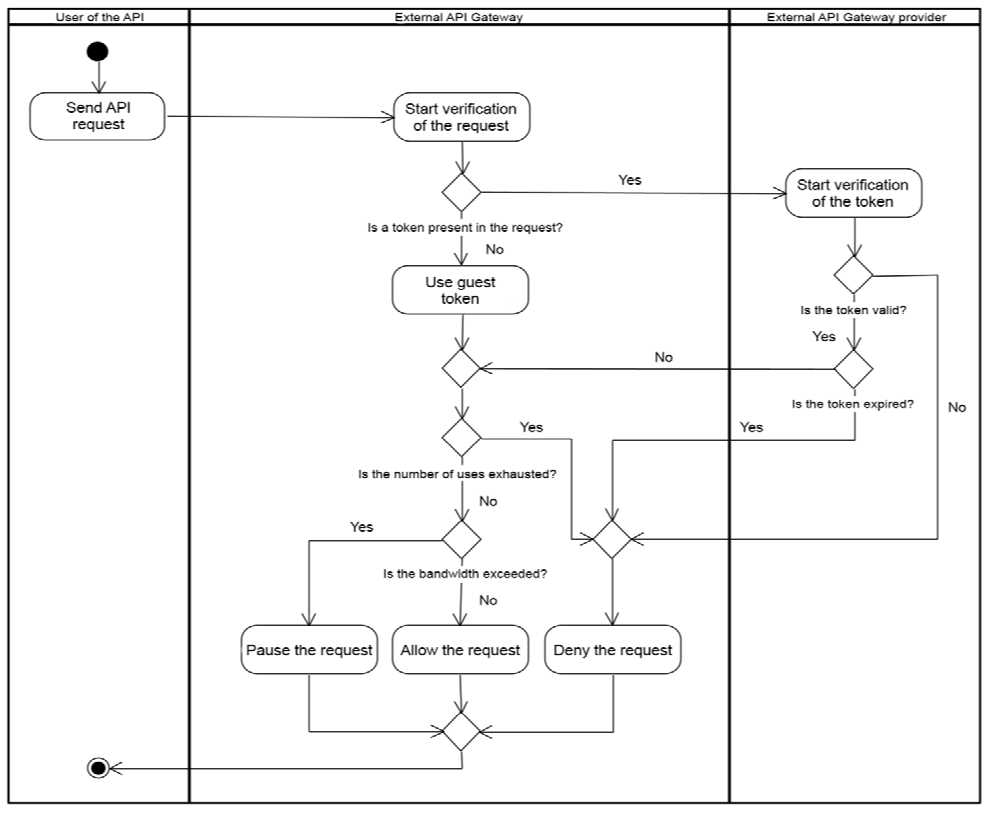
Fig. 5. Activity diagram of request processing by the external API gateway
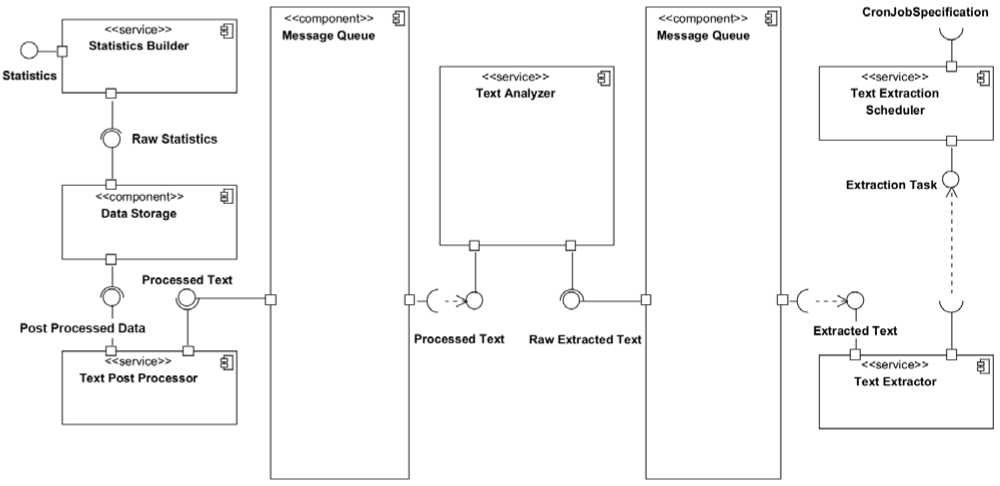
Fig. 6. System Component Diagram
The created diagram in Figure 6 includes components of the "component" and "service" stereotypes, representing individual services in a defined microservices architecture. The entry point of the system is the CronJobSpecification service of TextExtractionScheduler. This service is responsible for scheduling data extraction and processing, and its input interface is the configuration of the start schedule for these processes. According to the service specification, the service creates an ExtractionTask and passes it to the TextExtractor component, which performs data extraction and cleansing. The extracted data is then passed to the MessageQueue, which separates different parts of the system.
From the MessageQueue, the raw data goes to the TextAnalyzer service. This intelligent module converts the input text into a set of words required for building statistics. These data are again passed to the MessageQueue. These message queues enable asynchronous communication between components, thereby reducing their coupling. The processed data then reach the TextPostProcessor. This service structures the received data in the DataStorage, which is the main product of the system. These data can be transformed into statistics or provided through an API. The statistics are passed through the StatisticsBuilder, which transforms the data stored in the storage into consumable statistics for system users.
Components are software elements abstracted from physical hardware, but the physical layout and application of these components are also important aspects of system design. The physical structure influences system characteristics such as cost, reliability, speed, security, and more. Most interactions during system usage occur at the physical level. To depict the physical structure of the system, a deployment diagram was developed in Figure 7.
The constructed diagram in Figure 8 illustrates the deployment of services on devices and their interaction with the client device, data storage, message queue, auxiliary services, and gateways.
The communication starts from the client computing machine, which hosts a web browser with a web application. It communicates with the API gateway server, which is configured using API specifications. This gateway communicates with the internal gateway through the HTTP protocol. Like all self-deployed applications, the internal API gateway resides on a virtual server, which is hosted on a physical server for which the provider does not provide details. The internal gateway forwards requests to the deployed services via HTTP. The database is located on a separate server and is determined by its schema. Services communicate with it through TCP/IP. The message queue is also deployed on a virtual server. Interaction with internal services occurs through the Advanced Message Queuing Protocol (AMQP) for message queues. Two additional deployed services, Discovery and Configuration, are essential for the functioning of the entire system. These services are communicated with by all other created applications. The Discovery service serves as a registry of all services, allowing one service to obtain the IP of another service using its name. It can also perform load balancing among service replicas. The Configuration service contains the settings for each service and passes these configurations to the corresponding applications. Let's take a closer look at how these services work. For this purpose, a sequence diagram was constructed in Figure 8.
A Sequence diagram is a diagram that allows representing the sequence of actions of objects relative to their lifecycles.
The constructed sequence diagram shows the sequence of initial service configurations after their startup. First, the Discovery service is launched. Then, the Configuration service is started. It registers with the Discovery service and passes its IP and name. Now, other services can obtain the required IP using this name. The Discovery service returns information about the registry.
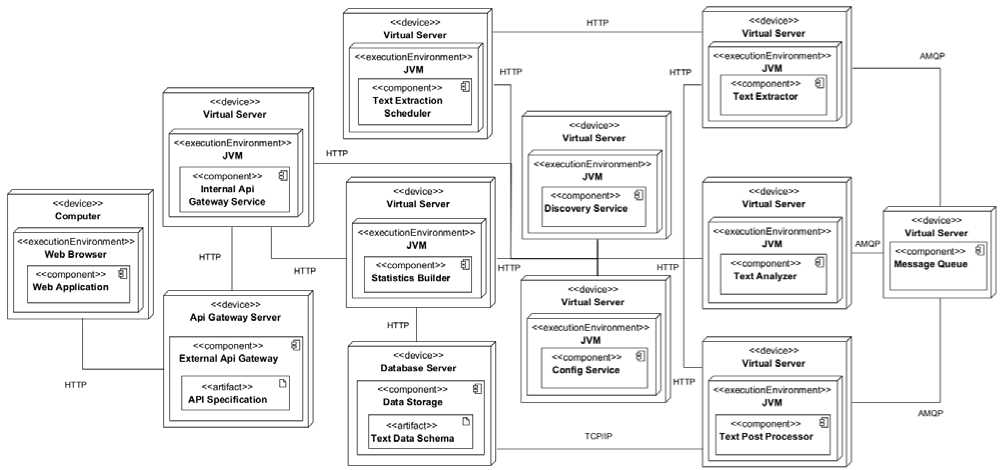
Fig. 7. System Deployment Diagram
: Config Service
: Discovery Service
: API Gateway Service
: Statistics Builder Service
: Text Post Processor Service
: Text Analyzer Service
: Text Extractor Service
: Text Extractor Scheduler Service
-
1: register(ip.serviceName)
-
1.1: info
par
-
-
2: register(ip,serviceName)
-
2.1: info
-
-
3: getConfig(serviceName)
-
3.1: config
-
-
4.1: info
। 4: register(ip.serviceName)
-
5: getConfig(serviceName)
-
5.1: config
-
-
6: register(ip.serviceName)
-
6.1: info
-
-
7: getConfig(serviceName)
-
7.1: config
-
-
8: register(ip,serviceName)
-
8.1: info
-
-
9: getConfig(serviceName)
-
9.1: info I
-
-
10: register(ip,serviceName)
i 10.1: info i
11: getConfig(serviceName)
11.1: config
12: register(ip.serviceName)12.1: info
13: getConfig(serviceName) ________13.1: config |_________________
4. Results
Fig. 8. System Initialization Sequence Diagram
Now each of the services that contain the application logic registers with the discovery service, obtains the IP address of the configuration service, and requests configuration for its own name from it. The configuration service returns the required configuration file. These services make parallel requests to the configuration and discovery services independently of other services. After the initialization stage, the services are fully ready to operate. To change the configuration of a specific service, there is no need to restart the entire system; it is sufficient to restart the specific service. It will re-register and initialize itself based on the updated configuration.
The intelligent public opinion research system based on the analysis of Ukrainian-language tweets is a system built on a microservices architecture, which means it belongs to the distributed type. The system is divided into microservices, each of which is a separate application that can be launched and managed independently of others. For the convenience of deployment and management of the entire system, services do not deliver executable artifacts directly; instead, they package them into Docker images, which are then deployed simultaneously using the Kubernetes container orchestrator. The deployment configuration is contained in a single Kubernetes YAML file.
The system consists of the following business services:
-
• Text Extraction Scheduler : serves as the initiator of processes in the system. It schedules signals for tweet collection.
-
• Text Extractor : performs scheduled tweet collection and passes the collected data further along the chain.
-
• Text Analyzer : performs the intelligent part of tweet processing. It transforms a set of tweets into a stream of tweet clusters.
-
• Text Post Processor : a service that combines the stream of tweet clusters obtained from the Text Analyzer service with previous clusters to generate historical data. It applies transformers to create tweets. The results of all operations are stored in a database.
-
• Statistics Builder : generates statistics for display to the client and responds to related queries.
-
• Web Application : a client application that displays public opinion statistics and other necessary information.
In addition, there are auxiliary applications:
-
• Message Queue : RabbitMQ message broker that facilitates asynchronous inter-service communication.
-
• Database : MongoDB data storage.
-
• Discovery Service : registry of running services in the system.
-
• Config Service : provides configuration to the running services.
-
• API Gateway Service : the entry point to the system.
The developed system exhibits a high level of modularity. Modules are present at all levels, with each microservice being a separate functional module. At lower levels, there are modules for packages, classes, and methods. Let's consider the low-level modules present in the system. Each method-level module resides within a specific class, typically responsible for the business logic of the system.
Text Extraction Scheduler:
-
• SchedulerService.setPlan: schedules plan invocations based on the received specification.
-
• SchedulerService.executePlan: triggers the necessary tweet collection process by notifying the corresponding service.
Text Extractor:
-
• TwitterTextExtractor.extractText : calls the Twitter client to retrieve tweets.
-
• TwitterClient : invokes the Twitter API.
-
• MessageQueueClient.sendMessage : sends messages to RabbitMQ.
-
• TextCleaner.cleanText : cleans the text from noise.
-
• TextExtractionService.startExtraction : manages the process of tweet collection, cleaning, and forwarding.
Text Analyzer:
-
• StemmingService.stemmText : performs stemming on the text.
-
• LemmatizationService.lemmatizeText : performs lemmatization on the text.
-
• VectorizingService.vectorizeText : converts the text into a vector using the selected algorithm.
-
• ClusterizationService.clusterizeText : transforms the text into a stream of clusters.
-
• TextAnalyzingManager.analyzeIncomingTweets : orchestrates the process of transforming incoming tweets into tweet clusters and forwarding them along the chain.
Text Post Processor:
-
• TextSimilarityService.compareTexts : compares two texts and returns their similarity level in percentages.
-
• ClusterMergingService.tryMerge : merges two clusters if possible.
-
• TwitterTrendStreamProcessor.processStream : processes a tweet stream to generate tweet trend statistics.
-
• TwitterSentimentStreamProcessor.processStream : processes a tweet stream to generate sentiment statistics.
-
• ClusterStreamRepository.loadStream, writeStream : loads or writes the tweet stream to the MongoDB repository.
-
• StatisticsRepository.loadStatistics, writeStatistics : loads or writes public opinion statistics to MongoDB.
-
• TweetPostProcessingManager.processAcceptedTweets : merges the received clusters with previous clusters, transforms them into statistics, and updates the MongoDB data.
Statistics Builder:
-
• StatisticsService.getStatistics : retrieves statistics for display on the website.
-
• StatisticsService.getStatisticsForAPI : retrieves statistics for API interaction.
-
• StatisticsService.getClustersStreamForAPI : retrieves a tweet stream for API interaction.
-
• FeedbackService.sendFeedback : sends received feedback to the administrator's email.
-
• EmailService.sendEmail : sends an email to the specified address.
All processes within the system are automatically executed within the system itself. Interaction with users is limited to receiving preprocessed data and changing the system's configuration. External communication with the system goes through an API Gateway, which also filters the requests.
The main use cases of the system are focused on user interaction with the website. The website's functionality consists of three tabs. When users access the website, they land on the first tab called "Statistics." This tab displays the latest public opinion statistics obtained from internal processes. In addition to the statistics, the date of the last statistics generation is also displayed. Clicking on the second tab, "About Project," takes users to a page with static data describing the project and providing contact information. The last tab, "Leave Feedback," leads to a page with a feedback form. When a user submits feedback, the server sends an email to the service email address. Users can optionally provide their email for feedback purposes.
External developers have access to additional functionality of the system. They can retrieve statistics and raw data through the API. To do so, they need to send a GET HTTP request to the endpoints /statistics/stream to obtain the cluster stream, and /statistics/trend and /statistics/sentiment to retrieve popularity trends and sentiment analysis of tweets, respectively. Authentication requires including a token in the request.
The system administrator can configure the schedule of process execution through the API. They can send HTTP requests to the /scheduler/cron endpoint. A GET request retrieves the current cron expression, while a PUT request sets a new cron expression. Authentication and authorization require including a token in the request.
Request authentication and authorization are handled by an external AWS service and are not part of the application's developed functionality. Processes such as communication with users via email or managing access tokens are performed through external systems and are not considered internal functionality.
Let's now discuss the data storage within the system. The system utilizes a NoSQL MongoDB document database as the storage solution. Two services interact with this storage: the Text Post Processor (for read and write operations) and the Statistics Builder (for read operations only). This separation allows for decoupling of services and reduces dependencies. Data in this storage is stored as JSON documents. For the developed system, it is sufficient to store two documents: the cluster stream document and the statistics document.
The cluster stream document contains concise data about all clusters. Each cluster includes a clusterPrint field, which stores the cluster's fingerprint, and an array of cluster metadata for each registered timestamp. In addition to the retrieved values, the metadata contains aggregated information about the tweets (likes, comments). The second document stored by the system is the statistics document. It is a JSON collection of statistics resulting from processing the cluster stream. Each statistic has a type (trend statistics, sentiment statistics) and a date. It represents a timeline of statistics with different stages over time. Each data point in the statistic is characterized by a title, timestamp, and a list of topic data and values. Both documents are entirely independent of each other.
The system can employ various methods and approaches for text processing. To determine the suitability and effectiveness of each method, we will compare them and evaluate their impact on the results. The first important aspect to investigate is stemming and lemmatization of the input text. Using these approaches significantly reduces the vocabulary size for processing by bringing words to a common form. In Table 1, we will track the influence of stemming and lemmatization on tweet processing based on a sample of 9,000 tweets.
Table 1. Investigation of the Impact of Stemming and Lemmatization on the Sample
|
Method |
Vocabulary |
Execution Time (ms) |
|
Original |
15962 |
- |
|
Stemming |
9543 |
1292 |
|
Lemmatization |
10770 |
647 |
According to the results, both approaches reduce the vocabulary by approximately one-third. The stemming technique reduces the vocabulary slightly more, but it also takes twice as much time to execute. Since lemmatization brings words to their base form instead of truncating them, the text retains more semantic completeness after this processing. After the pre-processing of the text, vectorization and clustering of the text take place. Considering the peculiarities of the Ukrainian language and the tools available for its processing, it is impossible to determine precisely which clustering and vectorization algorithms will yield the most optimal results. A comparison of approaches will be conducted based on a sample of 5000 tweets.
We believe that the text has been pre-processed based on proposal in [18-23, 28-29]. Considering the peculiarities of the Ukrainian language and the tools for its processing [19], it is impossible to determine exactly which algorithm of clustering and vectorization will give the most optimal result. To evaluate the results of clustering, we introduce a number of parameters:
-
• t – execution time;
-
• о % - the ratio of the standard deviation to the mean value. Allows you to assess the uniformity of the distribution of clusters;
-
• Silhouette coefficient (sc) – silhouette score of clusters, which shows how distributed the clusters are among themselves. It is within [-1; 1], where -1 means that the clusters are distributed incorrectly, 1 means that the clusters are well distributed, and 0 means that the distance between the clusters is not significant enough to estimate the cluster distribution;
-
• Noise clusters % (nc %) – the ratio of the number of clusters that are unsuitable for further use to the total number of clusters. These are clusters containing too few tweets (less than 5) or clusters containing too many messages to display only 1 topic (more than 20% of the sample);
-
• Noise % (n %) – the ratio of the number of noisy cluster messages to the sample size.
The comparison of approaches will be based on a sample of 5,000 tweets.
-
1. K-Means with different text vectorization algorithms. In Fig. 9 (the X-axis denotes the cluster number, and the Y-axis the cluster size) and Table 2 presents the results of K-Means clustering. We create 100 clusters for each option.
-
2. Agglomerative clustering with various text vectorization algorithms. The input set shows quite excellent results
-
3. HDBSCAN algorithm with different text vectorization algorithms. The HDBSCAN algorithm also determines the number of clusters dynamically, and it also determines the noise own hand (Fig. 11, Table 4). This means that there are no noisy clusters in the clustering result, since all noisy messages are filtered out in the process, so the nc parameter disappears from the result. Since the algorithm determines the noise by itself, instead of the silent estimate, we use the DBCV estimate [24] to determine the distribution of clusters, which takes the noise into account, and also uses density, not distance, for measurement. This estimate also lies within [-1; 1].
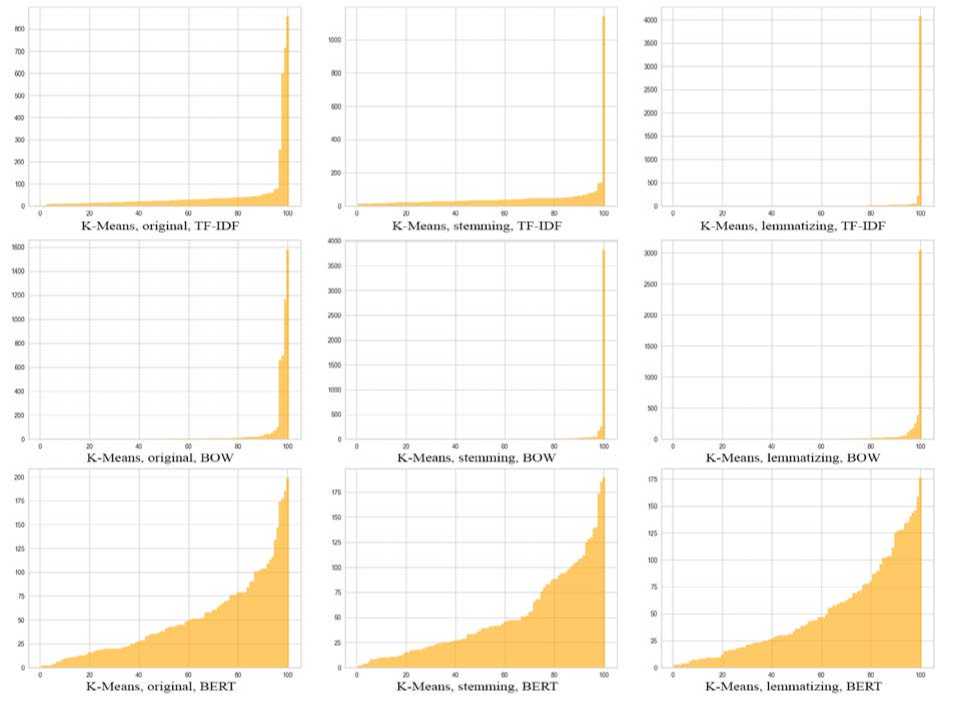
Fig. 9. Bar charts of variation of approaches for K-Means
Table 2. Results of variations clustering of approaches for K-Means
|
№ |
Variant |
t, seconds |
a % |
sc |
nc % |
n % |
|
1 |
original + TF-IDF |
9.170 |
246 |
0.051 |
2 |
0.08 |
|
2 |
stemming + TF-IDF |
6.246 |
223 |
0.058 |
1 |
22.8 |
|
3 |
lemmatizing + TF-IDF |
8.246 |
405 |
0.026 |
66 |
84.4 |
|
4 |
original + BOW |
11.308 |
426 |
-0.028 |
62 |
57.7 |
|
5 |
stemming + BOW |
8.558 |
761 |
0.008 |
67 |
79.5 |
|
6 |
lemmatizing + BOW |
9.551 |
612 |
-0.026 |
59 |
63.88 |
|
7 |
original + BERT |
438.03 |
85 |
0.033 |
6 |
0.30 |
|
8 |
stemming + BERT |
385.74 |
84 |
0.040 |
4 |
0.24 |
|
9 |
lemmatizing + BERT |
462.37 |
84 |
0.038 |
6 |
0.42 |
The results show that using Bag of Words vectorization loses in any case. Although the execution time is small, such clusters contain a very large deviation, a significant amount of noise, and a poor silhouette estimate. BOW is the most simple and clear approach to text vectorization. But the counting of words in the texts, followed by labeling through 0/1 in the vector as the absence/presence of that word in the tweets, so to speak, blurs the boundaries of the clusters.
Using TF-IDF for vectorization gives better results and less noise in less time. Also, this vectorizer gives the best silhouette estimate, but the deviation percentage is still high. Stemming by bringing the word to the base improved the clustering result, unlike lemmatization. Since TF-IDF is implemented through the analysis of the inverse frequency of the document, which affects the importance of words, taking into account their frequency in the entire sample of tweets. Such vectorization separates widely used from rare words, which allows better definition of keywords during clustering.
In addition, the analysis of the bases of Ukrainian words demarcates clusters much more clearly than the analysis of base words with inflections (dictionary).
BERT vectorization provides the best overall result, producing the least bias, very low noise, and average silhouette estimation. However, the execution time of such options exceeds the execution time of the previous ones by dozens of times, which can become a problem when processing larger tweet samples of thousands or hundreds of thousands of tweets. Stemming in most cases improves the result of BERT clustering, reducing its execution time, also reducing deviations and improving silhouette estimation. Lemmatization, on the contrary, increases time, noise, and deviation when studying Ukrainian-language tweets.
Since the next clustering algorithms to be studied determine the number of clusters dynamically, we add one more exponent (k) to the results, which means the number of clusters.
for Agglomerative clustering compared to K-Means (Fig. 10, Table 3).
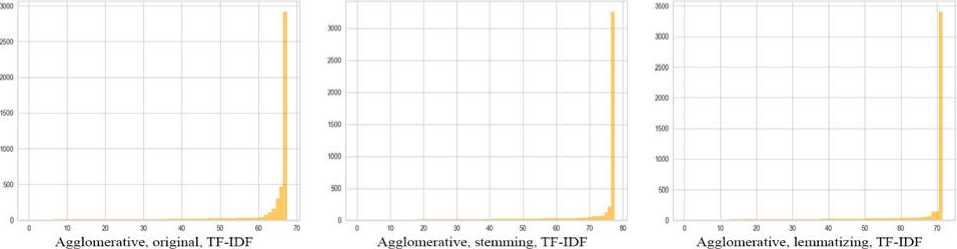
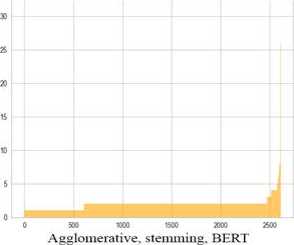
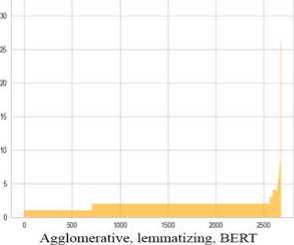
Fig. 10. Bar charts of variations of approaches for Agglomerative clustering
Table 3. Clustering results of variations of approaches for Agglomerative clustering
|
№ |
Variant |
k |
t, seconds |
a % |
sc |
nc % |
n % |
|
1 |
original + TF-IDF |
67 |
169.13 |
477 |
0.04 |
1 |
58.3 |
|
2 |
stemming + TF-IDF |
77 |
93.66 |
565 |
0.05 |
1 |
65 |
|
3 |
lemmatizing + TF-IDF |
71 |
107.17 |
566 |
0.05 |
1 |
68 |
|
4 |
original + BOW |
2535 |
162.77 |
136 |
0.076 |
98 |
88.4 |
|
5 |
stemming + BOW |
2442 |
97.14 |
202 |
0.75 |
97 |
85.9 |
|
6 |
lemmatizing + BOW |
2485 |
109.02 |
190 |
0.75 |
98 |
87.5 |
|
7 |
original + BERT |
2707 |
483.96 |
59 |
0.80 |
99 |
94 |
|
8 |
stemming + BERT |
2611 |
472.98 |
58 |
0.80 |
99 |
94 |
|
9 |
lemmatizing + BERT |
2677 |
450.55 |
60 |
0.80 |
99 |
94 |
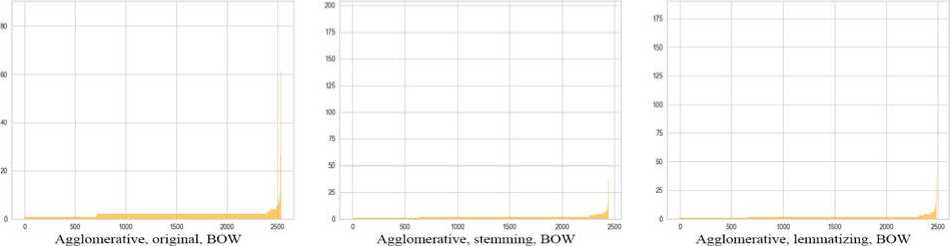
Agglomerative clustering takes more time than k-means, while applying TD-IDF vectorization gives quite mediocre results. However, with BOW and BERT vectors, the situation changes radically. Deviation and silhouette assessment acquire very positive values, but the number of clusters reaches more than 2500, and the noise reaches 99%. Almost all clusters contain only a few tweets, which is not surprising with such a large number of clusters. On the other hand, when using other input parameters, it is possible to achieve a low number of clusters with a low level of noise. Stemming and lemmatization do not have a particular impact on the quality of clustering, but can significantly reduce processing time.
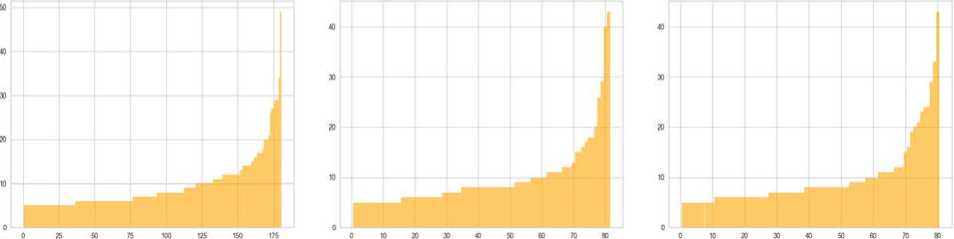
HDBSCAN, original. TF-IDF HDBSCAN. stemming. TF-IDF HDBSCAN. lemmatizing, TF-IDF
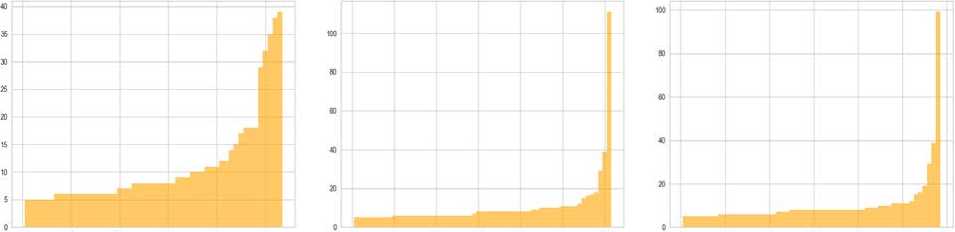
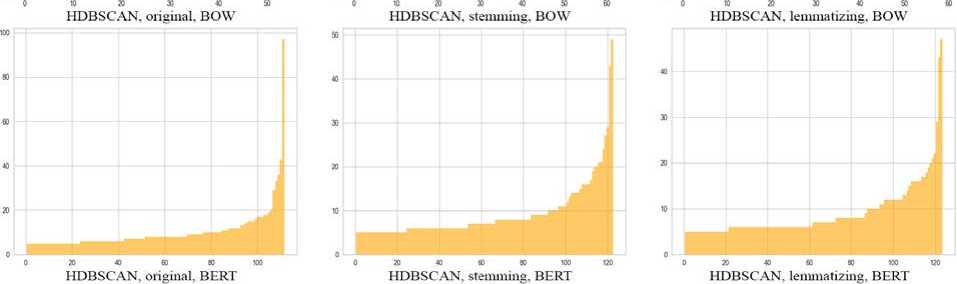
Fig. 11. Bar graphs of variation of approaches for HDBSCAN
Table 4. Results of clustering variations of approaches for HDBSCAN
|
№ |
Variant |
k |
t, seconds |
a % |
dbcv |
n % |
|
1 |
original + TF-IDF |
180 |
471.10 |
65 |
0.050 |
66.1 |
|
2 |
stemming + TF-IDF |
81 |
378.89 |
70 |
0.027 |
84.3 |
|
3 |
lemmatizing + TF-IDF |
80 |
461.87 |
68 |
0.028 |
84.3 |
|
4 |
original + BOW |
53 |
599.43 |
76 |
0.030 |
88.2 |
|
5 |
stemming + BOW |
61 |
378.09 |
134 |
0.034 |
87.2 |
|
6 |
lemmatizing + BOW |
58 |
487.75 |
124 |
0.035 |
87.9 |
|
7 |
original + BERT |
111 |
477.76 |
101 |
0.074 |
77.2 |
|
8 |
stemming + BERT |
122 |
442.50 |
72 |
0.068 |
77.3 |
|
9 |
lemmatizing + BERT |
123 |
486.91 |
69 |
0.063 |
77.6 |
Combining NLP methods with HDBSCAN gives the best results. The number of clusters for a sample of 5000 tweets is between 50 and 200, the deviation does not exceed 200%, and the dbcv score does not acquire negative values. However, the variants with HDBSCAN take the longest to process and also filter out a lot of noise.
According to the results of the clustering (Fig. 12-14), the optimal solutions are the use of the HDBSCAN clustering algorithm and the BERT vectorization algorithm to achieve the most accurate results, and the use of K-Means together with TF-IDF to achieve the best performance with the optimal result. Stemming can be used to reduce execution time.
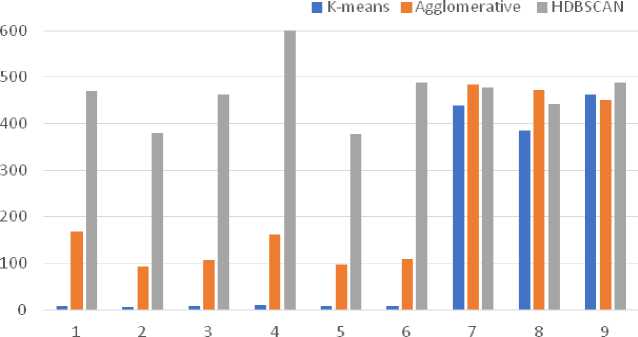
Fig. 12. Bar charts of variations of execution time metrics t
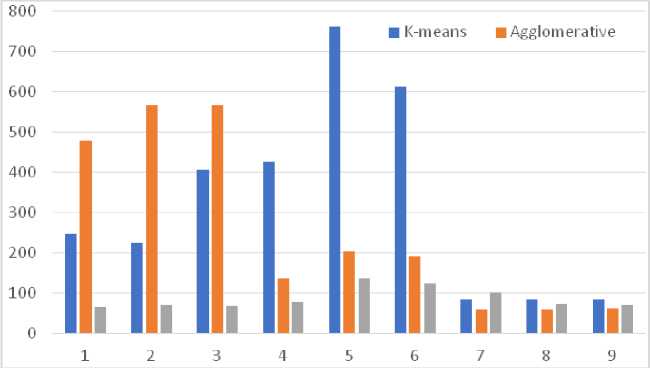
Fig. 13 Bar charts of variations of the cluster distribution dimension metric σ
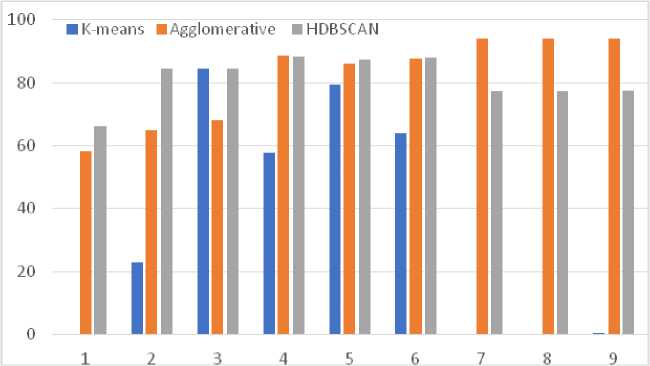
Fig. 14. Bar charts of variations of the noise metric n in the information flow of tweets
Next, we will combine the results of the analysis of tweets for two consecutive days by merging clusters with similar impressions. To do this, we will analyze the effectiveness of different methods of finding the similarity of fingerprints for Ukrainian-language tweets. Consider some well-known similarity search algorithms such as Fuzz sort, Fuzz set, Levenshtein, Jaro Winkler, Jaccard, Sorensen, Cosine and Sift4. Let's create two sets of clusters of 9000 tweets in one day, each set will contain 4500 tweets taken from a random sample. In this way, sets of clusters are created that will definitely contain similar elements. To test the algorithms, two sets of clusters of 100 clusters each were created. These sets of clusters are created based on a single day's messages selected in a staggered fashion. That is, the first set contains 1, 3, 5, ... messages, the second set contains 2, 4, 6... Due to this, two similar sets are created, but not identical. Next, for each algorithm, a pairwise comparison of clusters is performed. This is 100*100 = 10,000 checks. Of these 10,000 checks, only those checks for which similar clusters coincide, no more than 100 (that is, no more than 1%), should be truly similar. The rest should be different. From these 10,000 tests, we obtain an average value, the one that would be obtained in real conditions in most cases, and compare it with the one obtained by checking manually selected similar clusters.
Fig. 15 presents histograms with the results of algorithm checks, where similarities are placed on the X axis, and their frequency during checks is on the Y axis. In addition, two clusters were manually selected from the two sets, the prints of which should have a high similarity. In this way, it is possible to check the difference between the result of checking similar clusters and the average results.
For comparison, we will use the following metrics:t – comparison time;
-
• ^ avg — average similarity;
-
• S 1 - similarity of manually selected clusters;
-
• S j - similarity difference.
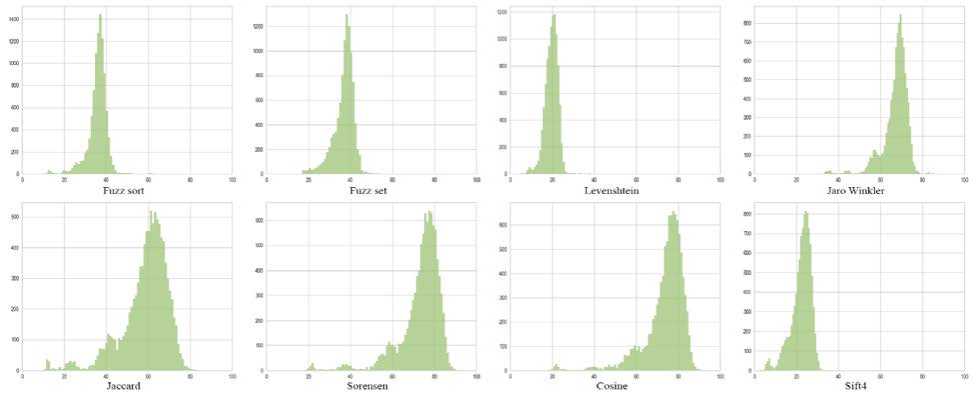
Fig. 15. Histograms of similarities of cluster checks by different algorithms
Almost all algorithms performed 10,000 tests quite quickly, with the exception of Sift4 (Fig. 15, Table 5). Execution time plays an important role when you need to perform a significant number of such checks, often and quickly. Some algorithms have a very low difference between medium similarity and high similarity (< 20%). Such algorithms are not the optimal choice for comparisons of cluster fingerprints, since it is more difficult for them to choose the limit at which a cluster is considered similar. Algorithms using the Levenshtein Distance, i.e. fuzz sort, fuzz set, and levenshtein, showed the best results (Fig. 16). These algorithms quickly perform checks, have a greater difference in similarities, so it is possible to more accurately determine the limit of similarity.
Table 5. Results of comparison of text similarity determination algorithms
|
Algorithm |
t, seconds |
s avg , % |
s 1 , % |
s Δ , % |
|
Fuzz sort |
1.79 |
35.72 |
68 |
32.28 |
|
Fuzz set |
1.70 |
36.71 |
97 |
60.29 |
|
Levenshtein |
0.42 |
19.62 |
48.05 |
28.43 |
|
Jaro Winkler |
0.31 |
67.15 |
86.66 |
19.51 |
|
Jaccard |
1.25 |
58.48 |
75.37 |
16.89 |
|
Sorensen |
1.10 |
73.07 |
85.96 |
12.89 |
|
Cosine |
1.09 |
73.56 |
86 |
12.44 |
|
Sift4 |
25.44 |
22.40 |
42.74 |
20.34 |
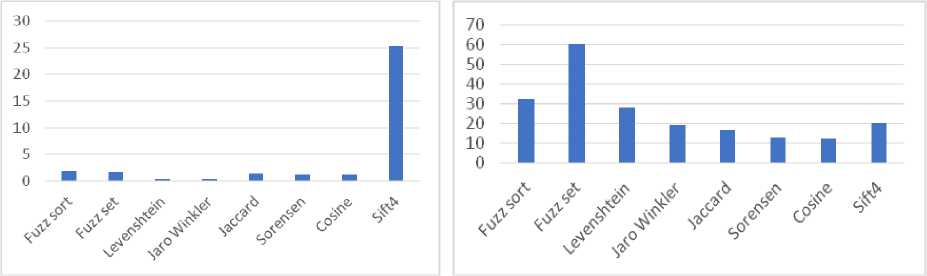
Fig. 16. Comparison of methods for determining text similarity by verification time and difference of similarities
5. Discussion
We implement the pipeline process for the 1st week. To do this, we will sample tweets from seven days of the week, 9000 tweets from each day (63 thousand tweets), perform clustering based on TF-IDF vectorization and K-Means, merging through Fuzz sort, and present the popularity of the selected clusters on a graph with a similarity limit 55% (Fig. 17).
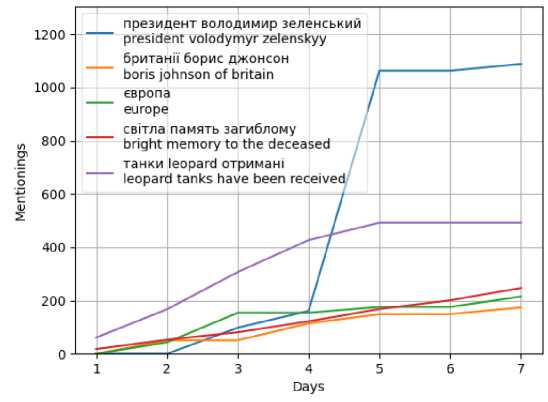
Fig. 17. Graph of topic popularity during the week for K-Means
As we can see from the graph for February 2023, tweets with the keywords President Volodymyr Zelenskyi (blue) and Leopard tanks received (purple) remain the most relevant topics for Ukrainians. In second place in popularity are the themes of bright memory of the deceased (red), Europe (green) and Boris Johnson (orange).
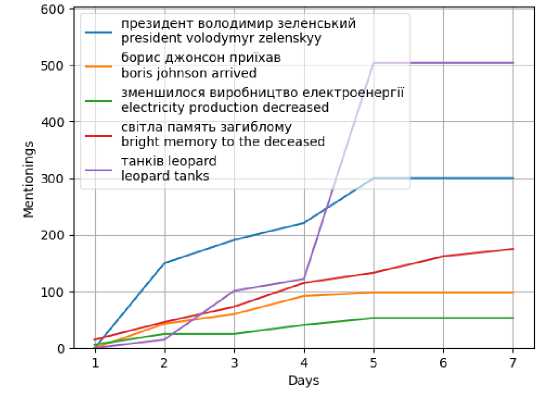
Fig. 18. Graph of topic popularity during the week for Agglomerative
We also implement the pipeline for other clustering algorithms. Agglomerative clustering was characterized by instability, but fairly balanced results were achieved in combination with TF-IDF vectorization. We will provide a demo pipeline for this combination (Fig. 18).
The set of topics for this option is similar to the previous one, with the exception of the Europe topic (there was a change to the topic - electricity production decreased - green). The distribution of mentions is also similar, but in this version it is more even. After all, the price of a small improvement in cluster evenness is a significant increase in execution time.
The last combination for analysis is HDBSCAN + BERT (Fig. 19).
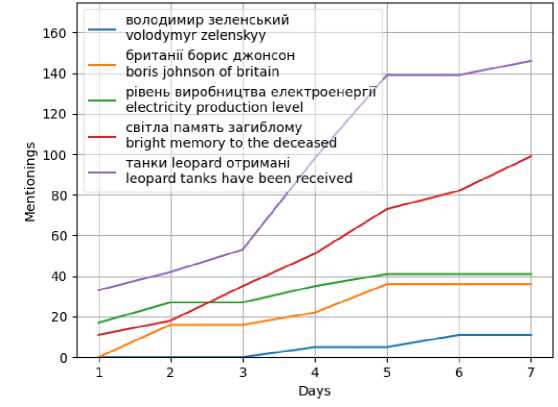
Fig. 19. Graph of topic popularity during the week for HDBSCAN
This study showed the best quality metrics of the clusters in their analysis (Table 5). The distribution of topics for such a combination practically coincides with the result for Agglomerative (Fig. 18). It can be seen from the resulting graph that the total number of mentions of each of the topics is small. This is the result of identifying a significant number of tweets as noise. The analysis execution time is several times higher than Agglomerative clustering, which makes this approach unsuitable for daily analysis of a large number of tweets (> 100,000).
The developed system is based on a microservices architecture, where each service performs a specific part of the work. All services are collectively deployed as a Kubernetes cluster. To display the research results, a website has been developed that showcases the statistics of public opinion among Ukrainians and updates the data on a daily basis. When opening the developed website, the user is immediately directed to the main page with the statistics (Figure 20).
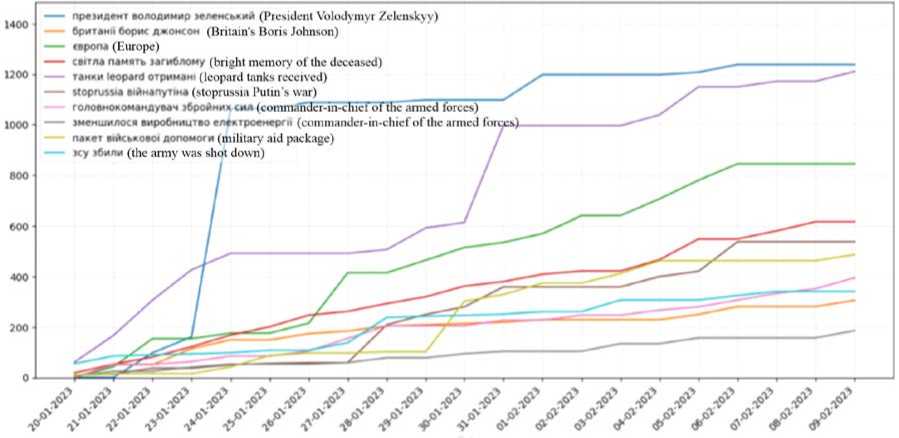
Fig. 20. Example of analysis results of Ukrainian-language tweets for a specific period
The first graph at the top of the page is the trend graph of Ukrainians' public opinion. It shows the most popular topics within the Ukrainian Twitter community during a specific period. The graph displays the top 10 trending topics. In the analyzed period, the most popular topics included "Europe," "Ukrainian Armed Forces shot down," and others.
Next is the graph of positive topics (Figure 21). It is presented in the same style as the trend graph but includes only the top 5 most positive topics. The rating on this graph represents the ratio of positive words related to a specific topic to the total mentions of that topic. Therefore, the graph of the most positive topics includes points such as "President Volodymyr Zelensky," "In loving memory of the fallen," and others.
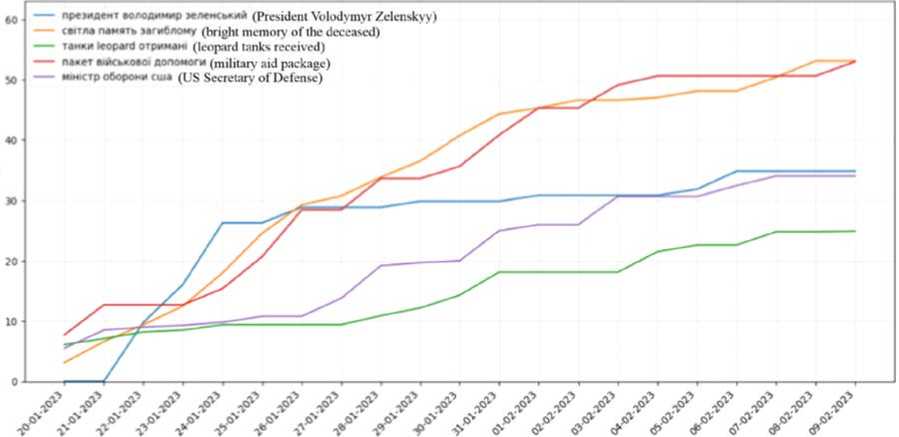
-- WMMT КЛОАИМИР кмжиий (President Volodymyr Zelenskyy) сейм паиат» мгпвлому (bright memory of the deceased)
--- темни leopard о три мема (leopard tanks received)
--- панет а«йсммо< допоют (military aid package)
--- ммстр оборони cum (US Secretary of Defense)
Fig. 21. Positive topics statistics graph
The last graph on the statistics page is the graph of negative topics (Fig. 22). Its construction and representation follow the same principles as the previous graph. The negative topics depicted on this graph include "Russia war," "stoprussia Putin's war," and others.
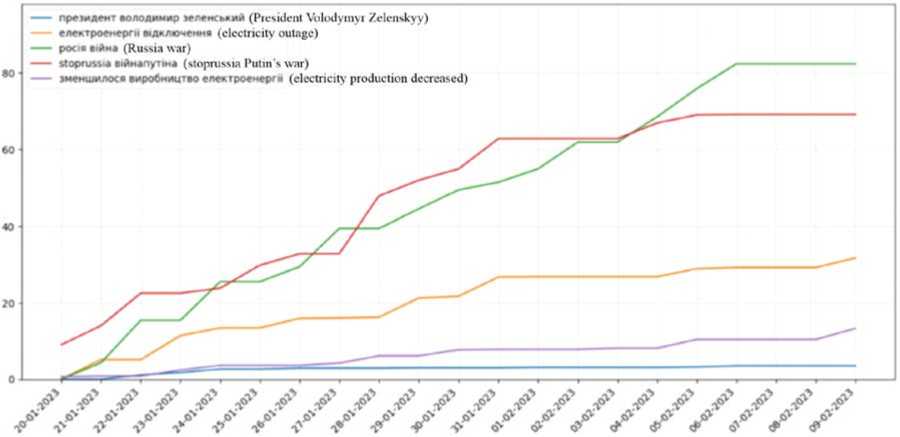
Fig. 22. Negative topics statistics graph
Thus, the website provides up-to-date and valuable information about public opinion in Ukraine.
6. Conclusions
As a result of the research, a system has been developed that is not vulnerable to the constraints described above. The system collects public statements of Ukrainian citizens on Twitter, processes them, and provides two types of public opinion statistics:
-
• Popular topic statistics in Ukraine , displaying the most frequently mentioned topics on the Twitter social network.
-
• Positive and negative topic statistics in Ukraine , identifying topics with the highest positive and negative emotional sentiment expressed in tweets by users from Ukraine.
This system allows businesses, government officials, and individuals to gain insights into public opinion without conducting expensive surveys or research. It can be used to understand consumer preferences, political sentiments, or identify social issues that require attention. The main users of the system can include media organizations, government entities, independent researchers, and developers of other systems.
As a result of the experiments, a pipeline for collecting and processing Ukrainian-language tweets was implemented. At different stages of development, experiments were conducted to determine the effectiveness of certain NLP approaches, algorithms or tools.
The core of the developed system is a pipeline of processes that is executed daily and covers the entire range of tasks from data collection to generating final statistics, utilizing both conventional and intelligent data processing algorithms.
The pipeline includes processes such as collecting tweets through the Twitter API v2, tweet filtering, preprocessing of tweets using stemming and lemmatization methods, text processing using regular expressions, text vectorization using algorithms such as TF-IDF, Bag of Words, BERT, and subsequent clustering using algorithms like K-Means, Agglomerative Clustering, HDBSCAN, and merging clusters by merging their representations. The obtained clusters are further processed to generate the final statistics.
The developed system is based on a microservices architecture, where each service performs a specific part of the work. All services are deployed as a Kubernetes cluster. To display the research results, a website has been developed that shows the statistics of public opinion among Ukrainians and updates the data daily.
A detailed comparison of various methods of clustering tweets, consisting in a combination of NLP-methods of text pre-processing, vectorization and clustering, was carried out. 27 different clusterings were performed and their results were analyzed. The experiment showed that stemming mainly reduces the time of processing Ukrainian-language tweets and improves the quality of clustering. Lemmatization also speeds up the process, but often leads to worse results. The Bag of Words text vectorization algorithm loses to other algorithms such as TF-IDF and BERT. TF-IDF is the optimal choice in terms of speed. Although BERT leads to improved results, such vectorization takes much more time. HDBSCAN clustering produces the most evenly distributed clusters, but it also takes a long time. K-Means is the fastest clustering algorithm among those considered. Although agglomerate clustering can produce somewhat better clusters, the results of its work turned out to be rather unstable.
The TF-IDF text vectorization algorithm has an advantage over Bag of Words in terms of taking into account the frequency of words not only in individual tweets, but also in the entire sample as a whole. The instability of the number of clusters in agglomerate clustering can be caused by the sensitivity of the algorithm to input data and parameters. HDBSCAN builds good clusters with a density-based approach, however, due to the diversity of tweets, the density is often small, leaving a lot of noise in the end.
Among the tools for finding text similarity, fuzz sort, fuzz set, and Levenshtein are best suited for comparing cluster fingerprints. The Levenshtein method showed the best result in terms of speed of verification. The other two performed three times worse than Sift4, but they are almost 13 times faster than Sift4. The fastest method is Jaro Winkler, but it has a 19.51% similarity difference. The fuzz set method has the best similarity difference (60.29%). Second place was taken by Fuzz sort (32.28%) and Levenshtein (28.43%). These methods use the Levenshtein distance in their work. This shows that this approach works well for comparing sets of keywords. Other algorithms cannot show much difference between different fingerprints, which indicates that they are not adapted to this kind of problem. In some algorithms, the average similarity of fingerprints reaches more than 70%. As an example, a graph of the popularity of several clusters for 7 days is obtained. Such a process can be carried out daily and constantly receive relevant data.
The investigation of the results obtained from the developed pipeline has revealed certain factors that can be utilized to enhance the system's efficiency. The peculiarities of stemming and lemmatization for the Ukrainian language have been explored, highlighting the varying effectiveness of stemming tools based on the Overstemming Index (OI) and Understemming Index (UI) assessments. The reduction of the input vocabulary through stemming was determined to be approximately 40%, while lemmatization resulted in a reduction of around 33%. Different combinations of text vectorization and clustering methods have been identified for various objectives. BERT and HDBSCAN were found to provide accurate results, while TF-IDF and K-Means offered faster performance and efficiency. Text comparison methods that align with the system's objectives have been identified, including fuzz sort, fuzz set, and Levenshtein distance, with a distinction threshold of over 20% between similar and dissimilar texts.
References Intelligent Analysis of Ukrainian-language Tweets for Public Opinion Research based on NLP Methods and Machine Learning Technology
- Migration movement of the population in January 2014 [Electronic resource] // UKRSTAT.ORG: publication of documents of the State Statistics Service of Ukraine: web site - Access mode: http://ukrstat.gov.ua/operativ/operativ2014/ds/mr/mr_u/mr0114_u.html.
- Blahun I.S. Modeling of sustainable development of the region / I.S. Blahun, L.I. Sysak, O.O. Soltysik - Ivano-Frankivsk: Vasyl Stefanyk Precarpathian National University, 2006. 166 p.
- Ismail, M. A.; Auda, H. A.; Elzafrany, Y. A. On Time Series Analysis for Repeated Surveys. Journal of Statistical Theory and Applications 2018, 17, 587–596. https://doi.org/10.2991/jsta.2018.17.4.1
- Mellon, J.; Prosser, C. Twitter and Facebook are not representative of the general population: Political attitudes and demographics of British social media users. Research & Politics 2017, 4(3). https://doi.org/10.1177/2053168017720008
- Han, X; Wang, J; Zhang, M; Wang, X. Using Social Media to Mine and Analyze Public Opinion Related to COVID-19 in China. International Journal of Environmental Research and Public Health 2020, 17(8), 2788. https://doi.org/10.3390/ijerph17082788
- Tavoschi, L.; Quattrone, F.; D’Andrea, E.; Ducange, P.; Vabanesi, M.; Marcelloni, F.; Lopalco, P. L. Twitter as a sentinel tool to monitor public opinion on vaccination: an opinion mining analysis from September 2016 to August 2017 in Italy. Human Vaccines & Immunotherapeutics 2020, 16(5), 1062–1069. https://doi.org/10.1080/21645515.2020.1714311
- Ainin, S.; Feizollah, A.; Anuar, N. B.; Abdullah, N. A. Sentiment analyses of multilingual tweets on halal tourism. Tourism Management Perspectives 2020, 34, 100658. https://doi.org/10.1016/j.tmp.2020.100658
- Boon-Itt, S.; Skunkan, Y. Public Perception of the COVID-19 Pandemic on Twitter: Sentiment Analysis and Topic Modeling Study. JMIR Public Health Surveill 2020, 6(4), e21978. https://doi.org/10.2196/21978
- Lwin, M. O.; Lu, J.; Sheldenkar, A.; Schulz, P. J.; Shin, W.; Gupta, R.; Yang, Y. Global Sentiments Surrounding the COVID-19 Pandemic on Twitter: Analysis of Twitter Trends. JMIR Public Health Surveill 2020, 6(2), e19447. https://doi.org/10.2196/19447
- Mustakim; Indah, R. N. G.; Novita, R.; Kharisma, O. B.; Vebrianto, R.; Sanjaya, S.; Hasbullah; Andriani, T.; Sari, W.P.; Novita, Y. DBSCAN algorithm: twitter text clustering of trend topic pilkada pekanbaru. Journal of Physics: Conference Series 2019, 1363(1), 012001. https://doi.org/10.1088/1742-6596/1363/1/012001
- Twitter API https://developer.twitter.com/en/docs/twitter-api
- Moh, T.-S.; Bhagvat, S. Clustering of Technology Tweets and the Impact of Stop Words on Clusters. In Proceedings of the 50th Annual Southeast Regional Conference, Tuscaloosa, Alabama, USA, 29-31 March 2012, pp. 226–231. https://doi.org/10.1145/2184512.2184566
- SpaCy https://github.com/explosion/spaCy
- Ukrainian-Stopwords https://github.com/skupriienko/Ukrainian-Stopwords
- Devlin, J.; Chang, M.-W.; Lee, K.; Toutanova, K. BERT: Pre-training of Deep Bidirectional Transformers for Language Understanding. arXiv 2019 https://doi.org/10.48550/arXiv.1810.04805
- bert-base-multilingual-uncased https://huggingface.co/bert-base-multilingual-uncased
- Sasirekha, K.; Baby, P. Agglomerative hierarchical clustering algorithm-a. International Journal of Scientific and Research Publications 2013, 3(3), 83-85. https://citeseerx.ist.psu.edu/document?repid=rep1&type=pdf&doi=0c1d9d3279cf15dde398c77a371f2684055f35d2#page=84
- McInnes, L.; Healy, J. Accelerated Hierarchical Density Based Clustering. In Proceedings of 2017 IEEE International Conference on Data Mining Workshops (ICDMW), New Orleans, LA, USA, 19-21 November 2017, pp. 33–42. https://doi.org/10.1109/ICDMW.2017.12
- Campos, R.; Mangaravite, V.; Pasquali, A.; Jorge, A.; Nunes, C.; Jatowt, A. YAKE! Keyword extraction from single documents using multiple local features. Information Sciences 2020, 509, 257–289. https://doi.org/10.1016/j.ins.2019.09.013
- Paice, C. D. An Evaluation Method for Stemming Algorithms. In Proceedings of the 17th Annual International ACM SIGIR Conference on Research and Development in Information Retrieval, Dublin, Ireland, 3-6 July 1994, pp. 42–50. https://web.archive.org/web/20060705163430id_/http://widit.slis.indiana.edu/irpub/SIGIR/1994/pdf5.pdf
- Stemmers for Ukrainian https://github.com/amakukha/stemmers_ukrainian
- Barbaresi, Adrien. Simplemma (v0.9.1). Zenodo 2023. https://doi.org/10.5281/zenodo.7555188
- Barbaresi, A.; Hein, K. Data-Driven Identification of German Phrasal Compounds. In: Ekštein, K., Matoušek, V. (eds) Text, Speech, and Dialogue. TSD 2017. Lecture Notes in Computer Science 2017, vol 10415. Springer, Cham. https://doi.org/10.1007/978-3-319-64206-2_22
- Barbaresi, A. An Unsupervised Morphological Criterion for Discriminating Similar Languages. In Proceedings of the Third Workshop on NLP for Similar Languages, Varieties and Dialects (VArDIal3), Osaka, Japan, 12 December 2016, pp. 212–220. https://aclanthology.org/W16-4827
- Barbaresi, A. (2016, September). Bootstrapped OCR error detection for a less-resourced language variant. In Proceedings of 13th Conference on Natural Language Processing (KONVENS 2016), Bochum, Germany, September 2016, pp. 21–26. https://hal.science/hal-01371689
- Moulavi, D.; Jaskowiak, P. A.; Campello, R. J. G. B.; Zimek, A.; Sander, J. Density-Based Clustering Validation. In Proceedings of the 14th SIAM International Conference on Data Mining (SDM), Philadelphia, PA, USA, 24-26 April 2014, pp. 839–847. https://doi.org/10.1137/1.9781611973440.96
- Zhengbing Hu, Igor A. Tereykovskiy, Lyudmila O. Tereykovska, Volodymyr V. Pogorelov, "Determination of Structural Parameters of Multilayer Perceptron Designed to Estimate Parameters of Technical Systems", International Journal of Intelligent Systems and Applications, Vol.9, No.10, pp.57-62, 2017.
- Mainych, S. Bulhakova, A., Vysotska, V. Cluster Analysis of Discussions Change Dynamics on Twitter about War in Ukraine, CEUR Workshop Proceedings (2023, Vol-3396, pp. 490-530.
- Zhengbing Hu, Yevgeniy V. Bodyanskiy, Nonna Ye. Kulishova, Oleksii K. Tyshchenko, "A Multidimensional Extended Neo-Fuzzy Neuron for Facial Expression Recognition", International Journal of Intelligent Systems and Applications, Vol.9, No.9, pp.29-36, 2017.
