Inter integrated WSN for crude oil pipeline monitoring

Author: Bhavyarani M. P., U. B. Mahadeva Swamy, M. B. Shrynik Jain
Journal: International Journal of Computer Network and Information Security @ijcnis
Article in issue: 3 vol.10, 2018.
Free access
An inter-integrated system for crude oil pipeline using Wireless Sensor Network is designed for an incessant monitoring and communication in the desert for a span of 1350 Km from pumping station to harbor stockpiling tanks with 135 distributed control system stations. The proposed wireless sensor network equipment is used to scan the sensor status installed in the pipeline and send the required information utilizing dedicated low bandwidth with Quality of Service level three secured Message Queuing Telemetry Transport. This system generates energy on its own by using the solar panel and stores it in battery banks. Low power controller with Wi-Fi developed by Texas Instruments has been utilized to design a working prototype.
Wireless Sensor Network (WSN), Wi-Fi CC3100, Message Queuing Telemetry Transport (MQTT), Quality of Service (QoS), Monitoring and Communication Unit (MCU)
Short address: https://sciup.org/15015585
IDR: 15015585 | DOI: 10.5815/ijcnis.2018.03.05
Text of the scientific article Inter integrated WSN for crude oil pipeline monitoring
Published Online March 2018 in MECS DOI: 10.5815/ijcnis.2018.03.05
In recent innovations on Wireless Sensor Network (WSN) for automation purposes, which covers wide zone like water, fuel, gas etc., is playing its own role. A minor variation or human error can lead to major uncontrollable damages or even loss of ecological life.
The complex network will lead to clogging in network traffic and also consumes huge bandwidth to transfer the data which leads to more equipment, power consumption, and multiple repeaters. This network uses a dedicated server, which on lack of performance leads to loss of data or delay in communication due to numerous hubs imparting at once [1].
Monitoring and processing data in real time with each node is considered as critical part due to highly combustible material passing through the pipeline, any fiasco can occur at any time which the dedicated personnel is not aware what is happening, which leads the disaster to go out of control causing huge damages and it will take number of days to repair it and bring the system to normal. The early revelation of a discharge or intrusion together with the correct Identification (ID) of the range licenses time for either safe shutdown or speedy dispatch of assessment and cleanup groups. From now on, the steady proactive watching system for the crude oil pipeline is essential. In any case, a course of action, watching, and support of them should remain fiscally sharp, flexible, and easily versatile.
The basic block consists of a control unit, sensory, communication, power generation and conversion for flexible and incessant operation. An expected outcome of this design will use dedicated node for each station with a secured Internet Protocol (IP) and Quality of Service (QoS) level three secured MQTT with fixed sensors and dedicated low power controller with an energy harvester will be interfaced and specific firmware using Real-Time Operating System (RTOS) will be developed to carry out the tasks.
-
II. Related Work
Communication is a critical segment in automation. Whenever the process gets started, the consistent pressure will be created on the hub. Due to this there will be lagging of information that needs to be exchanged between the nodes. Another critical segment is providing a constant power to the system for continuous operation. Therefore an exhaustive literature survey has been done to review various communication technologies and protocols for fool-proof communication and monitoring with adequate energy supply by harvesting renewable energy.
-
A. Communication Technology
This survey gives a detailed study of various technologies used for communication.
ZigBee
In this paper [2], CC2420 ZigBee is used with protocol stack to check oil pipeline negative pressure roughly of 1000 m/s–1200 m/s. When a spill occurs, this system detects negative pressure wave signal. Topology in this application has a full-function device with a ring. Each node will coordinate with another concurrent node which is called as a sink node. The sink node will play very important role as it is responsible for real-time data display and coordinating other control signals [3]. If sink node fails there will be a chance so that the data will be lost everlastingly with no probability of recuperation, which makes this technology a limited version due to the lagging of information during the failure in communication and makes hard to detect any variations.
Firmware design of this work is divided into embedded system and z-stack [4, 5]. This protocol allows only one master and multiple slaves by using physical addressing technique and private area network ID which causes all the slaves to remain as slaves which is the significant restriction by this protocol.
Bluetooth Framework
Bluetooth is intended for wireless protected access networks [6]. Standard device is capable of operating at a greater distance ~10 meters. It normally utilizes shortrange radio links at 2.4 GHz using industrial scientific and medical (ISM) band for wireless local area network. Commonly used communication technique is by using spread spectrum hopping frequency on Bluetooth which occupies 1 MHz center frequency and hops over 79 center frequencies which means it actually occupies 79 MHz and only suitable for small peer-to-peer network operating in either master or slave mode as it is hardwired [7]. The significant constraint of this system is that it consumes more power for a shorter distance which is inappropriate for WSN and it uses Bluetooth stack or Bluetooth radio. It is more suitable for higher end sensor application, voice application, small size etc., and it is not suitable for low data rate multi-topology or low power application.
Acoustic Monitoring System
This system detects or monitors pipeline by detecting the impact or any intrusions occurred possibly. It is being used since 1990 and has its own advantage as the auxiliary sensor will be deployed every 10 miles. This system is passive in nature, so more sophisticated filter is needed for the perfect process of the information. This will lead to reduced sensitivity and it is the drawback of the system [8].
Fiber Optics
Optical Time Domain Reflectometer (OTDR) detects variation in transmitted light and it is also called as OFC. This system overcomes the limitation of previous technique as it can detect generated vibration pressures or harmful encroachment in real time. As the name indicates, it can be laid for long range but requires continuous repeaters and sophisticated instrument to process the signal. One major drawback is if optical fiber cable is cut in between, then it must be repaired, or else no signal transmission or reception will occur. Also due to severe heat, there will be a lag in transmission [9].
Satellite Monitoring
This involves commercial satellites to get images of the pipeline. As this technology is much advanced it needs separate parabolic dish antenna to uplink and downlink with transponders working on microwave signal or it can use radio detection and ranging satellite images via Synthetic Aperture Radar (SAR) to recognize any calamity or harmful object near the pipeline. The main advantage of this technique is that it can cover a vast area in a speedy way with increased efficiency. Limitation of this technique is that it cannot be done in real time. If dark clouds are floating in that area, it will be difficult to map or obtain any pictures related to the pipeline. Data uplink and downlink technique used for real-time monitoring causes a delay in processing, consumes more power and requires a large area to install the equipment [10].
Following are the drawbacks of the existing technologies used for communication which the authors have learned through a literature survey.
-
• ZigBee – Loss of communication due to node failure and also not so secured than a typical 802.11 wireless network.
-
• Bluetooth – Not suitable for long distance, low data rate, and low power applications.
-
• Acoustic Monitoring System – Not suitable for the process which demands high sensitivity.
-
• Fiber Optics – Trip of communication due to physical tamper and requires continuous repeaters.
-
• Satellite Monitoring – not suitable for real-time and low power applications.
Therefore, a low power Wi-Fi CC3100 which is based on 802.11 b/g/n radio with Media Access Control (MAC) is used in the proposed work. It also features 256-bit
Advanced Encryption Standard (AES) with the powerful crypto engine for secured connection based on Transport Layer Security (TLS) and Secure Sockets Layer (SSL) certified links.
-
B. Protocols
This survey gives the brief study of various protocols and stack used for communication [11-13].
Coverage Configuration Protocol (CCP)
This is intended to aim multiple degrees or wide degrees in coverage and maintain communication connectivity for required time [14]. If the desired range is less than sensing range, integrating switch port analyzer (SPAN) with CCP is recommended to provide required coverage for continuous communication of sensed information. The benefit of this system is that it can configure specific degree of network coverage requested by an application.
Optimal Geographical Density Control (OGDC)
This system is distributed fully with an algorithm to do a local search to send data. If communication range is less than its coverage range then data must be transmitted in a convex area to do complete coverage among the connected working nodes which are set to optimality condition under an active subgroup of sensor nodes so that it can access large coverage area and a dedicated algorithm can guarantee these conditions [15]. When high traffic is running on the network by knowing its own position by the nodes in the network, OGDC nodes require location information precisely with synchronized time. The major limitation of this protocol is active nodes never go back to sleep which leads to difficulty in balancing the energy consumed by the nodes.
Probing Environment and Adaptive Sleeping (PEAS)
This system consists of two algorithms:
-
(1) In this method, an active sensor must take the decision of its own to change its function mode from sleep to wake up and vice-versa.
-
(2) This logic decides a dynamic sleeping time adjustment which ensures an average time for sleeping and periodically waking up the nodes when needed [16].
In this technique, nodes will become active when it needs to broadcast or to process a message over a certain range to replace the failed active nodes. Limitation of this system is during Save our Ship (SoS) if a node is in sleep mode then sensor needs to wait until that node wakes up to transmit the data, and it cannot assure complete coverage because probing range coverage will overlap on different levels to achieve coverage.
Adaptive Self-Configuring Sensor Network Topologies (ASCENT)
-
(1) Actualization of local information can be acquainted by the nodes.
-
(2) No need of intermittent message overhead to detect neighbors.
-
(3) Active nodes will try to maintain a good
communication with the neighbor node to keep track of the information.
-
(4) Less efficient in energy consumption due to never sleeping nodes.
Following are the limitations of the above described protocols and stack used for communication which the authors have learned through a literature survey.
-
• Complete coverage is not assured.
-
• Difficulty in balancing the energy consumed by the nodes.
Here the aim is to have a protocol which must consume minimal energy and must use bandwidth in an efficient way. Hence MQTT protocol is chosen for this design because of its low overhead, two-byte header for slower network bandwidth application. It maintains constant connection using low bandwidth with QoS level three.
-
C. Energy Harvesting
This survey briefs about various techniques used to harvest renewable energy efficiently.
Wind
Distributed sensing in WSN needs more energy for continuous operation. However, this is a critical deployment in battery powered WSN system [18]. One way of generating energy with a potential solution to extend the lifetime of a system is by using wind as an energy source contingent on weather forecast which improvises the prediction on wind condition in near future [19]. The issue concerned with the wind is its behaviour which is unpredictable and irregular. This will lead to the slower charging of battery banks and this system needs more backup battery bank in case of charging failure. For continuous operation, sufficient power is needed for WSNs because of critical issues on sensor status as it cannot be compromised for QoS.
Fuel Cell
A fuel cell is an emerging novel technology for zero emission bio-energy that needs hydrogen, oxygen, clean water and another source to generate the power for electrolysis operation which is an impediment [20]. To overcome this, micro-bio fuel cell (MFC) can be used to harvest energy which consists of bioreactor that transforms stored energy in bonds of chemicals of compounded organic into usable electrical energy [21-26]. It is called as a clean renewable source. This process is done by placing catalytic reactions of micro-organism under the condition of anaerobic and it is named as two chamber cathode and anode equipped each one with electrode composes an MFC reactor.
-
III. Motivation
With the knowledge gained from a literature survey and having understood the drawbacks of the existing systems, the authors thought of developing a node based system with the following features.
-
• Detection of leakage and identification of any threat in real-time.
-
• It must generate energy on its own and should exchange information through a secure remote system with low bandwidth, without human interference.
-
• Fiscally sharp, flexible, and easily versatile.
-
IV. Problem Statement
Existing structure running on OFC and wired link to exchange data amongst stations and field engineers have its own specific limitation, for instance, steady upkeep, transportation, and dedicated personnel which costs more to oil organization. An incessant crude oil pipeline monitoring and communication in the desert for a span of 1350 Km from pumping station to harbor stockpiling tanks with 135 Distributed Control System (DCS) station requires more qualified engineers for manual operation, constant power supply, and continuous communication to update the sensor data. Node based data exchanging for remote operation on WSN using solar power is proposed as a solution to this problem.
-
V. Objectives
The proposed work is based on the prototyping of nodes to monitor and relay Save our Ship (SoS) messages and a general log of sensors. Here the main objective is to build up a hub which must generate the energy on its own and should exchange the required information utilizing dedicated low bandwidth with QoS secure protocol. The following are the goals of the proposed work.
-
• To design prototype of Monitoring and Communication Unit (MCU) with dedicated
apparatus to monitor sensor status installed in the pipeline.
-
• To provide the gateway on MQTT using QoS for a secured link communication using reserved IP.
-
• To create an android app to access the log as well as to get the messages regarding the status of sensors.
-
• To design a Dc-Dc converter for the efficient use of harvested energy.
-
VI. System Methodology
The complete block diagram of the proposed system is shown in Fig. 1, which has four sensors interfaced to the processor. Various operations are handled by Mixed Signal Processor (MSP430F5529). Texas Instruments real-time operating system with task including communication is loaded into System-On-Chip (SOC) for continuous monitoring of various sensors and also for proper scheduling of tasks. Wi-Fi module is interfaced with MSP using serial peripheral interface (SPI) which connects to Amazon Web Server (AWS) using reserved IP and a gateway port for the purpose of publishing messages to respective topics. Subscription to the corresponding topic published by the user using Wi-Fi must be done to receive the message. Access between AWS client and host is done using light-weight MQTT protocol.
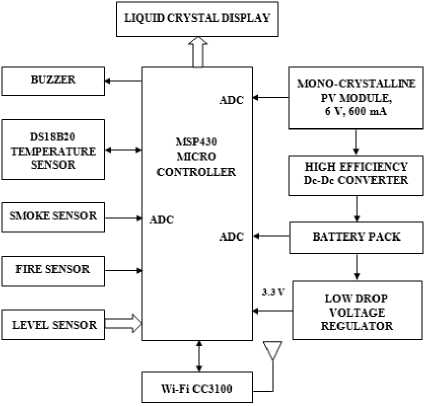
Fig.1. System Block Diagram of Monitoring and Communication Unit (MCU)
Mono-crystalline photovoltaic (PV) rated at 6 V, 600 mA is used to generate power by converting light into electricity. The Output of the panel varies depending on light intensity. Low intensity causes lag in charging of the battery. To overcome this issue Dc-Dc converter is used which boosts the voltage obtained from panel to a suitable level for charging. The sealed lead-acid battery is used to provide persistent power to the node for its operation.
This system works at low power 3.3 V at 300 mA, but the output of the battery bank is about 5 V. To reduce this voltage to 3.3 V LM1117 low dropout voltage regulator is used.
Liquid crystal display provides visible information of temperature in degree centigrade, fluid levels, fire, and smoke sensor status.
To alert nearby engineers in case of any SoS, audible information is generated by piezoelectric buzzer operating at 3 kHz.
Block diagram of node connection to the network with client interface is shown in Fig. 2. This block is divided into two segments. Segment one is a node, segment two is cloud with MQTT broker and user end application. The node will access to MQTT broker by connecting to master which must have internet access. Node connects to this modem by using join network command with a Service Set Identifier (SSID) and a password which is a 128-bit encryption. As soon as a node is connected to master, broker automatically connects to AWS and then starts publishing or subscribing the messages with the topic. MQTT is connected to both node and user. The user can access the information by running the mobile app which is developed using the android studio. When the app is executed with data link ON, the port will be automatically forwarded to AWS server where processed information from node and client will be stored.
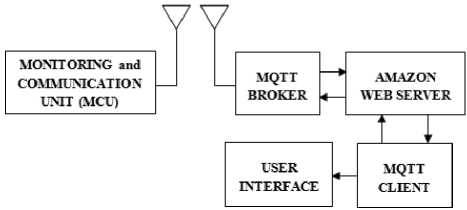
Fig.2. Communication Block
A. LM2577 Dc-Dc Converter
Fig. 4 shows the circuit with required components to boost incoming voltage from 5–6.6 V from the solar panel to 7 V to charge the battery. The switching frequency is 52 kHz.

Fig.4. Circuit of Dc-Dc Converter
Design:
V IN(min) = 5V, V OUT = 7V, Maximum output load current I L(max) = 1A, V F = 0.5V, C IN = 100µF
-
(1) Selection of inductor
The maximum duty cycle of switch is
_ ^out+^f-^™^;») (max) ~ 7ОВТ+Р>-0.6Г
^(max) —
Tt7 + 0.51'— 51r
TV+asb'-MV
= 0.362.
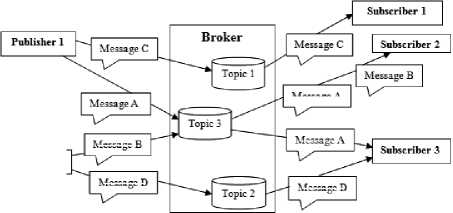
Broker structure shown in Fig. 3 describes the MQTT message handling which incorporates publisher, subscriber and a broker. The key components of the broker are light-weight message queuing and transport protocol, which is used to publish the series of messages to the cloud. The events or messages are of the asynchronous communication model. This protocol is chosen for this design because of its low overhead, two-byte header for slower network bandwidth application. Publishing and subscribing topic for the corresponding messages via link broker through AWS can be handled in an easy way.
The product of volts x time that charges the inductor is
E *T =
O(mgx) (Уду (min)- P-^) 106
52 kHz
0.362 (5V - 0.6V)106 52kHz
= ЗО.бЗГц^.
Average current of the inductor under full load is
^INDDC
Message A
Message в
Message D
Message D
| Publishers
Fig.3. MQTT Message Handling Structure
1.05 X?LCmm)
1— -D (max)
Message A
1.05 x 1Л 11NDDC = "7 л = 1645Л.
1 — u.JoZ
Therefore, L = 68µH which is obtained from the inductor selection graph of LM2577-ADJ based on the values of E*T and I IND,DC .
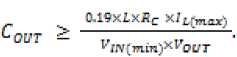
(2) Selection of Rc, Cc (compensation network) and Cout (output capacitor)
, 750 х 1 £,pnax) x ^dut ^HY (min )
750 x 1Л x 72
5 5=
Rc <1А1кП.
Nodes will send and receive data as a message and (4) respond only when needed makes lower power consumption and allows other nodes to use the channel when it is free. The main advantage of using this technique is a distinctive topic for subscribed and published messages which will be done by the allotted nodes helps in avoiding the collision caused due to over traffic.
The following steps describe the work flow of the (5) proposed design.
0.19 x 68цЯ x 1.47kQ x 1Л
C°UT " 1777?
C0UT — 542.64^.
„ Б8.5хТ,гоитхСоит
L j > : ; .
”cx' /«(nun)
_ 58.5 x 72 x 542.64цК
C - (1.47kG)2 x 5V "
Cc > 0.14nF .
-
(3) Selection of output voltage (R1 and R2)
Д1 _ Vqut R2 1.23V ~ "
Я1 7V — =-----1 = 4.69.
R2 1.23V
If R2 = 1.5kΩ, then
Я1 = 4.69 x R2 = 4.69 x 1.5И1 = 7.03И1.
-
VII. Algorithm
A succession of occasions in a solitary system is known as a link which includes local Wi-Fi, sensor node, master node, internet connection, and users. At first, the sensor node is connected to master node to ensure linked communication is successful which is done by using MQTT protocol. After this, sensor node will start acquisition process. The acquired data will be sent to master node, where it is forwarded to cloud, so that it can be accessed by authorized persons.
Every time data is published to cloud by node and subscription to the corresponding command by the node will be allowed to pass only through QoS. A dedicated port with an IP is been used with node acknowledgement which allows continuous hassle-free communication using 1 kb bandwidth.
Step 1: Initialize the mobile app for user communication. Step 2: Configure SPI and Analog to Digital Converter (ADC), enable interrupts, and authenticate host network.
Step 3: Start MQTT process with a reserved IP and dedicated port for communication.
Step 4: Convert analog data of solar panel and battery into digital format with the help of ADC for the monitoring purpose.
Step 5: Send a message to the user if there is any variation in the threshold voltage.
Step 6: Publish SoS message to the user if the flow level is low or if a fire is detected in DCS station.
Step 7: Send an informative message to the user for normal flow.
Step 8: Publish SoS message to the user if the temperature exceeds the set threshold in the system.
Step 9: Send SoS message to the user if smoke is detected and ppm exceeds the set threshold in the system.
-
VIII. Flow Chart
The proposed work is implemented by a group of seven tasks namely initialization, solar and battery voltage monitoring, fire and level sensor, temperature sensor, smoke sensor, MQTT broker, and sleep and wakeup. A real-time operating system with task including communication is loaded into SOC for continuous monitoring of various sensors and also for proper scheduling of tasks. The flowchart provides a graphical representation of WSN functional flow of firmware which is divided into two segments. First one is node segment, where all the sensors with Wi-Fi are interfaced, running on seven different tasks. The second segment is Graphical User Interface (GUI) running on android, used to provide visible information about the sensor status and SoS messages. The details of the function performed by each of these tasks are explained in the following sections with relevant flowcharts.
Task 1: Initialization
The flowchart of initialization task is shown in Fig. 5. This task is executed only once when the system is turned ON to configure SPI and ADC, enable interrupts, scanning SSID and validating the password of the host network. After completing this, MQTT process will be started using reserved IP with a dedicated port to do the communication.
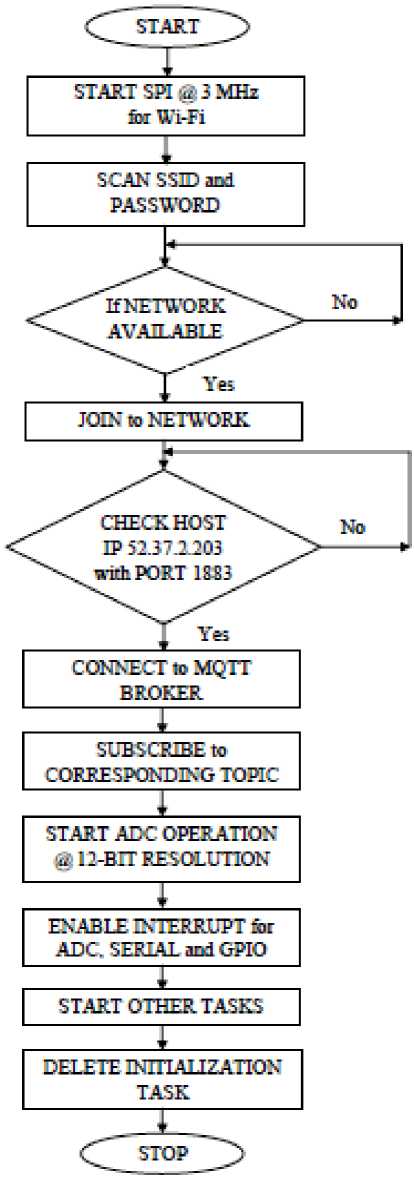
Fig.5. Initialization Task
Task 2: Solar and Battery Voltage Monitoring
Fig. 6 shows the flowchart of solar and battery voltage monitoring process. It uses ADC channels 0 and 1 to read solar and battery voltage levels and converts it into digital. After this process, if there is any variation in the threshold voltage a message will be published to the user.
If adequate sunlight is not available then sleep and wakeup strategy will be enabled. Both the operations of ADC are handled by interrupts.
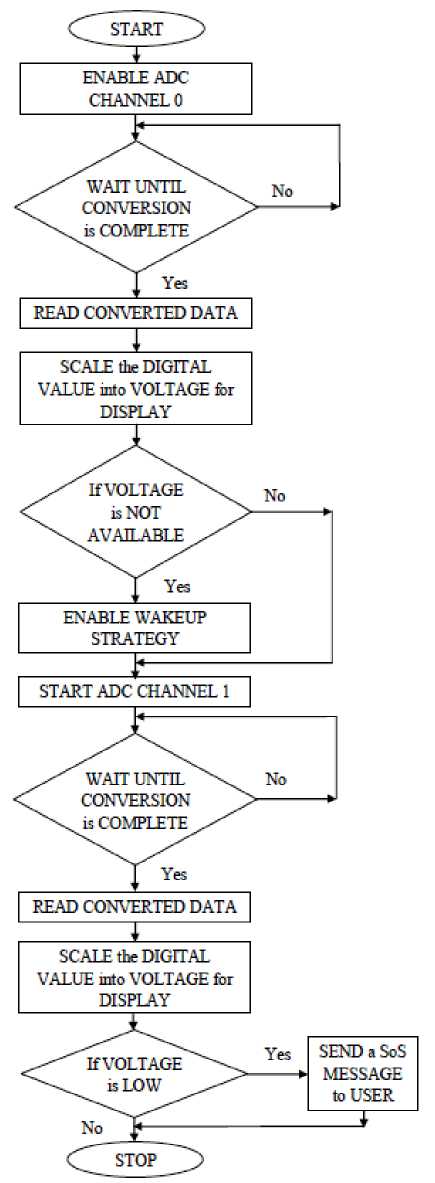
Fig.6. Solar and Battery Voltage Monitoring
Task 3: Fire and Level Sensor
This is a high priority task which cannot be neglected as it performs fire and level sensing. The flowchart for this task is shown in Fig. 7. Three digital I/O pins are configured as input for level and one rising edge interrupt is used for fire detection. Four levels of fluid namely too-low, low, medium and full are identified to indicate the level status. SoS and normal messages will be published to the user depending on the sensor status.
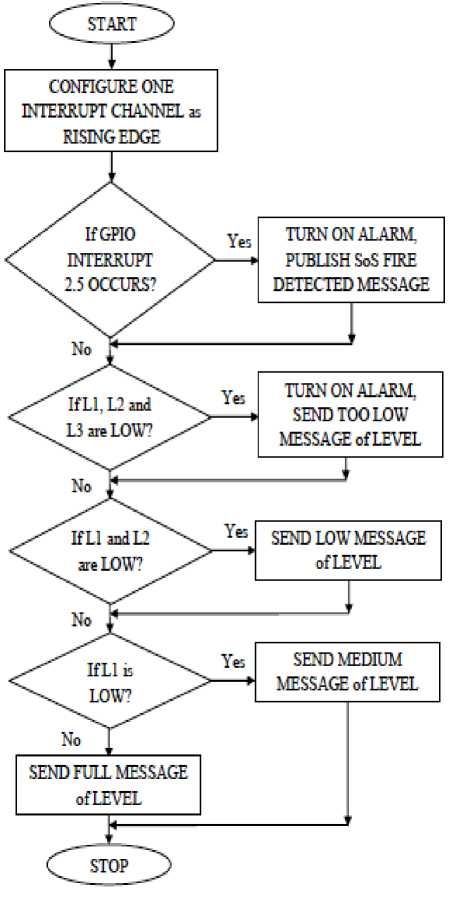
Fig.7. Fire and Level Sensor
Task 4: Temperature Sensor
The flowchart for this task is shown in Fig. 8. It holds second priority as a temperature sensor is connected. 1-Wire protocol with reserved command set is used to access the temperature reading. A Single connection is configured as bi-directional access where the controller can send required commands, and depending on the command received it will respond by using the same line. If the temperature exceeds the set threshold in the system, SoS message will be published to the user.
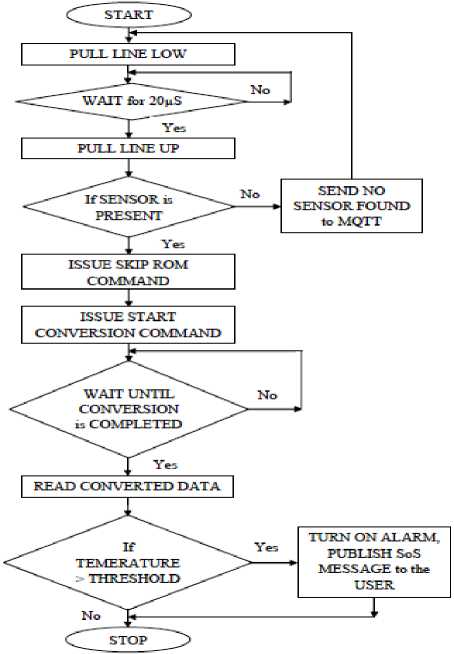
Fig.8. Temperature Sensor
Task 5: Smoke Sensor
Fig. 9 gives the flowchart of smoke sensor task. GP2Y10 is used to detect visible smoke produced by burning of wires and other circuitries. ADC channel 2 is used for scanning the analog output provided by smoke. When no smoke is detected, the threshold will be minimal. When smoke is detected threshold will vary depending on intense, which causes alarm to rise and the message will be published to the user.
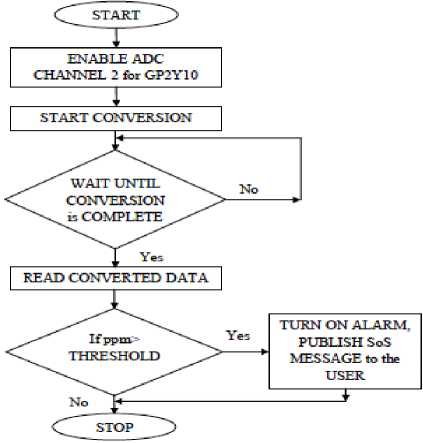
Fig.9. Smoke Sensor
Task 6: MQTT Broker
The flowchart of this task is shown in Fig. 10. This task is enabled by the first task after successful connection to MQTT. Then MQTT stack will be initialized by using reserved IP. This task continuously SPAWN the subscribed thread by listening to AWS and whenever a topic related message is received, microcontroller process the message and reply by publishing a message to the corresponding topic.
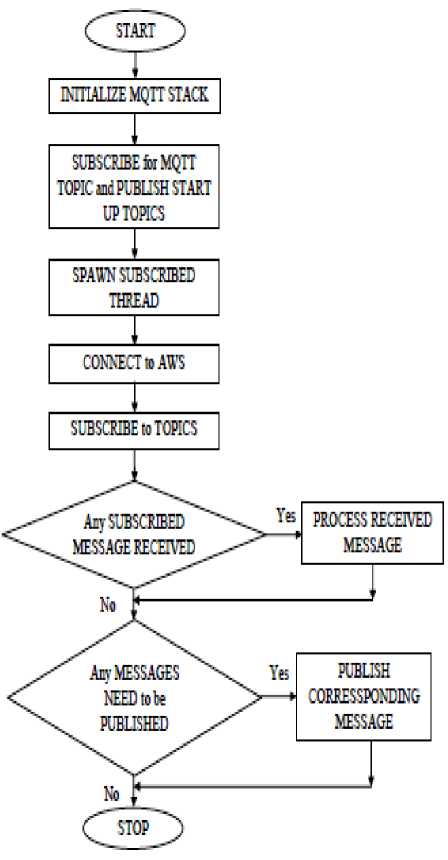
Fig.10. MQTT Broker
Task 7: Sleep and Wakeup
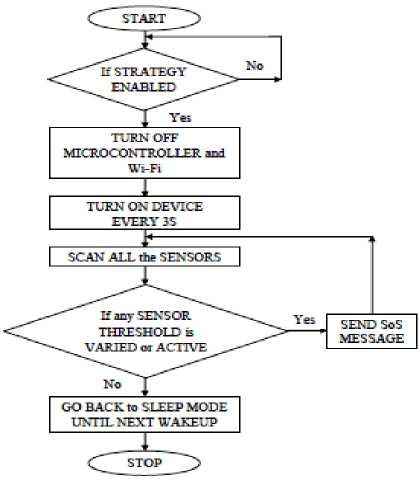
Fig.11. Sleep and Wakeup
User App:
This is a GUI which runs on android Operating System (OS) based on Linux kernel powered by JAVA. Fig. 12 shows the flowchart of user app which is intended to provide specific messages to the subscribed topic like II_FIRE, II_TEMP, II_SMOKE, II_SOLAR, II_BATTERY, II_LEVEL and II_ALERT. This app will be connected to AWS via 1883 gateway with an IP provided for function.
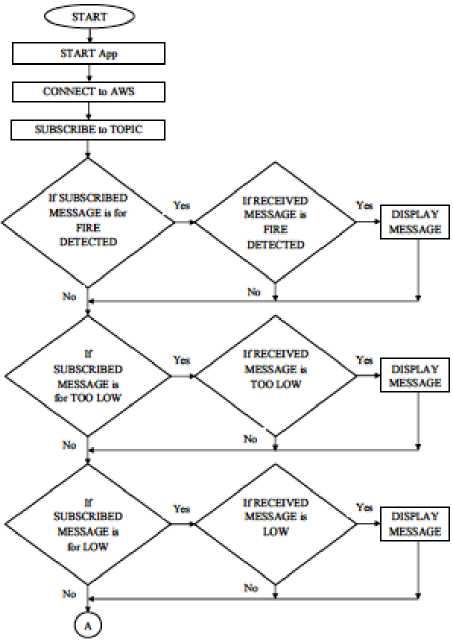
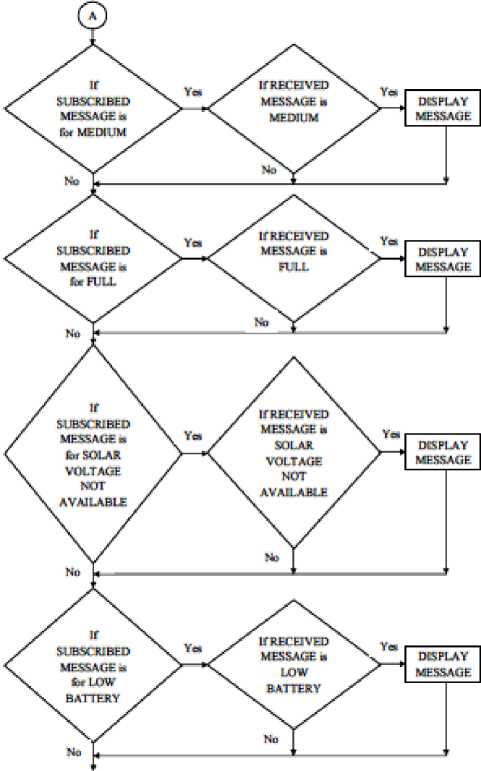
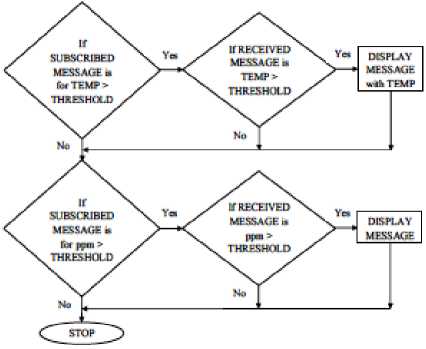
Fig.12. User App
-
IX. Results and Discussion
In this section, the results of various sensors status are presented with the snapshots and graph. If there is any variation in the process, an alarm is generated and SoS message will be published to the user using node device developed for crude oil pipeline monitoring. The output of the PV module and the Dc-Dc converter are also provided with relevant graphs.
Fig. 13 shows the overall system with peripherals interfaced to carry out a specific operation. Automation is done to send and receive messages in the format of the topic with an android app developed for engineers to monitor the status of the station. This is done by automatically subscribing and publishing for the corresponding topics. This module is connected with energy harvester using mono-crystalline PV module with a Dc-Dc converter and dedicated power bank. Message queuing and telemetry transporting protocol is used between node and master.
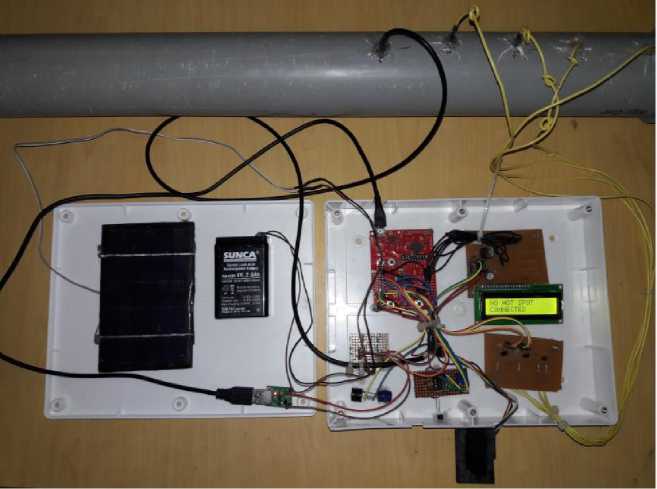
Fig.13. Overall System with Interfaced Peripherals of Inter Integrated WSN for Crude Oil Pipeline System
Fig. 14 shows MQTT application called as engineer app that is installed in the smart phone where the user can view general status and warning SoS messages. This mobile app is developed using android studio which runs on android OS based on Linux kernel powered by JAVA.
к П? .■ 8 12 am
Inter Integrated WSN crude Pipeline
Temperature: - c
Fire :
Level:
Alert:
Battery: - v
Solar: - v
Smoke:
Fig.14. GUI App Display for Personal View in Smart Phone
When an app is executed with data link ON, the port will be automatically forwarded to AWS server where processed information from node and client will be stored. Fig. 15 shows the GUI app display indicating battery and PV module output voltages, alert message and all sensor outputs.
Ш (S Q Л? 4? . В 5 3Op m
Inter Integrated WSN crude Pipeline
Temperature:
28.18 C
Fire :
SENSOR INACTIVE
Level:
LEVEL FULL
Alert:
NO SOLAR POWER
Battery: 03,29 v
Solar: 00.1 5 v
Smoke: SENSOR INACTIVE
Fig.15. Status Display of Corresponding Sensors
Fire sensor comes in various types. An optical detector is one of its types, which uses thermal infrared radiation generated by a blaze. In this prototype, the thermal infrared sensor can cover up to 180o with a radial distance up to 3 Ft. The output of the fire sensor is given to the microcontroller for further processing and communication. Fig. 16 gives SoS message generated when fire hazard is detected by fire sensor.
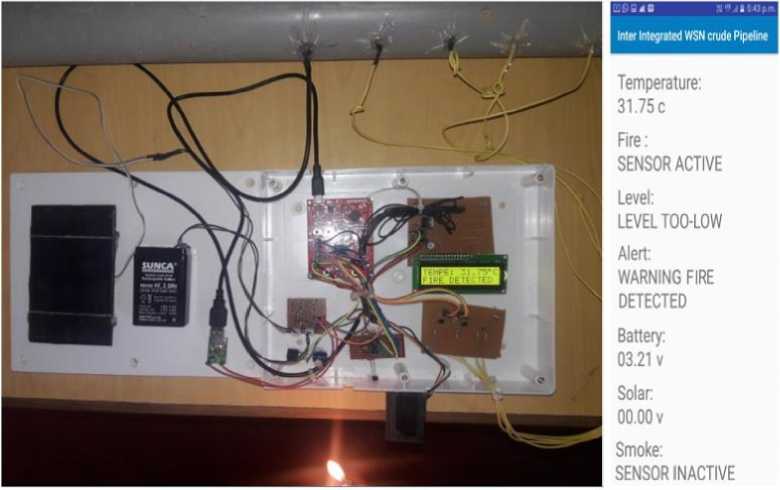
Fig.16. SoS Message Displayed to Alert When Fire Broke Out
GP2Y10 is used to detect visible smoke produced by burning of wires and other circuitries. When no smoke is detected, the threshold will be minimal. When smoke is detected threshold will vary depending on intense, which causes alarm to rise and a message will be published to the user. Fig. 17 shows SoS message generated due to smoke caused by burning of wires or electronic circuitry.
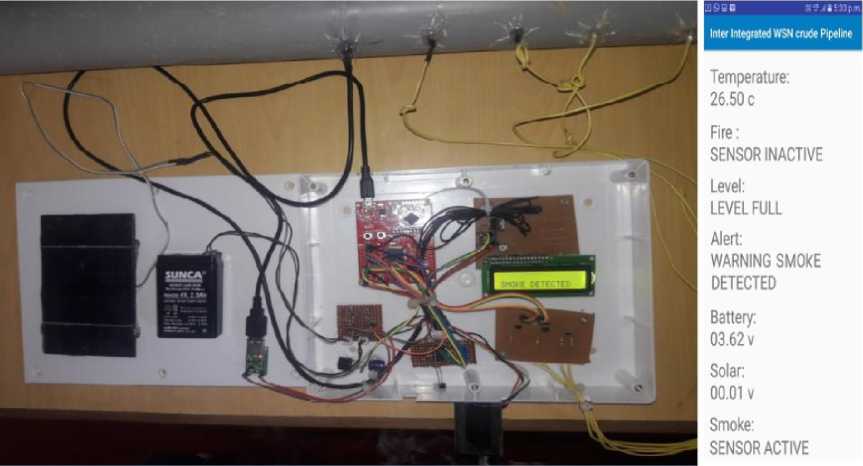
Fig.17. SoS Message Displayed When Smoke Arises
The temperature sensor is inserted in the pipe to monitor the temperature status of the pipeline. Fig. 18 shows the alert message generated due to increase in temperature. There are two cases in which the temperature increases and exceeds the set threshold (40oC in this prototype) in the system. Firstly, when there is a fire in the pipeline. Secondly, when there is a decrease in the flow level and it reaches a too-low level.
Inter trite-grated WSN crude Pipeline
Temperature:
42.31 C
Fire :
SENSOR INACTIVE
Level: LEVEL TOO-LOW
Alert: WARNING INCREASE IN TEMPERATURE
Battery: 03.21 v
Solar:
О 4.1 3 v
Smoke:
SENSOR INACTIVE
Fig.18. SoS Message Generated due to Increase in Temperature
Four conductive type level sensors are inserted in the pipe to indicate the fluid level status namely too-low, low, medium and full. One sensor is fitted at the bottom of the pipe which is called as a reference and other three level sensors are fitted above one by one with a distance of 1.5 cm each. The Decrease in flow causes an increase in internal temperature with respect to hazard levels as shown in Fig. 19.

|
Iurptnut »50c |
TempesAre a«c |
Tempecatxe 2725c |
Tenpeaue arc |
|
Fh; SB60RMCTNE |
f* SENSOR МСЖ |
Re: SENSOR INACTNE |
Alt SENSOR NATftt |
|
If* IfvaRJU |
le* iewlmexn |
Leet taaiM |
Le*: mtiTooia* |
|
Wert wsoumpowe |
ЯК NO S61AR ROWER |
Mert WMNNGlEWllOW |
UK WARNAG LEWI TOO UM |
|
Srw |
Behry |
Batlrf |
Hitterr |
|
ии» |
03.64 г |
03 «1 |
®«v |
|
5мг |
Soir |
Soir |
Soir |
|
oaoo» |
OGOU* |
00® r |
MOlv |
|
Sn* |
$r* |
Snxfe |
Smoke: |
|
sensor меж |
sensor меж |
SENSOR №ПМ |
SENSaiNlCP/E |
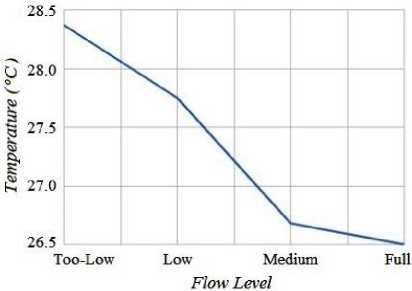
Fig.19. Variation of Temperature with respect to Flow
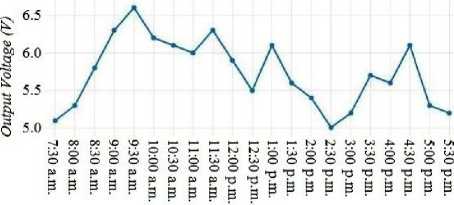
Fig. 20 shows the output voltage from PV module recorded over a span of ten hours on a particular day with readings taken once in half an hour. The peak voltage obtained is 6.6 V and the minimum voltage is 5 V. The input voltage range of 5–6.6 V is adequate for charging of the battery.
Time of the Day
Fig.20. Output Voltage of Solar Panel v/s Time of the Day
Fig. 21 shows output voltage (Vout) v/s input voltage (Vin), Vout v/s output current for Vin = 5 V and efficiency v/s output current graphs for the circuit of Dc-Dc converter. The output voltage of 6.95 V which is greater than the applied input voltage is obtained for both line and load regulation and 83.9 % efficiency is achieved.
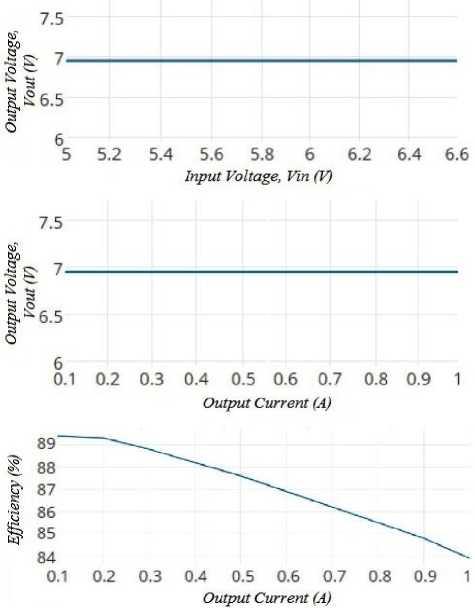
Fig.21. Output Waveforms of Dc-Dc Converter
The proposed design has many advantages and some of them are Optimizing power management, No error due to human interference, Compatibility and remote management, Dual control makes scalability for customized control, Wi-Fi operation gives inter-user control for flexible operation, Easy to install, Centralized monitoring or personal view, and Continuous operation.
-
X. Conclusion and Future Work
Wired stations with OFC need more than three qualified personnel to assess the system and need to be present in the allotted DCS. Due to this oil Corporation is bearing the more financial burden. Multiple remote stations with existing framework does not have proper person to monitor and process. If a dedicated person is allotted, it is difficult to provide transportation in such harsh condition. In case of any emergency, the time taken by the team to reach the spot in this environmental condition will be delayed which will cause huge loss and company need to bear all the expense that are inoccurring repeatedly.
For this reason a node is designed so that any variations in the system is identified and will take necessary action to prevent any destruction. The main thing is WSN need to harvest energy of its own. In case of any failure in harvesting, system will operate by enabling its secured mode. It is called as sleep and wakeup strategy which plays a very important role in providing the power to the system for continuous operation. The second part is system sends information to the field engineers which provides the status of the station. The main purpose of using MQTT protocol is to maintain constant connection using low bandwidth with QoS level three. Because of this, it is a user-friendly monitoring and communication system for oil Corporation.
Table 1 represents the comparison of the proposed design with the OFC and ZigBee based designs by considering the various parameters.
Table 1. Overall Comparison of the Design
|
Consideration |
OFC based Design [6,9] |
ZigBeebased Design [2,6] |
Proposed Design |
|
Fool-Proof Communication |
Trip of communication due to physical tamper |
Loss of communication due to node failure |
Auto change over to second node for continuous communication |
|
Security in Communication |
Not secured due to lack of QoS |
Not so secured than a typical 802.11 wireless network |
QoS based highly secured |
|
Protocol Stack |
Depends on the routers |
Reserved stack for communication |
Stack can be modified and updated for secured communication |
|
Bandwidth |
1 Mbps to 10 Gbps |
250 kbps |
1 kbps |
|
Man Power |
Minimal 2/station for one shift |
1/station when needed |
1/station when needed |
|
Cost to Company |
More |
Medium |
Nominal |
|
Power Supply |
Requires more power depending on repeaters and routers |
Requires long battery life for continuous operation |
Solar energy is used to charge the battery for continuous operation |
All the WSN system developed in the present prototype provides the enhanced features and the limitations are nullified with respect to earlier solutions that were available to transfer data between the master and node. There are multiple enhancements which have scope for improvement, some of the features such as:
-
• Hop based node-to-node communication.
-
• Ask and execute the algorithm.
-
• Alternate energy harvesting in case of solar failure.
-
• Self-diagnosing and information processing in case of any node failure.
-
• On-board log storage in case of communication failure.
Acknowledgments
References Inter integrated WSN for crude oil pipeline monitoring
- Augustine C. Azubogu, Victor E. Idigo, Schola U. Nnebe, Obinna S. Oguejiofor, and Simon E., “Wireless Sensor Networks for Long Distance Pipeline Monitoring”, World Academy of Science, Engineering and Technology, International Journal of Electrical, Computer, Energetic, Electronic and Communication Engineering, Vol:7, No:3, 2013.
- Jianning Ding, Junwen Wang, Ningyi Yuan, Qiaoling Pan, “The Monitoring System of Leakage Accidents in Crude Oil Pipeline based on ZigBee Technology”, Second International Conference on Mechanic Automation and Control Engineering, IEEE Publications, 2011, pp. 1774-1777.
- Apoorva Singh, Itu Snigdh, "Modelling Failure Conditions in Zigbee based Wireless Sensor Networks", International Journal of Wireless and Microwave Technologies(IJWMT), Vol.7, No.2, pp.25-34, 2017.DOI: 10.5815/ijwmt.2017.02.03
- Q.W.Pan, A.Kathnaur, “Power -line networks to extend ranges of 2.4GHz wireless communications inside multi-storey buildings,” in proc. 2010 IEEE Radio and Wireless Symposium (RWS), Jan 2010, pp. 621-624.
- Luo Hui, “A meter reading system based on WSN,” in proc. 2010 International Conference on Optics, Photonics and Energy Engineering, May 2010, pp.312-314.
- Imad Jawhar, Nader Mohamed, Khaled Shuaib, “A framework for pipeline infrastructure monitoring using wireless sensor networks” Wireless Telecommunications Symposium, IEEE Publications, 2007.
- Specifications of the bluetooth system - version 1.2. 2003.
- Gary L. Burkhardt, Alfred E. Crouch, “Real-time Monitoring of Pipelines for thrid party contract”, South West Institute – December 2003.
- K R Anupama, Nishad Kamdar, Santosh Kumar Kamalampet, Dhruv Vyas, Siddharth Sahu, Supan Shah, “A wireless sensor network based pipeline monitoring system”, International Conference on Signal Processing and Integrated Networks (SPIN), IEEE Publications, 2014, pp. 412- 419.
- Ganeriwal S., Kumar R., and Srivastava M. B., “Timing-Sync Protocol for Sensor Networks”, The First ACM Conference on Embedded Networked Sensor System (SenSys), pp. 138–149, November 2003.
- Maheshwari Marne, Utkarsha Pacharaney, Nabeelanaaz Suri, Mohini Ghotekar, “A study on data coverage protocols for energy conservation in wireless sensor network”, International Conference on Inventive Computation Technologies (ICICT), IEEE Publications, 2016.
- Sanjay Pahuja, Tarun Shrimali, "Performance Analysis of Routing Protocols for Target Tracking in Wireless Sensor Networks", International Journal of Modern Education and Computer Science(IJMECS), Vol.8, No.10, pp.40-48, 2016.DOI: 10.5815/ijmecs.2016.10.06
- Yasir Arfat, Riaz Ahmed Shaikh, "A Survey on Secure Routing Protocols in Wireless Sensor Networks", International Journal of Wireless and Microwave Technologies (IJWMT), Vol.6, No.3, pp.9-19, 2016.DOI: 10.5815/ijwmt.2016.03.02.
- X. Wang, G. Xing, Y. Zhang, C. Lu, R. Pless, and C. D. Gill, “Integrated Coverage and Connectivity Configuration in Wireless Sensor Networks”, the First ACM Conference on Embedded Networked Sensor Systems, 2003.
- H. Zhang and J. C. Hou, “Maintaining Sensing Coverage and Connectivity in Large Sensor Networks”, Technical Report UIUC, 2003, UIUCDCS-R- 2003-2351.
- Ye F., Zhong G., Lu S., & Zhang L., “PEAS: A robust energy conserving protocol for long-lived sensor networks”, Proceedings - International Conference on Network Protocols, 2008, ICNP, 200–201.
- A. Cerpa and D. Estrin, “ASCENT: Adaptive Self-Configuring Sensor Networks Topologies”, In Proceedings of IEEE INFOCOM, June 2002, New York.
- Adnant Jushi, Alain Pegatoquet, Trong Nhan Le, “Wind Energy Harvesting for Autonomous Wireless Sensor Networks”, Euromicro Conference on Digital System Design (DSD), IEEE Conference Publications, 2016, pp. 301-308.
- P. Kamalinejad, C. Mahapatra, Z. Sheng, S. Mirabbasi, C. M. L. Victor, and Y. L. Guan, “Wireless energy harvesting for the internet of things”, IEEE Communications Magazine, vol. 53, pp. 102 - 108, 2015.
- Andrea Pietrelli, Vincenzo Ferrara, Andrea Micangeli, Lidieth Uribe, “Efficient Energy Harvesting for Microbial Fuel Cell dedicated to Wireless Sensor Network”, XVIII AISEM Annual Conference, IEEE Conference Publications, 2015.
- K.G. Cooke, M.O. Gay, S.E. Radachowsky, J.J. Guzman, M.A. Chiu, “BackyardNet?: Distributed Sensor Network Powered by Terrestrial Microbial Fuel Cell,” Technology, SPIE Proc., 2010, 7693.
- Du Z.,Li H., Gu T., “A state of the art review on microbial fuel cells: A promising technology for wastewater treatment and bioenergy”, Biotechnol. Adv., 2007, 25, 464–482.
- A.Pietrelli, A. Micangeli, V. Ferrara, A. Raffi, “Wireless Sensor Network Powered by a Terrestrial Microbial Fuel Cell as a Sustainable Land Monitoring Energy System,” Sustainability, 2014, 7263.
- S. E. Adami, N. Degrenne, C. Vollaire, B. Allard, F. Buret, “Autonomous Ultra-Low Power DC/DC Converter for Microbial Fuel Cells”, IEEE, 2011, 398-401.
- J.Park, Z. Ren, “High efficiency energy harvesting from microbial fuel cells using a synchronous boost converter”, Journal of power sources, 2012, 322-327.
- J. Park, Z. Ren, “Efficient Energy Harvester for Microbial Fuel Cells using DC/DC Converters”, Proceedings of IEEE Energy Conversion Congress and Exposition, 2011, 3852-3858.
