Interregional differentiation and analysis of spatial inequality governance performance in China

Author: Tarasova O.V., Isupova E.N.
Journal: Economic and Social Changes: Facts, Trends, Forecast @volnc-esc-en
Section: Global experience
Article in issue: 5 т.18, 2025.
Free access
The People’s Republic of China exhibits significant interregional differentiation across various socio-economic development indicators, including population, income level, education, and others. Researching the potential for managing spatial inequality within the framework of state regional policy necessitates the development of an approach for a comprehensive assessment of provincial socio-economic development. This approach should account for the state’s capacity to influence specific development indicators and include an analysis of the interregional disparities in the resulting evaluations over time. The aim of the work is to provide a quantitative assessment of regional policy performance across the provinces of the PRC in the context of reducing spatial inequality. The methodology is based on constructing a composite index of regional policy performance for 31 PRC provinces for the periods 2016–2019 and 2020–2023, incorporating 55 socio-economic development indicators. The indicators are grouped into eight key dimensions: Security; Healthcare; Education, Science and Innovation; Social Support; Sports and Culture; Transport; Ecology; Economic Development. The empirical findings demonstrated that eastern and central Chinese provinces exhibit higher composite index values, reflecting stronger policy performance. The Gini coefficient for the composite index decreased to 0.4 compared to 0.426 in the 2016–2019 period, indicating a reduction in spatial inequality in China as a result of implemented regional policy measures. The leaders were most distinctly separated from the main group of provinces in the dimensions of Ecology; Education, Science and Innovation; Sports and Culture; and Healthcare. The dimensions of Social Support and Transport displayed a more balanced distribution of outcomes across the national territory. During the pandemic period, disparities in Economic Development; Sports and Culture; and Healthcare decreased significantly. The analysis reveals that the regional policy performance index tends to be higher in economically advanced provinces of China and lower in larger provinces. Involvement in national-level spatial integration projects also emerges as a critical success factor in improving policy performance. The obtained results contribute to a deeper understanding of existing differentiation in regional development in China and provide valuable insights for refining the strategic design of future regional policy, as well as for developing and implementing measures to balance the level of socio-economic development across its provinces
Interregional differentiation, spatial inequality, regional policy, complex assessment, indicators, provinces, indices, provincial ranking
Short address: https://sciup.org/147252471
IDR: 147252471 | UDC: 338.24 | DOI: 10.15838/esc.2025.5.101.13
Text of the scientific article Interregional differentiation and analysis of spatial inequality governance performance in China
Currently, China exhibits a pronounced level of interregional differentiation, with significant inequality persisting between the central, eastern, and western provinces. Furthermore, various studies highlight disparities not only in the distribution of per capita income (Candelaria et al., 2010) but also in the level of development of healthcare, education (Wan et al., 2023), and environmental quality (Liu et al., 2018).
Regional inequality can lead to various negative consequences: a slowdown in long-term economic growth, the emergence of market imperfections (Alesina, Perotti, 1996), a deterioration of the institutional environment, and increased political tension (Perotti, 1996; Ippolito, Cicatiello, 2019), as well as constraints on the mobility of both physical and human capital (Magrini, 2004).
This naturally raises the question of the potential of state regional policy1 to reduce interregional disparities across various indicators of socioeconomic development.
Contemporary regional policy in the People’s Republic of China is based on the pursuit of balanced development that considers the capacities and needs of different territorial entities. However, the achievements gained under this approach are yet to be fully assessed.
The formation of modern principles of regional development in China can be divided into four key stages (Huang et al., 2023). The first stage (1949– 1978) reflects the principles of the early balanced regional policy. Its goal was to ensure stable territorial development through the industrial sector. The second period (1978–1995) coincided with the “opening up” policy, when China actively sought to develop trade relations with various countries against the backdrop of rapid global economic growth, with port provinces receiving a significant development impulse. Economic differentiation intensified, and the policy of this period is referred to as unbalanced. The third stage spanned from 1995 to 2013, during which regional policy once again began striving for balanced regional development, while modern concepts of coordinated development emerged – aiming to account for the needs and capabilities of individual provinces. Finally, the fourth stage, beginning in 2013, is characterized by the principles of balanced and coordinated regional development (Huang et al., 2023). These principles are reflected in the creation of growth poles from the country’s provinces or individual cities, which differ in their level of economic development but are united to solve a specific problem or create a certain development impulse for the economy as a whole.
The aim of the paper is to provide a quantitative assessment of regional policy performance across Chinese provinces in the context of reducing spatial inequality.
Theoretical framework
There is currently no single universally accepted approach for the empirical assessment of regional policy, as the selection of indicator systems and their weights for calculating a resultant metric must account for national economic characteristics, development priorities, and the availability of statistical information. J. Hoerner and P. Stephenson (2012) systematized existing approaches to the empirical evaluation of regional development policy, identifying the following categories:
econometric statistical evaluation methods; methods based on macroeconomic modeling; qualitative analysis based on individual case studies; and multifactor microeconomic analysis.
The application of any of these approaches requires considering a large set of indicators. The diversity of measures and directions within regional policy creates the challenge of selecting indicators that most accurately reflect the observed outcomes of their implementation. The resulting comprehensive assessment must incorporate indicators over which the state can exert direct or indirect influence.
The evaluation of regional policy lacks universal standards, as it is determined by a country’s unique internal logic, traditions shaped by its history and political system, national development priorities, etc. Therefore, we will now consider a number of empirical studies devoted to state regulation of regional development in the People’s Republic of China.
Zeng et al. (2024) evaluated an emissions trading initiative in specific provinces of China. The authors identified a control group of territories that successfully implemented the emissions trading project and compared them to the rest of the country’s provinces. Disparities in economic development outcomes between the groups under the influence of the environmental management initiatives were identified and interpreted. The Difference-in-Differences (DID) method used for the evaluation is a specific tool of econometric analysis and appears effective for assessing the results of individual initiatives implemented in a limited part of the country. However, this approach does not allow for a comprehensive assessment of the results of state management of regional development, taking into account all support measures being implemented across the national territory.
An analysis of the Open Up the West program, implemented since 1999, which aims to ensure more balanced regional development in the western part of the country, was conducted in the study (Huang et al., 2023). The project involved a large volume of state investment in infrastructure projects, environmental protection, and education. The study econometrically estimated a Barro growth model incorporating government expenditures carried out under the regional policy initiative. The authors concluded that the project’s effect was noticeable only for territories located sufficiently close (within 30 km) to the major cities participating in the program.
Another study analyzed panel data from 285 Chinese cities for the period 2004–2015. It demonstrated that a new regional development instrument launched in 2009 – regional development plans for territories – had a varying impact on economic growth in the country’s cities (Yang et al., 2022). The authors found that the inclusion of cities in regional development plans in the central and western parts of the country had a negative impact on economic growth rates, whereas a significant positive effect was observed for cities in the eastern part. The study emphasizes the importance of this finding for the national government when designing regional policy measures.
A significant number of publications are devoted to the comprehensive assessment of China’s development from a regional perspective, based on the calculation of integral indices. For instance, the study by Long et al. (2019) calculated a Genuine Progress Indicator (GPI), which allowed for the ranking of Chinese provinces and analysis of their development dynamics from 1997 to 2016. The authors note that the use of composite indices provides a more complete picture of the quality of regional growth and can serve as a tool for monitoring and operational regulation of regional development. In particular, for provinces with an unfavorable environmental situation (low environmental sub-index value), such as
Beijing, Shanghai, Shanxi, and Guangdong, it is recommended to consider the advisability of introducing additional emission control standards and incentivizing the adoption of clean technologies. Conversely, low economic sub-index values, characteristic of provinces in the western part of the country like Sichuan, Yunnan, Tibet, and Gansu, suggest, according to the authors, a need for enhanced state support for the economic sector, including through the involvement of these regions in major national projects.
The study by Wang et al. (2024) proposed a Regional Sustainable Development Index, calculated for 31 provinces of China for the period 2013–2020 based on 18 indicators, using the principal component method. The analysis results revealed a close correlation between this index and the level of regional GRP per capita, as well as the Average Night-light Index (as a proxy for economic activity). According to the authors, this confirms the advisability of its application in making management decisions regarding provincial development.
Shi J. et al. (2023) calculated an integrated indicator of public service provision for 35 Chinese cities from 2011 to 2018. The calculation used 18 indicators divided into blocks covering education, healthcare, social support (mainly insurance programs), transportation, and ecology. Shi J. et al. concluded that a high level of public services was observed in cities of the eastern and central provinces, while cities in the western part of the country ranked at the bottom. It was also noted that the quality of public services could be insufficient even in economically developed cities of the country (the authors cite Beijing and Shanghai as examples).
A study devoted to the quantitative assessment of the efficiency of local governments from 2001 to 2010 involved the analysis of 47 indicators (Tang et al., 2014). The choice of the list of indicators for calculating the composite indicator of regional government performance seems debatable: some of them belong to the same type of public service, which, in our opinion, could distort the final assessments. Furthermore, the aforementioned study did not conduct an analysis of interregional differentiation among provinces based on the composite indicator.
Among Russian works, there are also studies on China’s regional policy. For example, the conceptual foundations and institutional framework of state management of regional development in China are discussed in detail in the works of staff from the Institute of Far Eastern Studies of the Russian Academy of Sciences (China: Regional Economics, 2015) and the Institute of China and Contemporary Asia of the Russian Academy of Sciences (Chubarov, 2020; Chubarov, 2025). S.B. Makeeva (2020) systematizes the historical experience and transformation of the regional development planning system in China from 1949 to 2019. S.K. Pestsov (2023) analyzed the modern principles of China’s regional policy and its development in recent decades. The author describes the accumulated practical experience in regional development governance in detail and examines the most successful cases.
A monograph written by an international team involving the Institute of Socio-Economic Development of Territories of the Russian Academy of Sciences (ISEDT RAS) and Jiangxi Academy of Social Sciences (Economic Development…, 2017) contains an attempt to draw parallels in the trends of socio-economic development of regions in Russia and China, as well as a comparison of regional development governance practices.
P.M. Mozias (2023) raised the question of the role of state regional development policy in reducing interprovincial differentiation. Within a sufficiently deep retrospective, an explanation of its dynamics (in terms of per capita income) is provided through the lens of implemented state regional policy measures, as well as external factors. The work by D.B. Kalashnikov and I.B. Mitrofanova (2023)
points out territorial imbalances in China at the current stage of the transition to a post-industrial society and the related new aspects of regional policy.
It is important to note that in the works listed above, regional policy performance was not discussed for all Chinese provinces as a whole (analysis is more often done for macro regions or applied to individual provinces, using individual performance indicators); a comprehensive quantitative assessment of policy performance was not conducted. Furthermore, the differentiation of regional policy outcomes was not specifically analyzed, nor was the dynamic of indicators studied in the context of the transforming role of regional authorities in China.
This transformation occurred as a result of an exogenous external shock – the coronavirus pandemic that began in January 2020. To enable rapid and more effective response based on current information, Chinese provinces were granted greater freedom of action, including the ability to implement certain measures without the need for additional approval. This situation significantly increased the importance of coordinated regional policy measures. For instance, examining regional policy measures in Hubei and Zhejiang provinces during 2020–2022, Mao Y. (2023) concluded that coordinated and consistent actions by provincial authorities, and effective interaction between the government, businesses, and households, could significantly reduce the negative consequences of the pandemic in Zhejiang province.
The pandemic significantly influenced the differentiation of socio-economic development among Chinese provinces; this issue has been examined in detail by a number of researchers. For example, Wan W. et al. (2023), using data for 20 provinces (218 cities) from 2013 to 2022, showed that the impact of the pandemic on the level of income inequality varied greatly by region. The implications were more severe for regions with a higher share of services in GRP and for those more dependent on foreign trade. At the same time, the development of digitalization in a city’s economy helped mitigate the consequences in terms of income distribution inequality.
Dwelling into the reasons for the uneven regional development response to the pandemic, Li J. et al. (2022), using data from 287 Chinese cities, showed that the speed of infection spread and, consequently, the impact of COVID-19 strongly depended not only on the flow of people from Wuhan province in the early days of the pandemic and population density, but also on the characteristics of city authorities (having higher education, connections with federal authorities, work experience in the medical field, etc.).
Thus, issues of state governance of regional development, along with the performance and effectiveness of regional policy, are widely discussed in the scientific community.
A critical analysis of the literature revealed the absence of comprehensive quantitative assessments of the results of regional policy implementation in China. Furthermore, a comparative analysis of regional policy performance in China before and after the pandemic has not been presented to date.
Research methodology
To quantitatively assess regional policy performance in China, an integral indicator of the socioeconomic development of territories is calculated. The assessment methodology presented in the work of O.V. Tarasova and S.V. Sedipkova (Tarasova, Sedipkova, 2024) was modified to account for the specifics of China.
The quantitative assessment process involved several stages: selection of indicators and populating each of the considered dimensions, data processing (averaging indicators, scaling, and normalization), determination of weighting coefficients, calculation of sub-indices for each dimension, and calculation of the composite index.
The resulting composite index of regional policy performance, as well as the dimensional subindices, were normalized to a range of 1 to 100 for ease of interpretation. Thus, the province with the best regional policy performance received an index score of 100, and the province with the worst results received a score of 1. Subsequently, provincial rankings based on regional policy performance were constructed.
It is important to note that the obtained scores for Chinese provinces are relative, meaning they allow for the comparison of policy performance across the country’s territories. In other words, a low composite index value for a particular Chinese province does not indicate “poor” results in state governance of regional development, but rather that the results in other provinces were higher.
The calculation was performed for 31 provincial-level territorial units in China. The special administrative regions – Hong Kong (Xianggang) and Macao (Aomen) – were excluded due to the lack of statistical data for these territories.
The comprehensive assessment of regional policy performance for Chinese provinces was conducted using data from the period 2016–2023. To assess dynamics, the pre-pandemic period (2016–2019) and the COVID-19 pandemic period (2020–2023) were considered. The composite index was constructed based on the average annual values for each of the considered periods, as this helps smooth out potential fluctuations observable in individual years.
Examining the periods before and after the start of the pandemic is also motivated by the fact that, as mentioned earlier, after the official declaration of the pandemic in China in January 2020, provinces were granted greater freedom in choosing mechanisms and tools for managing socio-economic development.
The selection of indicators for calculating the composite index of regional policy performance was based on the availability of statistical data, the country’s spatial development priorities and directions, and was determined by the mechanisms of state governance and the principles of China’s regional policy. The calculation was based on 55 indicators of provincial socio-economic development over which the state can exert direct and/or indirect influence. These were grouped into eight dimensions: Security (5 indicators); Healthcare (4); Education, Science and Innovation (7); Social Support (7); Sports and Culture (9); Transportation (4); Ecology (6); and Economic Development (13). The data source was the National Bureau of Statistics of China2.
The weighting of indicators within the composite index was determined considering a scored expert assessment of the degree of state influence on them (the logic for assigning weights is described in (Tarasova, Sedipkova, 2024)). The weight of an indicator is higher, the less its level is determined by the activity and decisions of the private sector (businesses, households, and individual citizens). Thus, instead of equal weights of 0.018 (= 1/55), indicators were assigned weights ranging from 0.006 (assigned 1 point according to the logic described above, e.g., GRP dynamics and labor productivity) to 0.03 (assigned 5 points, e.g., the number of meteorological stations).
Table 1 presents the list of indicators, their distribution across key dimensions, and their assigned scores. It is emphasized that within the scope of this article, we do not correlate “plan” versus “actual”, results versus state expenditures for their achievement, focusing precisely on the observed “outputs” of regional policy, i.e., we do not discuss aspects of its performance and efficiency.
Table 1. Socio-economic development indicators for calculating the composite index of regional policy performance
|
Indicator name |
Unit of measurement |
Score |
|
|
Security |
|||
|
1 |
Street illumination |
number of street lights, by Engel coefficient |
5 |
|
2 |
Electricity generation |
kW per 1 yuan of GRP |
4 |
|
3 |
Food security |
volume of agricultural output per capita |
3 |
|
4 |
Length of fibre-optic cable lines |
km, by Engel coefficient |
4 |
|
5 |
Road traffic casualties |
share of killed and injured in the total population, % |
2 |
|
Healthcare |
|||
|
6 |
Number of healthcare institutions |
units, by Engel coefficient |
2 |
|
7 |
Number of medical personnel |
persons, by Engel coefficient |
2 |
|
8 |
Hospital bed capacity |
beds, by Engel coefficient |
3 |
|
9 |
Number of public toilets |
units, by Engel coefficient |
4 |
|
Education, Science and Innovation |
|||
|
10 |
University graduates |
share of the total population, % |
2 |
|
11 |
Number of academic degrees awarded |
share of the total population, % |
3 |
|
12 |
Number of academic and administrative staff in higher education institutions |
persons per 1 graduate |
2 |
|
13 |
Number of graduates from specialized secondary and vocational institutions |
share of the total population, % |
4 |
|
14 |
Number of academic and administrative staff in specialized secondary and vocational institutions |
persons per 1 graduate |
3 |
|
15 |
R&D personnel in industrial enterprises (labor input) |
person-years per 1 urban resident |
3 |
|
16 |
Number of national patent applications filed |
units per 1 urban resident |
3 |
End of Table 1
|
Indicator name |
Unit of measurement |
Score |
|
|
Social Support |
|||
|
17 |
Share of rural population |
% |
3 |
|
18 |
Share of population with access to piped gas |
% |
4 |
|
19 |
Share of population with access to tap water |
% |
4 |
|
20 |
Share of rural population with income below the subsistence minimum |
% |
3 |
|
21 |
Number of social service institutions |
units, by Engel coefficient |
5 |
|
22 |
Share of poor rural population participating in the “five guarantees” insurance program |
% of the total rural population living below the subsistence minimum |
5 |
|
23 |
share of insured population |
% |
3 |
|
Sports and Culture |
|||
|
24 |
Number of higher education institutions |
units, by Engel coefficient |
2 |
|
25 |
Number of specialized secondary, vocational institutions, primary and secondary schools |
units, by Engel coefficient |
3 |
|
26 |
Number of magazines and newspapers |
copies per capita |
3 |
|
27 |
Volume of telecommunication services |
yuan per capita |
2 |
|
28 |
Number of performances by amateur art groups |
units per capita |
2 |
|
29 |
Number of museum collections |
units, by Engel coefficient |
4 |
|
30 |
Total number of books loaned by public libraries |
person-times per capita |
1 |
|
31 |
Number of people attending exhibitions, lectures, and training sessions at public libraries |
visits per capita |
3 |
|
32 |
Number of books published in the province |
units |
2 |
|
Transport |
|||
|
33 |
Public transport availability |
units per capita |
2 |
|
34 |
Length of railway lines |
km, by Engel coefficient |
2 |
|
35 |
Length of highways |
km, by Engel coefficient |
2 |
|
36 |
Passenger traffic |
passenger-km, by Engel coefficient |
2 |
|
Ecology |
|||
|
37 |
Number of parks in the province |
hectares, by Engel coefficient |
3 |
|
38 |
Area requiring waste removal |
% of the total urban area |
4 |
|
39 |
Number of road sweeping vehicles |
units per km2 |
4 |
|
40 |
Waste processing capacity |
tons/day per capita |
3 |
|
41 |
Volume of waste removed |
tons per capita |
3 |
|
42 |
Number of meteorological stations |
units per km2 |
5 |
|
Economic Development |
|||
|
43 |
GRP per capita |
yuan per capita |
2 |
|
44 |
Population growth rate |
% |
2 |
|
45 |
Growth rate of real GRP per capita |
% |
1 |
|
46 |
Share of the service sector in the economy |
% of GRP |
2 |
|
47 |
Variation in real GRP growth rates |
– |
1 |
|
48 |
Labor productivity |
yuan per 1 employed person |
1 |
|
49 |
Availability of post offices |
units, by Engel coefficient |
4 |
|
50 |
Length of urban sewage pipes |
km, by Engel coefficient |
4 |
|
51 |
Urban unemployment rate |
% |
3 |
|
52 |
Growth rate of fixed asset investment (constant prices) |
% |
3 |
|
53 |
Consumer price index |
% |
3 |
|
54 |
Ratio of import/export value to GRP |
– |
3 |
|
55 |
Marginal propensity to consume |
% |
2 |
|
Source: own compilation. |
|||
We should note several specific aspects of forming the indicator set for calculating the composite index of regional policy performance for Chinese provinces. The first is the absence of open data on sports in the country’s official statistics. Therefore, proxy indicators for sports development are used. In China, universities have large stadiums (often more than one), open spaces, and outdoor fitness equipment. The situation is similar in secondary and primary schools. Given that schools have smaller stadiums and sports facilities, they were considered separately from universities. Furthermore, university stadiums add an entertainment component to public life, as they host major sporting events.
The Healthcare dimension included the indicator for the number of public toilets in a province. In 2015, China initiated a program for the construction and renovation of sanitary facilities. Improving sanitary conditions in the country is largely aligned with state goals in the healthcare sector. This aspect of public administration gained renewed relevance during the COVID-19 pandemic.
Interestingly, official development documents3 list among state security priorities, inter alia, ensuring population access to electricity and grain, which justified the inclusion of these indicators in the analysis.
Due to the rapid growth in demand for domestic postal services, the 14th Five-Year Plan for National Economic and Social Development of China also prioritized the active development of postal services, especially in rural areas. This fact determined the inclusion of the availability of post offices for the population in the analysis.
The development of rural areas receives significant attention from the Chinese government: their sustainable development is expected not only to reduce inequality and poverty levels (most needy households in China reside in villages) but also to address food security issues. A large number of state rural development programs are in operation, such as: programs to combat soil degradation; technological programs for territorial development, including through the use of modern drones; programs to support low-income households and create jobs, among others. At the national level, there is a program to support the low-income population living in villages (the policy of “Two No Worries, Three Guarantees”), ensuring access to five basic necessities – food, clothing, education, housing, and healthcare4 (Yu et al., 2023). Additionally, provinces may implement a range of supplementary measures aimed at reducing rural poverty and supporting the elderly population.
Where necessary, relative indicators were used in the calculations instead of absolute ones. For example, the provision of park areas was accounted for using the Engel coefficient formula, i.e., considering the region’s area and its average annual resident population; the number of road traffic casualties was considered relative to the total population, etc. The scale of provinces was also taken into account. Value-based indicators were adjusted for GRP (electricity generation, foreign trade turnover) or the Consumer Price Index.
Results
Figure 1 presents a cartographic visualization of the estimated composite indices of regional policy performance across Chinese provinces for the period 2020–2023. Territories are shaded darker corresponding to higher index values.
The analysis shows that the provinces of Zhejiang, Jiangsu, Anhui, Guangdong, Shandong, Henan, Hainan, Shaanxi, Fujian, Hebei, and Jiangxi, alongside the directly administered
Figure 1. Composite index of regional policy performance by Chinese province, 2020–2023
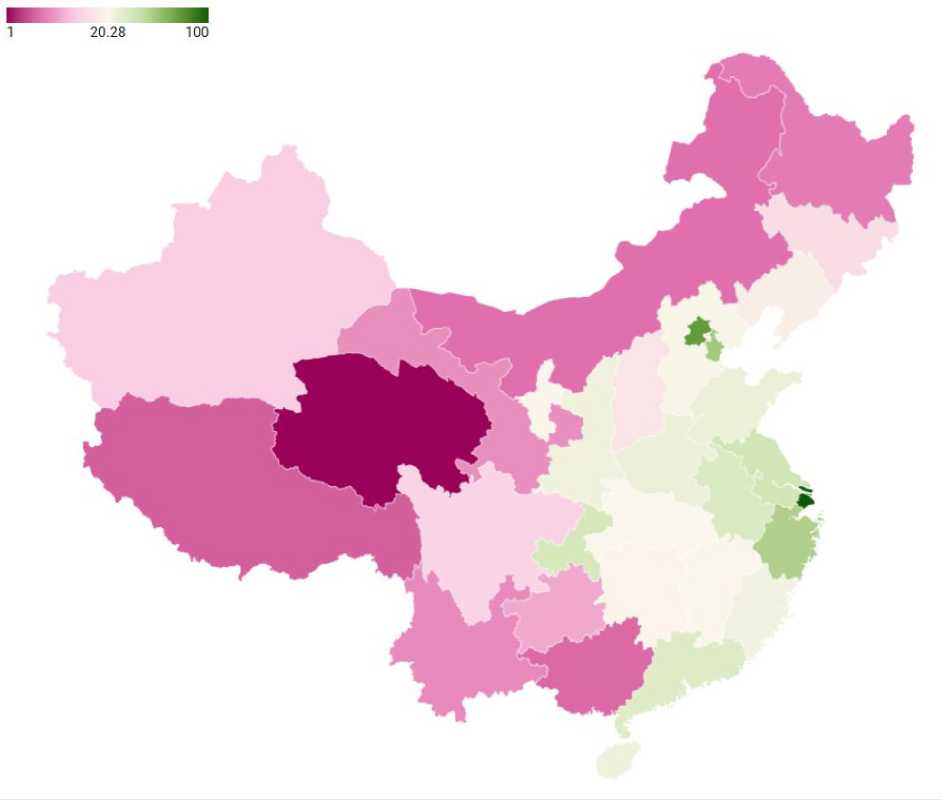
Source: own compilation based on calculation results.
municipalities of Shanghai, Beijing, Tianjin, and Chongqing, demonstrate higher composite index values compared to other territories. Shanghai is the clear leader, assigned the highest index value of 100. Following Shanghai, but with a significant gap, is Beijing with a score of 76.7. The lead of these top performers over the subsequent regions in the national ranking is also substantial: Tianjin (3rd place) – 56.7 points, and Zhejiang (4th place) – 54.4 points. Differentiation among provinces outside the top four is insignificant, which is potentially a consequence of the balanced regional policy championed by the Chinese government for over a decade (Deng, 2022).
On average, composite indices were higher in the group of eastern provinces (except for Liaoning and the Guangxi Zhuang Autonomous Region, ranking 19th and 29th respectively), as well as in some central (Anhui, Henan, Jiangxi) and western (Chongqing, Shaanxi) regions.
Table 2. Regional policy performance rankings dynamics across the considered periods
|
2016–2019 |
Province |
2019–2023 |
||
|
Rank |
Index |
Index |
Rank |
|
|
1 |
100.00 |
Shanghai |
100.00 |
1 |
|
2 |
79.71 |
Beijing |
76.69 |
2 |
|
3 |
58.62 |
Tianjin |
57.68 |
3 |
|
4 |
46.29 |
Zhejiang |
54.37 |
4 |
|
5 |
37.66 |
Jiangsu |
41.63 |
5 |
|
6 |
34.20 |
Guangdong |
34.93 |
8 |
|
7 |
31.53 |
Chongqing |
39.05 |
6 |
|
8 |
24.96 |
Shaanxi |
25.20 |
12 |
|
9 |
24.90 |
Anhui |
36.16 |
7 |
|
10 |
24.50 |
Shandong |
28.09 |
9 |
|
11 |
23.62 |
Fujian |
24.93 |
13 |
|
12 |
20.76 |
Henan |
27.64 |
10 |
|
13 |
19.53 |
Hubei |
20.28 |
16 |
|
14 |
19.32 |
Ningxia Hui Autonomous Region |
20.19 |
17 |
|
15 |
18.56 |
Liaoning |
18.95 |
19 |
|
16 |
18.42 |
Shanxi |
17.59 |
20 |
|
17 |
17.30 |
Hainan |
25.52 |
11 |
|
18 |
17.25 |
Guizhou |
11.24 |
24 |
|
19 |
16.75 |
Hebei |
22.00 |
14 |
|
20 |
15.12 |
Jiangxi |
20.68 |
15 |
|
21 |
13.77 |
Jilin |
16.27 |
21 |
|
22 |
13.47 |
Hunan |
20.01 |
18 |
|
23 |
11.33 |
Sichuan |
15.09 |
22 |
|
24 |
11.22 |
Heilongjiang |
8.14 |
27 |
|
25 |
10.17 |
Yunnan |
9.13 |
26 |
|
26 |
9.71 |
Xinjiang Uygur Autonomous Region |
14.21 |
23 |
|
27 |
6.51 |
Inner Mongolia |
7.38 |
28 |
|
28 |
6.40 |
Guangxi Zhuang Autonomous Region |
6.86 |
29 |
|
29 |
5.86 |
Gansu |
9.47 |
25 |
|
30 |
1.29 |
Tibet |
6.21 |
30 |
|
31 |
1.00 |
Qinghai |
1.00 |
31 |
|
Source: own compilation based on calculation results. |
||||
The Gini coefficient for the sample of composite indices is 0.4 (compared to 0.426 for the 2016–2019 period), indicating a moderate level of differentiation in regional policy performance among Chinese provinces, with a trend toward reduction.
The median composite index remains low at 20.28 (compared to 18.42 in the previous period). This signifies that for the majority of indicators, most regions lag behind the leading regions. As seen in Table 2, even the gap between 1st and 2nd place has become more pronounced. Notable improvements in ranking were observed for Anhui, Shandong, Henan, and Hainan (most sharply, from 17th to 11th place), while significant declines were demonstrated by Shaanxi, Liaoning, and Shanxi.
During the 2016–2019 period, the gap between the leading provinces and the majority was most pronounced in the dimensions of Ecology; Sports and Culture; Healthcare; and Education, Science and Innovation – these dimensions had the lowest median values ( Fig. 2 ). The dimensions of Social Support and Transportation were developed substantially more evenly across China.
Figure 2. Medians of sub-indices for dimensions of regional policy performance in China
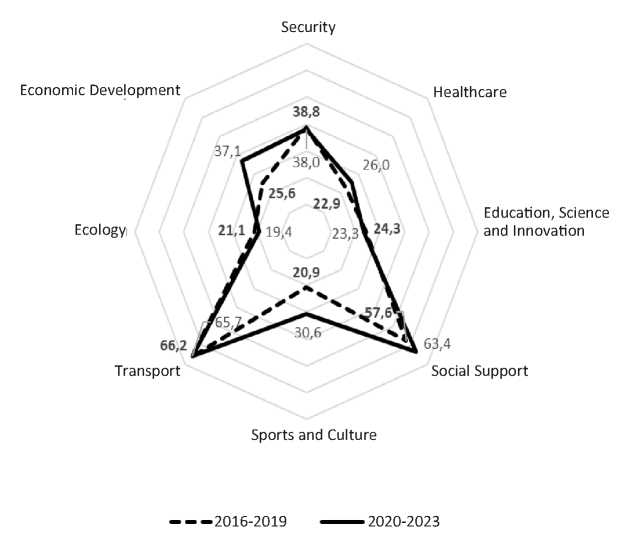
Source: own compilation based on calculation results.
The pandemic shock intensified differentiation in the Ecology, and Education, Science and Innovation dimensions. These findings align with the results of other studies. For instance, R. Blundell et al. (2020) noted a rise in regional inequality in the education sector among Chinese provinces during the pandemic. The work by Wen W. et al. (2022) points out, on one hand, an improvement in ecological conditions during the pandemic due to reduced production levels, but also, on the other hand, a large-scale negative effect associated with the reduced intensity of government efforts in cleaning territories and removing waste.
The healthcare sector gained particular significance after the onset of the pandemic. The number of cases and the rate of its increase determined the nature, intensity, and duration of restrictive measures, which directly impacted the level of socio-economic development of the territories (Li et al., 2022). The increase in the number of cases necessitated greater efforts by provincial authorities in the Healthcare dimension, even in territories that lagged in this dimension prior to the pandemic. New sanitary norms required, among other things, ensuring a high growth rate in the number of new public toilets within provinces. However, densely populated provinces found it more challenging to ensure a proportional increase in this indicator, leading to a reduction in differentiation within the Healthcare dimension.
The Sports and Culture dimension during 2020–2023, as expected, demonstrated a narrowing of the gap between most provinces and the ranking leaders: the implications of restrictive measures were more acutely felt by territories that actively host cultural events. Consequently, the reduction in outcome differentiation for this dimension cannot be interpreted as a positive result of regional policy implementation. It can be assumed that the situation will recover after the lifting of restrictive measures.
The observed and quite substantial decrease in differentiation within the Economic Development dimension is also attributed to the worsening situation of the leading provinces. This fact has been noted by other researchers as well. For example, provinces with a relatively high share of foreign trade turnover in their GRP experienced a significant slowdown in economic growth rates during the pandemic (Wan, 2023).
The applied calculation methodology enables the identification of “spatial gaps” at the level of specific sectors, allowing for the adjustment of sectoral policy priorities. Thus, low sub-index values ( Tab. 3 ) may indicate the need for the development and implementation of additional measures in the respective provinces to strengthen their position in a given dimension. Furthermore, the obtained estimates can be useful for provincial and lower-level
Table 3. Sub-indices of regional policy performance for 2020–2023
|
Province |
Security |
Healthcare |
Education, Science and Innovation |
Social Support |
Sports and Culture |
Transport |
Ecology |
Economic Development |
Composite index |
|
Shanghai |
100.0 |
100.0 |
68.6 |
73.7 |
100.0 |
46.5 |
100.0 |
100.0 |
100.0 |
|
Beijing |
24.6 |
71.2 |
100.0 |
64.1 |
88.8 |
100.0 |
88.6 |
63.2 |
76.7 |
|
Tianjin |
40.7 |
59.5 |
76.9 |
82.8 |
47.5 |
91.0 |
52.5 |
61.6 |
57.7 |
|
Zhejiang |
61.4 |
35.4 |
36.4 |
53.5 |
73.6 |
70.1 |
55.7 |
73.0 |
54.4 |
|
Jiangsu |
85.2 |
41.5 |
44.3 |
1.0 |
52.4 |
84.6 |
32.9 |
63.1 |
41.6 |
|
Chongqing |
44.6 |
31.6 |
32.5 |
58.0 |
59.5 |
93.0 |
23.9 |
57.6 |
39.0 |
|
Anhui |
40.2 |
26.6 |
24.9 |
44.6 |
78.2 |
90.3 |
22.4 |
47.1 |
36.2 |
|
Guangdong |
41.9 |
29.0 |
22.8 |
48.9 |
31.0 |
69.6 |
49.7 |
68.8 |
34.9 |
|
Shandong |
46.4 |
40.3 |
19.7 |
41.8 |
41.0 |
91.8 |
13.5 |
49.7 |
28.1 |
|
Henan |
27.6 |
40.2 |
24.2 |
50.1 |
51.9 |
83.1 |
20.3 |
36.3 |
27.6 |
|
Hainan |
38.0 |
22.3 |
14.1 |
50.5 |
30.6 |
49.2 |
44.4 |
50.7 |
25.5 |
|
Shaanxi |
45.0 |
28.0 |
29.0 |
62.3 |
36.0 |
84.8 |
23.8 |
26.0 |
25.2 |
|
Fujian |
34.6 |
26.1 |
23.3 |
53.2 |
33.8 |
53.3 |
24.7 |
52.7 |
24.9 |
|
Hebei |
37.4 |
35.7 |
25.7 |
52.0 |
29.7 |
75.8 |
12.9 |
38.7 |
22.0 |
|
Jiangxi |
36.9 |
24.9 |
23.5 |
62.5 |
28.2 |
77.1 |
20.7 |
30.9 |
20.7 |
|
Hubei |
21.9 |
26.0 |
23.9 |
62.8 |
24.8 |
89.3 |
19.4 |
39.6 |
20.3 |
|
Ningxia Hui AR |
64.9 |
12.5 |
15.4 |
73.8 |
21.1 |
60.3 |
34.2 |
18.0 |
20.2 |
|
Hunan |
29.7 |
27.5 |
19.7 |
39.4 |
32.2 |
81.3 |
19.2 |
43.8 |
20.0 |
|
Liaoning |
43.7 |
27.1 |
26.4 |
63.8 |
17.9 |
83.9 |
19.4 |
24.7 |
18.9 |
|
Shanxi |
28.9 |
22.2 |
28.2 |
63.4 |
42.4 |
59.1 |
13.6 |
16.5 |
17.6 |
|
Jilin |
18.5 |
21.5 |
40.0 |
81.6 |
22.1 |
65.7 |
9.8 |
22.4 |
16.3 |
|
Sichuan |
37.7 |
21.7 |
15.5 |
65.1 |
19.2 |
49.7 |
11.5 |
37.1 |
15.1 |
|
Xinjiang Uygur AR |
54.4 |
2.7 |
2.5 |
91.7 |
12.8 |
21.7 |
11.6 |
43.6 |
14.2 |
|
Guizhou |
31.6 |
22.3 |
7.4 |
66.6 |
16.0 |
61.6 |
6.6 |
33.3 |
11.2 |
|
Gansu |
33.6 |
11.2 |
11.9 |
65.6 |
24.6 |
43.3 |
2.3 |
29.7 |
9.5 |
|
Yunnan |
39.7 |
14.1 |
13.0 |
71.4 |
17.6 |
43.2 |
2.6 |
24.6 |
9.1 |
|
Heilongjiang |
39.4 |
12.3 |
20.9 |
79.6 |
1.0 |
52.0 |
22.1 |
9.3 |
8.1 |
|
Inner Mongolia |
47.4 |
6.9 |
14.6 |
64.3 |
12.7 |
56.1 |
1.0 |
24.4 |
7.4 |
|
Guangxi Zhuang AR |
29.3 |
17.6 |
14.6 |
56.5 |
12.2 |
41.1 |
6.8 |
29.7 |
6.9 |
|
Tibet |
1.0 |
1.0 |
1.0 |
100.0 |
43.2 |
1.0 |
6.4 |
18.2 |
6.2 |
|
Qinghai |
25.2 |
2.1 |
5.3 |
78.1 |
27.8 |
33.5 |
2.1 |
1.0 |
1.0 |
Source: own compilation based on calculation results.
authorities in terms of identifying “bottlenecks” and making independent management decisions to address them and/or lobbying for assistance from the national government.
Discussion
The analysis of regional policy performance in China presented above will now be supplemented by an investigation into the factors contributing to positive dynamics of the index.
We begin by presenting a correlation analysis between the composite index of regional policy performance and provincial size in terms of territorial area, population, and GRP.
Table 4 presents the pairwise correlations (and their significance levels) between the composite index of regional policy performance and provincial size indicators for China, calculated using the Pearson formula5. It can be observed that in China, a higher level of regional policy performance in both periods was associated with administrative-territorial units having higher GRP per capita and a smaller territorial area.
Table 4. Correlation analysis of the composite index of regional policy performance and provincial size in China
|
Composite index of regional policy performance |
GRP |
Population |
Land area |
|
2016–2019 |
0.3179** (0.0813) |
-0.0007 (0.9972) |
-0.4885* (0.0053) |
|
2020–2023 |
0.3805* (0.0347) |
0.1087 (0.5606) |
-0.5190* (0.0028) |
|
Note : p-values are shown in parentheses. * indicates significance at 5% level, ** indicates significance at 10% level. Source: own compilation based on calculation results. |
|||
We should note that the alignment between the comprehensive assessment of regional development policy performance and provincial GRP became more pronounced after 2020 (indicated by a higher significance level of the correlation). At the same time, the population size indicator did not show a concurrent dynamic with the policy performance index either in the 2016–2019 period or after 2020.
Next, without claiming to provide an exhaustive overview, we will discuss some of China’s modern large-scale regional development projects and the territories included in them.
Table 5 presents the provinces that demonstrated significant improvement in their regional policy performance rankings, along with the names of the projects they were included in.
The ranking leaders are also included in various major national projects. For instance, Beijing and Tianjin, together with Hebei province, which notably improved its ranking position, are part of the “Jing-Jin-Ji” project, which aims to address issues of industrial production optimization and environmental problems. Guangdong province is part of the “Guangdong-Hong Kong-Macao” project, while Shanghai, Jiangsu, and Zhejiang are involved in the “Yangtze River Economic Belt” project.
Table 5. Participation of provinces in spatially extensive interregional projects of China
|
Province |
Change in ranking |
Project name |
|
Anhui |
from 9th to 7th place |
Yangtze River Economic Belt |
|
Chongqing |
from 7th to 6th place |
|
|
Jiangxi |
from 20th to 15th place |
|
|
Hunan |
from 22nd to 18th place |
|
|
Gansu |
from 29th to 25th place |
|
|
Hebei |
from 19th to 14th place |
Jing-Jin-Ji |
|
Shandong |
from 10th to 9th place |
Yellow Sea – Bohai Bay |
|
Source: own compilation. |
||
All the mentioned spatially distributed projects are part of the new phase of regional policy aimed at reducing territorial development disparities across the country. Let us examine their essence in more detail.
The “Yangtze River Economic Belt” project was formally approved in April 2014, but its active implementation phase occurred during 2016– 2020. After the imposition of US sanctions in 2018, the project received a new development impulse. It was designed to mitigate the dependency of key technological economic sectors on imported components. It involves nine provinces and two directly administered municipalities (Chongqing and Shanghai). The project aims to ensure a balanced and efficient distribution of industry, taking into account the economic and environmental characteristics of the territories. The launch of the project was motivated by the following factors. Coastal provinces began facing challenges with human resources, ecology, and rising land rental costs, which started to impose a limit on their future development. To optimize the location of production, a decision was made to transfer it to the central part of the country and create industrial parks. Primarily, transportation infrastructure was created (a high-speed railway, several highways, and a waterway along the Yangtze River). Subsequently, companies and regional authorities from the southern provinces were involved in the production transfer process (automotive manufacturing, high-tech, etc.), while also participating in the distribution of future financial flows. Within the “Economic Belt” project, urban agglomerations were identified; the development of some of these was intended to be based on existing natural potential – reserves of copper, lead, zinc, and other mineral resources. Others were based on the relocation of new industries (typically located along the Yangtze River estuary). A third group combined existing capabilities, particularly in the chemical industry, with new ones arising from the transfer of production to industrial parks. Parallel to the relocation of industries, subway lines were actively expanded in cities, thereby allowing a larger proportion of the provincial population to work in the new production facilities, while simultaneously reducing labor costs. Thus, the southern provinces contributed through financial and technological resources and existing progressive management strategies, while the central territories contributed through human capital and land. We should note that some provinces are fully included in the project territorially, such as Anhui, Jiangxi, Hunan, and Chongqing. A second group of provinces is partially involved through the inclusion of specific cities and counties (Guizhou and Yunnan). A third group is assigned a supportive function, generally related to providing transportation infrastructure based on existing potential without an additional development impulse (Henan, Shaanxi, and Gansu).
Another major spatial-organizational project is the “Beijing-Tianjin-Hebei Province Cities” project (Jing-Jin-Ji project). Officially launched in 2014, this project was designed to address the environmental problems of the territories. In 2018, five of the ten most polluted cities in the country were located within the Jing-Jin-Ji area. A noticeable intensification of territorial integration was observed from 2020 onwards. It was anticipated that environmental improvement would be achieved through production transfer and support for environmental initiatives. Participant cities in the project received the status of a free trade zone partner of Tianjin to facilitate business conditions (Zhang et al., 2020).
The “Guangdong-Hong Kong-Macao” project gained active development in 2017 and was intended to become a key transportation, technological, trade, and financial hub within the national “Belt and Road” initiative for international trade development. During the 2020–2024 period, active development of transportation infrastructure and the institutional environment was observed. To date, the project’s cities attract a large number of both major technology corporations and startups, aiming to create a favorable environment for their development.
Hainan province, which rose in the ranking from 17th place in the 2016–2019 period to 11th in the 2020–2023 period, also participates in a major project focused on developing trade relations.
Thus, we observe that most provinces that significantly improved their position in the regional policy performance rankings are involved in successful spatially distributed interregional projects in China. The unification of cities and individual provinces created a competitive advantage, allowing them to partially compensate for the negative consequences of the pandemic. From this perspective, analyzing the organizational and institutional structure of these mentioned projects, being of practical interest, could become a direction for further research.
Conclusion
The paper presents a quantitative assessment of state regional policy performance for Chinese provinces, based on our own methodology, within the context of reducing spatial inequality. The assessment approach is based on constructing a composite index derived from 55 indicators, used to form provincial rankings. The analysis was conducted for two periods: before (2016–2019) and during the COVID-19 pandemic (2020–2023).
It was shown that during the study period, high scores for regional policy performance were observed in the eastern provinces and some central territories. The top three positions in the ranking were occupied by the directly administered municipalities of Shanghai, Beijing, and Tianjin. The lowest-ranking regions were Qinghai and Tibet. The most balanced results were observed in Jiangxi province, which occupied 15th place in the 2020– 2023 ranking.
The Gini coefficient for the sample of composite indices indicates a moderate level of differentiation in regional policy performance among Chinese provinces, with a trend toward reduction – from 0.426 to 0.4.
The gap between the leaders and the majority of provinces was most pronounced in the dimensions of Ecology; Education, Science and Innovation; Sports and Culture; and Healthcare. The dimensions of Social Support and Transportation displayed a more balanced distribution of outcomes across China. During the pandemic, differentiation noticeably decreased in the dimensions of Economic Development; Sports and Culture; and Healthcare.
An important finding is that provinces which significantly improved their ranking in terms of regional policy performance are involved in successfully implemented spatial integration projects in China. This underscores the significance of studying China’s experience in applying this mechanism of regional policy from the perspective of potential adaptation, including within Russian conditions.
It was also found that high scores of the composite index of policy performance were observed predominantly in provinces with high GRP per capita and small territorial area, as evidenced by significant correlation coefficients in both the 2016–2019 and 2020–2023 periods. This suggests that significant results from regional policy implementation cannot be expected in economically underdeveloped and/or large-area provinces.
The obtained findings are not only of research interest and contribute to the understanding of existing regional development differentiation in China but also hold practical significance. They provide valuable insights for defining the future contours of China’s regional policy, and for designing and implementing measures to balance the level of socio-economic development across its provinces.
