Intraregional differentiation of demographic potential in the Republic of Tatarstan

Author: Biktimirov Niyaz M., Gaifutdinova Ramziya M., Ibragimova Alisa A., Ildarkhanova Chulpan I.
Journal: Economic and Social Changes: Facts, Trends, Forecast @volnc-esc-en
Section: Social development
Article in issue: 3 (63) т.12, 2019.
Free access
The issues of formation of agglomerations are more considered from the economic point of view and as an effective way of infrastructural development of territories. However, the demographic aspects of studying the potential of the regions' territories are left without attention. The purpose of the research is to determine the zones of demographic risk and stability of the Republic of Tatarstan and identify the vector of demographic development of its three agglomerations. The theoretical analysis of the concept of “agglomeration” helps consider the unification of cities and municipal districts not from the geographical and economic perspective, but as a tool for effective development of human capital. The method of rapid analysis of demographic processes in the Republic of Tatarstan developed by the Center for Family and Demography at Tatarstan Academy of Sciences is a differentiated analysis of demographic prospects of agglomerations of the Republic taking into account their initial potential. In the article, based on the agglomeration approach we differentiated intra-regional demographic potential of municipal formations of the Republic. In order to determine the zones of demographic risk in three agglomerations, we calculated the integrated rank of municipal districts according to the main demographic indicators: total fertility rate, mortality, natural growth, marriage rate, divorce rate and migration gain. The article reviews in detail birth rate as the most important category of the region's socio-demographic development. The ranking of municipal districts of the Republic of Tatarstan included in various agglomerations, according to the current demographic situation, helps identify the region's prosperous zones at the present development stage. The definition of risk zones will help adjust the social and demographic policy of municipalities, thereby ensuring sustainable demographic development of the Republic of Tatarstan as a whole.
Birth rate, migration, marriage rate, divorce rate, mortality, republic of tatarstan
Short address: https://sciup.org/147224179
IDR: 147224179 | UDC: 314.02 | DOI: 10.15838/esc.2019.3.63.12
Text of the scientific article Intraregional differentiation of demographic potential in the Republic of Tatarstan
Introduction. The priority areas of Russia’s development are the regional strategies of sustainable development, with one of the mechanisms being the formation of agglomerations.
A.L. Kudrin, Head of the Center for Strategic Development, at the session “Economy of a Thousand Cities” noted that in order for Russia to remain a competitive country, to grow rapidly, it must grow and create its largest agglomerations. In his opinion, urban agglomerations should appear in all parts of the country; they will be the place where intellectual potential, social capital and quality of life are concentrated. American scientist P. Krugman [1] notes that if economic activities are unevenly distributed large agglomerations can form, which in turn will form a gap within a country or region.
The Concept of the Strategy of Spatial Development of the Russian Federation up to 20301 considers an agglomeration as an urbanized area, a system of resettlement. According to the Concept, there are 124 formed and emerging agglomerations in Russia.
Theory and methodology. The issues of studying agglomerations are interdisciplinary; they attract the attention of economists, sociologists, geographers, historians, demographers, etc. There are numerous interpretations of the concept of “agglomeration” which are covered in the works by S.A. Kozhevnikov [2; 3].
An agglomeration is a complex of urban settlements or regions, which is united mainly through economic ties2 and ensures the improvement of resource efficiency (territorial and financial), as well as the development of human capital. The intensity of economic and labor migration determines the presence and nature of interaction between settlements. There is an agglomeration effect which summarizes the economic and demographic potential of several settlements. From this point of view, agglomerations are becoming an important component of the region’s socioeconomic growth.
The issues of assessing the social component of the region’s potential become important in modern conditions of social and demographic tensions. In turn, this socio-demographic problem remains poorly studied from the theoretical, methodological and practical point of view, which can lead to incorrect forecasting and selection of ineffective management decisions. We found out that there is no single interpretation of the category “demographic potential”.
A.G. Vishnevskii together with other researchers defined the essence of demographic potential as the number of residents in a territory. They use the following indicators to characterize the demographic potential: population and its reproduction (birth rate, mortality), age composition, life expectancy, migration gain, population growth forecast, life expectancy at birth, demographic ageing and provision of pensions.
In this paper, demographic potential is considered not just as the region’s population, but as a system that helps assess fertility rate, mortality rate, marriage rate, divorce rate and migration rate, that is, the territory’s viability [4]. In the practical part of the research we will discuss in more detail the potential of fertility as it acts as an important factor in determining the territory’s demographic potential. There is a need to study the demographic potential within the territory’s human potential. In this aspect, demographic potential should be considered as a quantitative and qualitative potential of population reproduction in a particular territory (region). It is based on indicators such as population, its sex and age composition, population increase (loss), migration process, etc. It is very important that the growth of demographic potential is carried out through effective demographic policy.
The current stage of the country’s development is characterized by agglomeration construction which affects all major regions, including the Republic of Tatarstan. In this case, demographic indicators (birth rate and death rate, life expectancy, migration rate, etc.) will largely determine the state of territorial development. This phenomenon is confirmed by regional strategies. In 2015 “The Strategy of Socio-economic Development of the Republic of Tatarstan up to 2030” was developed. Its main value is the human, and human capital is the basis of economy, the key to success. A measure of successful region’s development is the quality of life of its population, the quantity and quality of accumulated and successfully functioning human capital. The strategy of accumulating human capital includes several social areas, including demographic, that is, demographic development is the factor in its formation.
Statistical analysis of demographic processes shows that the impact on at least one of determinants is reflected in the overall performance. Each factor has its own set of internal and external conditions that determine the overall result.
V.V. Merkur’ev singles out agglomeration of municipalities, interpreting it as a type of functioning of a certain number of municipalities in a concentrated area, integrated into a common, diverse dynamic system with strong internal ties that contribute to effective and mutually beneficial use of local resources (labor, financial, material, informational) [5]. A.E. Katz [6] considers the formation of agglomerations as a new way of territorial development (infrastructure and economic). The unification of municipal districts is beneficial for both central core and adjacent territories.
The issues of agglomeration formation are mostly considered from the economic point of view and as an effective way of infrastructure development. Thus, there is a very significant set of works where the welfare of individual territories is analyzed taking into account the population’s income level [7–10]. However, there are almost no works devoted to the study of the most important processes of modern socio-demographic development of agglomerations. S.R. Khusnutdinova and M.V. Safonova in their article “The demographic situation of urban territories in the Republic of Tatarstan” [11] present a general analysis of the demographic situation in three agglomerations of the Republic – Kazan, Kama and Almetyevsk. The authors positively describe the demographic situation in urban territories of the Republic in 2014. It is noteworthy that agglomeration processes increase asymmetry in the regions’ socio-demographic development, predetermining the importance of leveling the negative effects of local accumulation of resources [12].
N.L. Mosienko [13] justified the need to supplement the geographical and economic approaches to the study of agglomerations with sociological representation which would consider urban and rural municipal areas as a single social space. Intensive interaction which provides a common living environment defines agglomeration not only as a community of territorial zones, but also as an integrity of social space. From the sociological point of view, agglomeration should be considered as a key form of resettlement. During the agglomeration process population, characterized by mobility and circular migration, is attracted to the suburbs of large cities. There is a correlation between the opportunity to move within an agglomeration and the economic development of the territory, people’s social well-being, due to the fact that the social life of the majority is characterized by a high level of mobility [14]. According to the researcher, due to the phenomenon of mobility it is possible to form agglomerations as a cluster of settlements united by close ties.
The purpose of the study is to determine the zones of demographic risk and stability in the Republic of Tatarstan and identify the vector of demographic development of agglomerations in the Republic taking into account the overall integrated rank of demographic processes in municipal districts.
The study is practically significant as the obtained data can be used for developing the significant areas of the regional socio-economic and demographic policy, namely, for preparing the regional development program, documents of the state policy on demographic issues, etc.
Methodological tools. Based on the adopted Strategy of Socio-economic Development of the Republic of Tatarstan up to 20303 we have grouped the municipalities of the Republic into three zones: demographic zone no. 1 (23 municipal districts), demographic zone no. 2 (9 municipal districts), demographic zone no. 3 (11 districts) [15].
Table 1. Agglomerations and rural sub-zones of the Republic of Tatarstan
1) Kazan agglomeration a) Predkamskaya rural sub-zone; b) Zakamskaya rural sub-zone; c) Predvolzhskaya rural sub-zone. Demographic zone no. 1 (D1) 2) Kama agglomeration a) rural areas of the Kama agglomeration belt Demographic zone no. 2 (D2) 3) Almetyevsk agglomeration a) rural areas of the Almetyevsk agglomeration belt. Demographic zone no. 3 (D3) Source: Strategy of Socio-economic Development of the Republic of Tatarstan up to 2030. Available at:
The method of assessing the demographic potential of the territory lies in identifying the integrated rank of demographic indicators of municipal districts of the Republic. The obtained data will help demographically categorize the municipalities of the Republic of Tatarstan.
The Center for Family and Demography of Tatarstan Academy of Sciences ranked municipal districts of the Republic by demo- graphic indicators. The ranking is a necessary tool for analyzing various aspects of regional well-being in general, and agglomerations in particular [16]. There are different models of well-being: additive [17], multiplicative [18], power additive [19], etc. We selected a certain number of demogr method to reduce them to an integrated indicator [20]. In order to determine the zones of demographic risk in the three agglomerations we calculated the
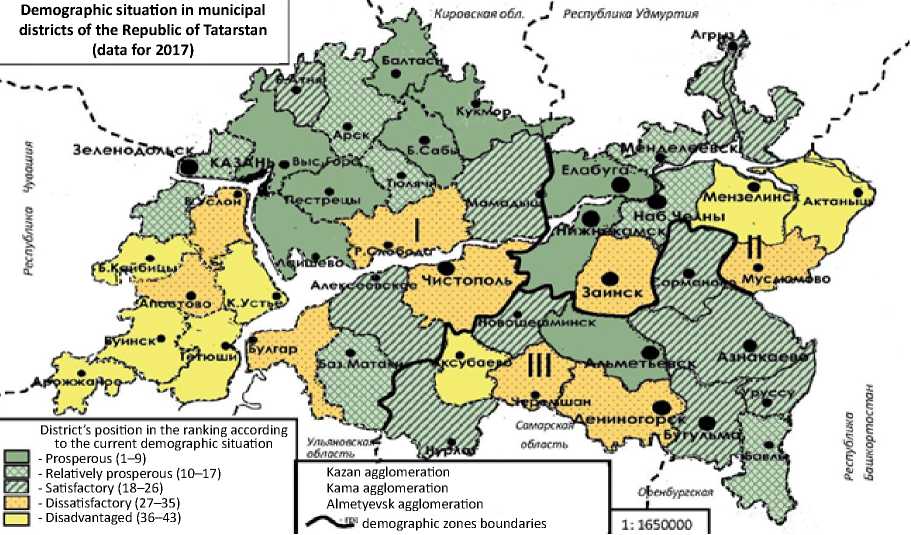
Figure 1. Zones of demographic risk and stability in the Republic of Tatarstan
С^^РИИИОГ°1 область Д* W
Республике Удмуртия а 5
C^exdyptcxaa
1:1650000 |
District’s position in the ranking according to the current demographic situation
- Prosperous (1–9)
- Relatively prosperous (10–17)
- Satisfactory (18–26)
- Dissatisfactory (27–35)
- Disadvantaged (36–43)
Kazan agglomeration
Kama agglomeration
Almetyevsk agglomeration demographic zones boundaries
Кировская обл
Demographic situation in municipal districts of the Republic of Tatarstan (data for 2017)
Compiled from: Demographic Yearbook of the Republic of Tatarstan. 2018: statistics book. Tatarstanstat. Kazan: Izdatel’skii tsentr Tatarstanstata, 2018. 162 p.
integrated rank of municipal districts based on the aggregation of demographic indicators (total fertility rate, mortality, natural growth, marriage rate, divorce rate and migration gain (per 1,000 people)). The calculation was based on the sum of ranks of all demographic processes, on received data, as well as on the definition of an integrated rank of each municipal district.
The Republic of Tatarstan consists of two urban districts and 43 municipal districts. The demographic situation in the Republic is characterized by significant spatial differentiation. The total population of the Republic of Tatarstan at the beginning of 2018 comprised 3,894,284 people4, 76.8% – urban population and 23.2% – rural. The predominance of the urban population over the rural population is observed in the 1970s5 (this may be due to the change in the status of some territories). During the year, the total gain amounted to 14,345 people (9,827 – natural, 4,518 – migration).
Results and discussion. The ranking of municipal districts in the Republic of Tatarstan included in various agglomerations based on statistics of 20176 helped identify groups of districts with a prosperous, relatively prosperous, satisfactory, dissatisfactory and disadvantaged demographic situation.
Almetyevsk agglomeration. In Almetyevsk agglomeration, the lowest position (39th) by marriage rate is occupied by Sarmanovskii municipality. Novosheshminskii district is characterized by the most favorable situation in the country (1st position) by this indicator. If Almetyevsk district did not have one of the highest divorce rates (36th position) the overall district on the current demographic situation would be rated higher. By divorce rate, the most prominent are Aksubaevskii (ranked 7th in the Republic) and Cheremshanskii (rated 10th in the country) districts. According to migration gain index, in most areas of the agglomeration a negative gain is observed. The worst situation is in Bugul’minskii (36th), Leninogorskii (38th), Sarmanovskii (39th), Nurlatskii (40th) districts. Aksubaevskii district with the indicator (-10‰) is ranked 41st. A positive migration gain is observed only in Almetyevskii municipal district (4.3‰) so it ranks 6th in the country.
Kama agglomeration. In Kama agglomeration, only 2 districts are in an unfortunate situation: Aktanyshskii (36th) and Menzelinskii (40th). In the studied demographic zone, the best demographic situation (prosperous) is observed in Nizhnekamskii (7th) and Elabuzhskii (9th) municipal districts; these areas have one of the highest fertility rates (6th and 4th) in the Republic. According to the ranking of municipal districts, low mortality rate occurred in Nizhnekamskii 9.1‰ (1st) and Elabuzhskii 10.2‰ (2nd) districts. The ratio of main demographic indicators (birth rate and mortality rate) contributed to the fact that one of the best indicators of natural population growth in the country is observed in Nizhnekamskii 2.6‰ (2nd in the country) and Elabuzhskii 2.4‰ (3rd in the country) districts. The remaining districts occupy middle positions in natural population growth and are located in the range from 19 to 27 ranks. The only exceptions are Aktanyshkii (32nd) and Muslyumovskii (36th) municipal districts.
The lowest marriage rate is observed in Tukaevskii, Agryzskii, and Aktanyshkii municipal districts. By divorce rate within the agglomeration there are also districts that demonstrate the lowest rates in Tatarstan: Nizhnekamskii, Mendeleevskii, Elabuzhskii, Zainskii. The smallest number of divorces in this agglomeration was recorded in Tukaevskii and Muslyumovskii districts (they rank 16th in the Republic). However, Muslyumovskii district has the lowest migration gain among 9 districts in the zone (-10.6 ‰) and is ranked 42nd in the list of municipal districts. Only two areas of the agglomeration have positive migration gain: Tukaevskii (6.3‰, 4th) and Mendeleevskii (3.8‰, 7th).
Kazan agglomeration. Five districts of Kazan agglomeration are in the zone with the most sophisticated unfavorable demographic situation: Tetyushskii, Kamsko-Ustyinskii, Drozhzhanovskii, Kaibitskii, and Buinskii municipal districts. They have negative migration gain. Yet it is noteworthy that all districts of this sub-zone differ in a relatively low divorce rate, with the exception of Zelenodolskii district, which ranks one of last (40th). Drozhzhanovskii district, raking 35th by marriage rate, has one of the lowest divorce rates (with 1.8 people per 1.000 people, 3rd) among municipal districts. According to this indicator, Baltasinskii district is the leader in the Republic, which is in a prosperous demographic subzone and has seriously improved its performance in recent years.
In Kazan agglomeration, there are several districts where the best and worst demographic situation in the Republic of Tatarstan is observed. The most favorable demographic situation not only in the study zone, but also in the Republic as a whole, is observed in Sabinskii, Pestrechinskii, Baltasinski, Kukmorskii, Vyso-kogorski, and Laishevskii municipal districts.
Sabinskii district does not rank lower than 9th in any of the six studied indicators. Pestrechinski, Laishevskii and Vysokogorskii districts have the best positions in the Republic on fertility rate, mortality rate, natural population increase (decrease), marriage rate and migration rate. Divorce rate is the only indicator that puts them in the middle of the ranking among municipalities. Most areas are characterized by high migration gain. Pestrechinskii municipal district has a record high level in Tatarstan in terms of net migration rate (65.7 per 1,000 people).
Fertility rate. A very important reference point for the demographic well-being of the region is birth rate. Let us take a closer look at the analysis of this indicator. According to the Territorial body of the Federal State Statistics Service in the Republic of Tatarstan, the areas with the lowest birth rate are areas of unsatisfactory and disadvantaged zones: Kamsko-Ustyinskii (8.2‰), Drozhzhanovskii (7.3‰), Apastovskii (7.0‰), Kaibitskii (6.9‰), Rybno-Slobodskii (6.8‰), Tetyushskii (6.5‰). All of them are geographically part of Kazan agglomeration.
Birth rate is influenced by many factors: the patterns of demographic behavior, marriage and divorce rates, involvement in the migration process, level of education, women employment, household income, etc. In this paper, we focus on the study of the birth dynamics depending on the share of women of reproductive age. This aspect is of great interest due to the fact that there is a decrease in the share of women of reproductive age. The authors of the article carried out a retrospective analysis and demographic forecast of the number of women of reproductive age using the cohort component method. The data obtained can be found in the author’s publications [see, for example, 21].
The share of women of reproductive age comprises 44.5% of the total number of women. At the same time, the largest number is concentrated in the city of Kazan (47.3%), Elabuzhskii district (47.1%), city of Naberezhnye Chelny (45.6%), Pestrechinskii (45.4%) and Nizhnekamskii districts (45.1%). In our opinion, this is one of the most important indicators determining the further demographic development of respective territories. When determining the demographic potential of districts it is necessary to highlight the districts with the highest share of women aged 15–19 years: Drozhzhanovskii (15.9%), Aksubaevskii (15.5%), Kaybitskii (14.9%), Novosheshminskii (14.4%), Sarmanovskii (13.8%), Cheremshanskii (13.5%), Muslyu-movskii (13.4%), Rybno-Slobodskii (13.3%). However, Drozhzhanovskii district has the lowest share of female population aged 30– 34 years (9.6%), which largely determines the present unfavorable demographic situation in the district. Most districts today are in unsatisfactory and even disadvantaged demographic zones, but given the high share of young women of reproductive age, these districts will be able to significantly improve their demographic situation in the coming years.
Based on the data of recent years, many districts in the south of Kazan agglomeration have serious demographic problems, and the districts of the northern part of Kazan agglomeration, on the contrary, have positive indicators of demographic gain. Zones are formed uniting several nearby districts with similar positive or negative demographic situation.
Some districts gradually fall under the zone of demographic depletion by birth potential – in total, women aged 40–49 years (who are most unlikely to give birth to children) comprise
1/3 or more of women of reproductive age in municipal areas, that is, in these areas, these women are unlikely to contribute to population reproduction. In Kazan, this share is only 25% while in Novosheshminskii district it is 39%, in Muslyumovskii – 38%, in Drozhzhanovskii – 37%.
Low birth intensity in areas such as Drozhzhanovskii and Kaybitskii is due to the low share of women at the peak of fertility (aged 24–34). In a number of municipal districts of the Republic, where low birth rate was recorded in 2018 (Aksubaevskii, Drozhzhanovskii, Kaybitskii, and Rybno-Slobodskii), there is a high share of women of the youngest age groups (aged 15–19), which in the long term significantly increases the probability of increasing birth rate in the absence of migration from these areas. A completely different situation is observed in the districts that provide high fertility for 2018, but have a low share of women of the youngest age group aged 15–19, which will determine the birth rate in the medium term: Almetyevskii, Vysokogorskii, Zelenodolskii, cities of Kazan and Naberezhnye Chelny. Cities compensate for fertility through migration from rural areas due to the fact that women from age groups at the peak of their fertility migrate.
According to the analysis, one and the same district today may be in the demographic risk zone while having the prospects of improving the demographic situation, provided there is no outflow of young people to cities. Migration loss rate among rural women is 2.5 times higher than that among men, and among women of working age – almost 4 times higher. As a result of this predominance of women in migration outflow, the gender imbalance in this age group is significantly increased and the possibility of starting a family is lost.
On the one hand, the reproductive potential (the absolute number of women of reproductive age) is higher in the city due to higher concentration of women of reproductive age in urban areas. On the other hand, the number of children born to one woman during her lifetime is higher in rural areas. Territorial differences should be taken into account when identifying the causes that affect reproductive strategies. An increase in total fertility rate of the rural population is provided, first of all, through stable positive dynamics of the value of this indicator for the second and subsequent births. A decrease in total fertility rate (TFR) in rural areas since 20157 is only due to the change in the child’s place of birth registration, which is associated, inter alia, with the optimization of maternity hospitals in the districts. According to demographic studies, TFR in rural areas in Russia is growing at a faster pace. In 2014 it was higher than in the city by 47% due to stable positive dynamics of this indicator for the second and subsequent births.
During 2015–20178, on average there was a slight increase in the average age of motherhood in Tatarstan municipalities. Thus, the average indicator for municipal districts increased from 28.18 years in 2015 to 28.59 years. However, if we consider the change in this indicator separately in the order of births, we should note a more noticeable increase in the average age of a mother at the birth of the first child. On average in municipal districts, the age of a mother at the birth of first children increased from 25 in 2015 to 25.5 years, which indicates the ongoing process of women’s postponing their decision to have children. The average birth age of the second child during the analyzed period remained stable, fluctuations were very insignificant, the age of a mother at birth of children of the third and subsequent orders in 2017 even slightly decreased compared to the previous two years. This shift in the birth scheme can be explained by a positive impact of demographic policies, in particular maternity capital, on this category of mothers. In turn, the ongoing process of “motherhood ageing” is largely due to the postponement of first-born children.
As for the differentiation of regions in Tatarstan by average age of a mother at birth, data analysis helps draw the following conclusions.
-
1. The range of general indicators of an average age of a mother (including children of all orders) is quite wide, the spread of an average age of motherhood in municipal districts is from 26 to 30 years in 2016 and 2017. The standard deviation for this indicator is 0.88 in 2017.
-
2. The areas with the lowest average mother’s age at birth as of 2017 are: Sarmanovskii (26.8 years), Leninogorskii (26.9 years), Atninskii (27.2 years), Aksubaevskii (27.5 years), and Novosheshminskii (27.5 years).
-
3. The highest average age of motherhood at the end of 2017 is observed in the following municipal districts: Agryzskii (30.9 years), Zelenodolskii (30.2 years), Kamsko-Ustyinskii (30 years), Nurlatskii (29.6 years), and Verkhneuslonskii (29.5 years).
-
4. There is a particularly wide range of an average age of a mother at the birth of the first child (21–29 years), the standard deviation for this indicator in 2017 was 1.66. The “youngest mothers” in 2017 live in Atninskii (21.4 years old) and Alkeevskii (22.6) districts; Nurlatskii (28.9) and Laishevskii (29.3) districts have the highest rate of average age of a mother at the birth of the first child.
-
5. In general, the process of postponing childbirth has mostly affected the districts with centers that are cities of republican status or located close to urban districts (Nizhnekamskii, Nurlatskii, Zelenodolskii, Verkhneuslonskii, Laishevskii districts). The districts where the median age of motherhood remains low have predominantly rural population (Sarmanovskii, Atninskii, Novosheshminskii, Tukayevskii).
Table 2. Ranking of municipal districts of the Republic of Tatarstan according to the current demographic situation for 2017
|
Sub-zone |
Rank |
Municipal district |
|
I. Prosperous |
1 |
Sabinskii |
|
2 |
Pestrechinskii |
|
|
3 |
Baltasinskii |
|
|
4 |
Almetyevskii |
|
|
5 |
Kukmorskii |
|
|
6 |
Vysokogorskii |
|
|
7 |
Nizhnekamskii |
|
|
8 |
Laishevskii |
|
|
9 |
Elabuzhskii |
|
|
II. Relatively prosperous |
10 |
Arskii |
|
11 |
Tyulyachinskii |
|
|
12 |
Alekseevskii |
|
|
13 |
Mendeleevskii |
|
|
14 |
Zelenodolskii |
|
|
15 |
Tukaevskii |
|
|
16 |
Bavlinskii |
|
|
17 |
Alkeevskii |
|
|
III. Satisfactory |
18 |
Yutazinskii |
|
19 |
Axnakaevskii |
|
|
20 |
Atninskii |
|
|
20 |
Nurlatskii |
|
|
22 |
Novosheshminskii |
|
|
23 |
Bugulminskii |
|
|
23 |
Mamadyshskii |
|
|
25 |
Agryzskii |
|
|
26 |
Sarmanovskii |
|
|
IV. Dissatisfactory |
27 |
Cheremshanskii |
|
28 |
Zainskii |
|
|
29 |
Apastovskii |
|
|
29 |
Spasskii |
|
|
31 |
Verkhneuslonskii |
|
|
31 |
Chistopolskii |
|
|
33 |
Leninogorskii |
|
|
34 |
Rybno-Slobodskii |
|
|
35 |
Muslyumovskii |
|
|
V. Disadvantaged |
36 |
Aksubaevskii |
|
36 |
Aktanyshkii |
|
|
36 |
Buinskii |
|
|
39 |
Kaibitzkii |
|
|
40 |
Drozhzhanovsky |
|
|
40 |
Menzelinskii |
|
|
42 |
Kamsko-Ustinskii |
|
|
43 |
Tetyushskii |
|
|
Source: compiled by The Center for Family and Demography at Tatarstan Academy of Sciences. |
||
As a result of intensifying the state policy on fertility a significant impetus for changing reproductive behavior was given to women of older age (35-39) who started giving births to children, which would not take place without the measures of the demographic policy. In most districts (35) of Tatarstan, this age group ranks fourth in the ranking of the implementation of reproductive potential. An exception is Apastovskii district, where this category of women follows women aged 40– 44, as well as Arskii and Leninogorskii districts, where they are behind women of younger ages in the number of births, ranking third. Women aged 35–39 account for the majority of births of third and further children.
Conclusion
The population and the demographic structure are two most important socioeconomic indicators that characterize the sustainability of each municipal district. The deterioration of the demographic situation is facilitated by the decline in the population’ living standard, the reduction in the number of jobs, the ongoing socio-economic changes, as well as people’s poor care of their health. The observed unfavorable demographic processes are caused by the latest trend to have a small family [22], a steady decline in the number of marriages, and uncertainty about the future. A decrease in the number of children and adolescents leads to an increase in the share of elderly people in the age composition, which leads to population ageing.
The method of rapid analysis of demographic processes in the Republic of Tatarstan developed by The Center for Family and Demography at Tatarstan Academy of Sciences is a differentiated analysis of demographic prospects of agglomerations in Tatarstan, taking into account their initial potential [23] ( Tab. 2 ). The main trends in the development of rural settlements at the present development stage should include the improvement of positions of a number of municipal districts, especially those located in sub-urban areas of large cities. Previously, the expansion of cities led to a significant decrease in the rural population around the agglomeration zone, while at this stage, rural settlements, on the contrary, feel more comfortable being part of urban agglomerations. For example, municipalities adjacent to the city of Kazan (Laishevskii, Pestrechinskii and Vysokogorskii) have significantly improved their positions, which indicates the growing importance of sub-urban areas in difficult socio-economic conditions.
It is noteworthy that Kazan agglomeration consists of areas with highest (most areas of the Kama region) and lowest (most areas of the Volga region) integrated indicators of demographic development.
Thus, the analysis of demographic indicators, as well as the integrated rank of municipal districts in Tatarstan helps find out that:
– The most favorable situation is observed in Kazan agglomeration (1. average integrated rank is 20; 2. Most municipal districts of the prosperous and relatively prosperous sub-zone are included in this agglomeration, which makes up 48% of the total number of districts in this agglomeration).
– The average position is occupied by Almetyevsk agglomeration (1. average integrated rank – 21; 2. The subzone with a satisfactory situation includes municipal districts, which is 54.5% of the total number of districts in this agglomeration).
– The least attractive demographic situation is in Kama agglomeration (1. Average integrated rank – 23; 2. An almost equal number of municipal districts in each sub-zone). It is noteworthy that the demographic situation in this agglomeration in 2016 was a little better.
According to the study of the three agglomerations and all 43 municipal districts, the demographic problem remains one of the most acute in the majority of districts. The authorities in these districts are well aware that it is necessary to pursue intensive demographic and family policy [24], take urgent measures to improve the demographic situation, but this problem can be solved only by addressing many economic and social issues. In a number of districts it can be seen that programs designed to improve the standard of living in general, especially those involving youth from rural areas, ensure positive results.
The theoretical and practical contribution of this study consists in the analysis of the demographic potential of a region through the strategy of accumulating human capital, including the social and demographic focus, rather than from the geographical and economic point of view.
The experience of Tatarstan in calculating the integrated rank of municipal districts for main demographic indicators and identifying zones risk and resilience can be considered by the agglomerations in Russia (Moscow, Saint-Petersburg, Voronezh, Rostov-on-Don, Volgograd, Krasnodar, Nizhny Novgorod, Samara-Togliatti, Kazan, Ufa, Perm, Saratov, Yekaterinburg, Chelyabinsk, Omsk, Novosibirsk, Krasnoyarsk, Irkutsk, Vladivostok, Nakhodka, Khabarovsk, Tyumen, Tomsk, Barnaul, Izhevsk, Makhachkala, etc.9).
References Intraregional differentiation of demographic potential in the Republic of Tatarstan
- Krugman P. The Increasing Returns Revolution in Trade and Geography. Prize Lecture, 2008, December. Available at: https://www.nobelprize.org/uploads/2018/06/krugman_lecture.pdf
- Kozhevnikov S.A. Prerequisites for the development of the vologda agglomeration: results of sociological research. Voprosy territorial'nogo razvitiya=Territorial Development Issues, 2018, no. 5 (45). 10.15838/ tdi.2018.5.45.4. (In Russian). DOI: 10.15838/tdi.2018.5.45.4
- Kozhevnikov S.A., Voroshilov N.V. The prerequisites for the development of Vologda agglomeration. Izvestiya vysshikh uchebnykh zavedenii. Ser.: Ekonomika, finansy i upravlenie proizvodstvom=News of Higher Educational Institutions. A Series "Economy, Finance and Production Management", 2018, no. 2(36), pp. 11-19. (In Russian).
- John C. Caldwell. On Net Intergeneration Wealth Flows: An Update. Population and Development Review, vol. 31, no. 4, pp. 721-737.
- Merkur'ev V.V. The conceptual framework for enlarging municipalities of rural settlements. Evropeiskii zhurnal sotsial'nykh nauk=European Social Science Journal, 2013, no.9 (36), pp. 514-522. (In Russian).
- Kats A.E. Agglomerations: new opportunities for urban development. Problemy ekonomiki i menedzhmenta=Economics and Management Issues, 2015, no.5(45), pp. 51-53. (In Russian).
- Sen A. Real national income. Review of Economic Studies, 1976, vol. 43(1), pp. 19-39.
- DOI: 10.2307/2296597
- Kakwani N. Welfare measures: An international comparison. Journal of Development Economics, 1981, vol. 8(1), pp. 21-45.
- DOI: 10.1016/0304-3878(81)90044-4
- Lambert R.J. The Distribution and Redistribution of Income. Third ed. UK, Manchester: Manchester University Press, 2002. 336 p.
- Dagum C. On the relationship between income inequality measures and social welfare functions. Journal of Econometrics, 1990, vol. 43(1-2), pp. 91-102.
- DOI: 10.1016/0304-4076(90)90109-7
- Khusnutdinova S.R., Safonova M.V. The demographic situation of urban areas of the Republic of Tatarstan. Fundamental'nye issledovaniya=Fundamental Research, 2015, no. 12, pp. 427-431. (In Russian).
- Ataeva A.G., Ulyaeva A.G., Yaparov G.Kh. Analysis of influence intraregional agglomeration processes on the financial development of the municipalities. Fundamental'nye issledovaniya=Fundamental Research, 2014, no. 8, pp. 365-371. (In Russian).
- Mosienko N.L. Urban conglomeration as an object of sociological research. Region: ekonomika i sotsiologiya=Region: Economics and Sociology, 2010, no. 1, pp. 163-178. (In Russian).
- Kolomak E.A., Mashkina L.V. (Eds.). Mosienko N.L., Ivanova V.V., Lychko S.K. Sotsial'noe prostranstvo gorodskoi aglomeratsii: mobil'nost' i aglomerativnye effekty [The social space of an urban agglomeration: mobility and agglomeration effects]. Ekonomicheskoe razvitie Rossii: regional'nyi i otraslevoi aspekty [Economic Development of Russia: Regional and Sectoral Aspect]. Issue 13. Novosibirsk: IEOPP SO RAN, 2014. 184 p. Pp. 5-21.
- Biktimirov N.M. Otsenka demograficheskoi ustoichivosti munitsipal'nykh raionov Respubliki Tatarstan [Assessing the demographic sustainability of municipal districts in the Republic of Tatarstan]. Kul'tura, lichnost', obshchestvo v sovremennykh usloviyakh: metodologiya, opyt empiricheskogo issledovaniya pamyati professora L.N. Kogana: mater. Mezhd. konf., 22-23 marta 2018 g. [Culture, Identity, Society in Modern Conditions: Methodology, Experience in Empirical Research to the Memory of Professor L.N. Kogan: materials of an international conference, March 22-23, 2018]. Ural Federal Institute, Department for Political Sciences and Sociology at Ural Federal University, 2018.
- Gurban I.A. Territorial rating as a tool to measure the wellbeing of regions. Ekonomicheskii analiz: teoriya i praktika=Economic Analysis: Theory and Practice, 2015, no. 42, pp. 36-51. (In Russian).
- Bobkov V.N., Stepanov V.S. The Welfare Model for Assessing and Forecasting the Quality of Life and the Standard of Living of Region's Population. Uroven' zhizni naseleniya regionov Rossii=Living Standards and Quality of Life, 2014, no. 1 (191), pp. 104-110. (In Russian).
- DOI: 10.12737/3490
- Mkhitaryan V. S., Bakumenko L.P. Integrated assessment of the quality of life of the population of the Mari El Republic. Voprosy statistiki=Issues of Statistics, 2011, no. 6, pp. 60-67. (In Russian).
- Bufetova A.N. Interregional differences in living standards in Russia. Vestnik Novosibirskogo gosudarstvennogo universiteta=Bulletin of Novosibirsk State University, 2014, vol. 14, no. 3, pp. 113-123. (In Russian).
- Il'darkhanova F.A. (Ed.). Demograficheskii doklad-2018. Semeinaya i demograficheskaya politika v kontekste Strategii sotsial'no-ekonomicheskogo razvitiya Respubliki Tatarstan-2030: monografiya [Demographic Report 2018. Family and Demographic Policy in the Context of the Strategy for Socio-economic Development of the Republic of Tatarstan-2030: monograph]. Kazan: Akademiya nauk RT, 2018. 345 p.
- Ibragimova A.A. Perspektivnoe ischislenie naseleniya Respubliki Tatarstan s postoyannym rezhimom vosproizvodstva [Perspective calculation of the population of the Republic of Tatarstan with a constant regime of reproduction]. Razvitie regionovedcheskikh issledovanii v Rossiiskoi Federatsii: osobennosti i osnovnye napravleniya: sb. statei Vseross. nauch.-prakt. konf. (g. Kazan', 7 dekabrya 2018 g.) [The Development of Regional Studies in Russia: Features and Main Areas - collection of articles for the international reseach-to-practice conference (Kazan, December 7th, 2018)]. ITER AN RT. 2018.
- Kalachikova O.N., Shabunova A.A. Reproductive health and behavioral factors in its formation (based on materials of a sociological research in the Vologda Oblast). Problemy razvitiya territorii=Problems of Territory's Development, 2016, no. 1 (81), pp. 116-119. (In Russian).
- Il'darkhanova Ch.I. Institutional resources for achieving family stability. Sem'ya v sovremennom obshchestve. Seriya: Demografiya. Sotsiologiya. Ekonomika=Family in the Modern Society. Series: Demography, Sociology. Economics, 2018, vol. 4, no. 1, pp. 222-225. (In Russian).
- Il'darkhanova F.A. Constructing demographic processes in the Repoubic of Tatarstan: the potential of public administration resources. Izvestiya vysshikh uchebnykh zavedenii. Povolzhskii region. Obshchestvennye nauki=University Proceedings. Volga Region. Social Sciences, 2018, no. 4. (In Russian).
