Intrusion Detection with Multi-Connected Representation

Author: Abdelkader Khobzaoui, Abderrahmane Yousfate
Journal: International Journal of Computer Network and Information Security(IJCNIS) @ijcnis
Article in issue: 1 vol.8, 2016.
Free access
Recently, considerable attention has been given to data mining techniques to improve the performance of intrusion detection systems (IDS). This has led to the application of various classification and clustering techniques for the purpose of intrusion detection. Most of them assume that behaviors, both normal and intrusions, are represented implicitly by connected classes. We state that such assumption isn't evident and is a source of the low detection rate and false alarm. This paper proposes a suitable method able to reach high detection rate and overcomes the disadvantages of conventional approaches which consider that behaviors must be closed to connected representation only. The main strategy of the proposed method is to segment sufficiently each behavior representation by connected subsets called natural classes which are used, with a suitable metric, as tools to build the expected classifier. The results show that the proposed model has many qualities compared to conventional models; especially regarding those have used DARPA data set for testing the effectiveness of their methods. The proposed model provides decreased rates both for false negative rates and for false positives.
Connected representation, Discriminant Analysis, Mahalanobis distance, mixture of probability laws, multi-connected representation, natural class, synthetic class
Short address: https://sciup.org/15011490
IDR: 15011490
Text of the scientific article Intrusion Detection with Multi-Connected Representation
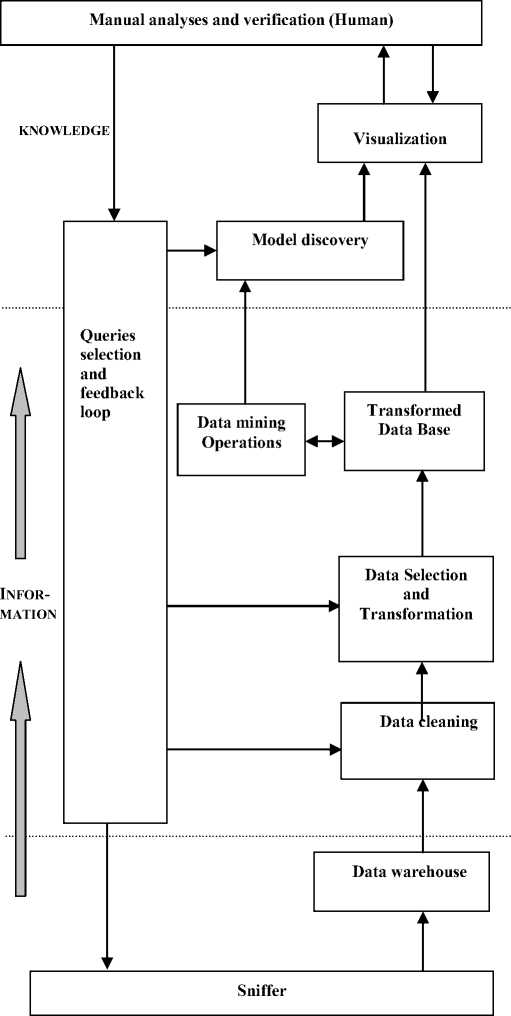
Fig.2. Data mining process for Intrusion detection
Data resulting from the network monitoring tools are collected and classified in a data warehouse. Therefore that’s subjected to a cleaning process which consists in removing the erroneous, incomplete and aberrant data, to check the total coherence of the data. The following step consists in selecting the subsets of data on which data mining operations will be carried out. This stage is known as "data selection and transformation phase" it may be either manual or automatic. Data mining operations are carried out on a subset of data then extended on the whole data. The model emerging will be validated. New detection knowledge is extracted from the data set, then a refined model is developed to try to predict future events based on the history. This process is known as "model discovery". Moreover the analysts require visualization tools to adjusting the parameters, the data sets and associations.
The paper is organized as follows. In section II, the background behind the problem is described in “Related Work”. The theoretical problem formulation on the framework of expected classes is presented in section III. The proposed model, including the algorithm, is developed in section IV. Section V presents the results of proposed model and comparisons with those of some well known related works which have used KDD’99 data sets. Finally, conclusion and extension for future research is mentioned in section VI.
-
II. Related work
From works of the seventies on the computer security auditing and monitoring and since the seminal Denning’s paper on the intrusion detection modeling [6], a variety of techniques and methods was proposed and used to detect electronic intrusions. The earliest systems that can be considered as being based on Denning’s approach were principally:
-
- Intrusion Detection Expert System (IDES) which became “Next-generation Intrusion Detection Expert System” (NIDES) developed at SRI International; it uses a deductive process based on statistics and a rule-based system for real-time detection of security violation,
-
- Multics Intrusion Detection and Alerting System (MIDAS), developed for National Computer Security Center (NCSC), uses a large part of statistical analysis to characterize normal system and user behavior,
-
- Wisdom & Sense, developed at Los Alamos National Laboratory, is an anomaly detection system which mines association rules statistically from historical audit data,
-
- Haystack, developed by Tracor Applied Sciences Inc. and Haystack Labs for US Air Force, was designed to detect essentially insider abuse.
All these earliest systems were implemented using rule-based techniques and adapted statistical models. For more information see [15].
In the 1990s, the transitions from manual approach to automatic anomaly detection approaches have been extensively developed.
In last decade, methods of data mining and machine learning have become essential to automatically discover and model features of user’s normal or abnormal behaviors. The main tools used for detecting intrusion are principally statistical and bio-inspired methods; combination of the both methods is used too. Recent reviews of existing studies can be found in [18] and [23]. Some related works which have used KDD’99 data sets to validate their models can be found in [1], [2], [3], [8], [9], [11], [12], [19], [21], and [25]. These works have used essentially one or many techniques (in hybridization case) from the following classification approaches: Multivariate analysis, K-means, naïve Bayes, nonparametric neural networks, support vector machines, decision tree, immune systems, evolutionary computation, swarm intelligence, ... For gains in response system time or for avoiding the noise of redundancy information, some authors have used appropriate feature reduction using principal component analysis (PCA) [7], [24], linear discriminant analysis (LDA) or general discriminant analysis (GDA) [20].
Generally hybrid systems give better performances than those of single systems. However, even the hybridizations of all kinds reach their limits. It was noted that none of them is able to detect all types of intrusion attacks optimally and none exploits explicitly the non connectedness of behavior representation classes. To obtain a substantial improvement in the performance of IDS, the proposed approach reconsiders the topological structure feature of the behavior representation classes with a view to exploit the advantages of both misuse detection techniques that those anomaly detection.
Exploiting the basic topological framework of the behavioral representations instead of hybridizing methods that have already been used (see [20] for example), we expect that we can get more accurate results.
Moreover, if the proposed approach is categorized as a simple technique, by hybridization we can improve the results.
-
III. Problem Formulation
In this work, we consider that data are represented in a p-dimensional Euclidean space. We assume also that the probability measure used in the system is acquired from a mixture of Gaussian densities f j characterized by their expectations µj and their variance matrices σ j ; j=1, …, m. The mixture is a convex combination of the unimodal densities f j . Hence the considered mixture density can be written:
m
g (x )=У“,/А x) (1)
= 1
with
m
^ a = i; a > 0;j = 1,..., m
= '
In this model the interesting points are essentially the modal points of g which are its local maximums. However, the number of maximums of g (denoted k) is generally greater than the number of learning classes (denoted m) when interaction between densities occurs; even if learning classes are connected. If classes are multi-connected k must be larger. Firstly, we have to differentiate between factual modes, associated to the unimodal densities f j , j = 1, ..., m, composing the mixture, and the synthetic modes obtained by interactions.
Modes are represented by points where density reaches its maximum. In experimental case, maximum is estimated by a point whose neighborhood concentration is the largest. In this study, this estimated point is called accumulation point. It is estimated using clustering techniques applied to learning data. Each cluster obtained by this method is an estimate of a natural class. These natural classes, denoted Ci; i=1, ..., k, can be represented into a partition of Rp whose the parts are connected. The study is restricted to each part which contains one and only one natural class where for all x contained in C i ; i = 1, ..., k, ∃ε(x)>0, such that
{x;x e Rp;g(x) > s(x)} c C
If natural classes constitute a sub-partition of a partition generated by the learning classes, our study becomes very easy. However, this case occurs rarely in practice.
Thereafter, each natural class is associated to a factual mode; synthetic modes (which generate synthetic natural classes) must be avoided. Discrimination between factual natural classes and synthetics ones is done using maximum likelihood method when the representation space dimension is weak [14]. We have just to resolve the equation:
V log ( L ( x 1 , x ^ ,..., x„ = ; # ) ) = 0 (2)
where L is likelihood function which corresponds to n densities product, such each density is itself a mixture of m weighted densities. Each natural class is characterized by one center µ j , a variance matrix Σ j and a weight α j . The general vector parameter θ is identified to (α 1 , ..., α m , µ 1 , ..., µ m , Σ 1 , ..., Σ m ) where α i is scalar, µ i is a p-dimensional vector and Σ i is a symmetric matrix in Rp x Rp (i=1,…,m). So θ depends on m(1+p+ p(p + 1)/2) unknown scalar parameters.
When equation (2) has unique solution, the method can be considered as a powerful tool to estimate the real natural class’s peaks.
As the system (2) is non-linear, with high number of parameters, numerical implementation of good approximate solutions is too complex. However, if real natural classes are localized, the problem can be reduced to m-subsystems. Every subsystem needs estimation of just one center and one variance matrix.
To use a parallel implementation one has temptation to build a local metric for each subsystem. However, we have observed that this approach produces a very important miss-classification rate. To avoid this weakness, we have built a global topological metric adapted to the problematic and local metric for the tests.
-
IV. Developed Model
To exploit the method within the framework of the training set, one considers a sample of n observations e1, e2, ...,en of p variables X1, X2, …, Xp describing m behaviors of which one corresponds to a normal traffic and the m-1 others correspond to attacks. So data are presented as a matrix X as follows:
X1 e1 xn • ••
X = . : \:
e n [ xn 1 •• •x
Each natural class Ci (both factual and synthetic) is characterized by its centroid c given by:
c=1 Z e13)
n i { j ;e j e C^
where n i is the cardinal of class Ci.
Information which will be exploited is summarized essentially into dispersions of the records ei around their centroids expressed in terms of variances.
Given a new element t representing a new connection and a basis (-→v1, v-→2, ..., v-→p ) in the representation space, which is an affine space, one has:
p ot = oc.+Z ejvj j=1
where o is the origin.
Generally, using vector space properties, one can write:
p cit=Z evj j=1
By noting (o—)2 the conditional variance to C t cit i direction at the fixed risk α, decision rule can be constructed under the confidence interval:
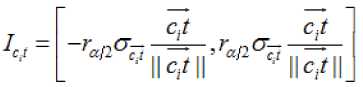
ct where rα/2 is the quantile of order 1-α/2, i is the ct unit vector in the direction of ct and origin is translated to c position. Quantity σ is obtained from variance i cit intra class Ci (within variance) projected into the direction ct. As the projection is linear, then the law of the projected points on the line generated by ct remains Gaussian; this enables to justify (6). Then, any new record, represented by t, which is characterized by its neighborhood topological properties and its associated measure, is studied just as a point in a specific interval.
Measurement aspect is essentially characterized by the variance-covariance matrix. Generally, affectation of a new observation to a natural class is easy. However, its affectation to a learning class remains difficult; especially if this learning class is multi-connected.
In fact, if the natural classes are a real sub-partition of learning classes, identifying behaviors (represented mainly by learning classes) will be without risk. Otherwise the misclassification rate risk becomes significant; which constitutes the majority of cases encountered in intrusion detection. To reduce the risk of misclassification quasi-optimally, Algorithm 1 is proposed to construct appropriate natural classes.
When natural classes are built, a new observation t will be assigned to its most appropriate class in two steps:
– First, the observation t is affected to the most appropriate natural class Ci such that:
i = arg min d(t, c) (7) j e{1,...,m} J where d(. , .) is Mahalanobis distance between t and the centroid of natural class Cj and m is the cardinal of the natural classes set. Recall that the Mahalanobis metric is associated with the inverse of the variance-covariance matrix. Thereafter if:
-
• Ci is completely included in a learning class Lj, then t is affected to Lj.
-
• Ci is partitioned over the set of learning classes {Lj , ..., Ljs }, then t is affected to the nearest Ljk ; jk ∈ {j 1 , ... j s } according to (7).
This approach avoid requiring to develop a method separating true natural classes (which are more important) from synthetic natural classes (generated by interaction).
Noting that if a natural class Ci has cardinality less than variables number p, the model fails, because variance matrix will degenerate and one can’t use local Mahalanobis distance. An alternative solution consists o f combining variances of neighboring classes proportionally to their respective cardinals to build a generalized local Mahalanobis metric.
Eventually, if regularity problem persists we have to enlarge the neighborhood of the considered natural class to build a new generalized local Mahalanobis metric and so on.
When one class Lj is selected, the distance d between the Lj centroid and the observation t will be computed; affection of t to Lj will be confirmed only if d falls in the confidence interval specified by (6).
As there are a lot of natural classes which cardinal is less than p, general local Mahalanobis metric is replaced by global Mahalanobis metric. This choice is due to complexity to build best neighborhood to make an adapted local Mahalanobis metric.
Algorithm 1: Natural classes construction algorithm
Let D ← {t 1 … t n } Learning data set
Let C ← {C 1 ,…, C k } Initial clusters
-
s0 ← 1 Initial maximum standard deviation
-
1 loop.
-
2 For each t in D do
-
3 Affect t to nearest class C i according to the Mahalanobis distance
-
4 End for
-
5 Let C new ← ϕ Empty set
-
6 For each cluster C i in C do
-
7 For each label L j in C i do
-
8 Put elements from C i labeled L j into new cluster C ji
-
9 Add C ji to C new
-
10 End For
-
11 End For
-
12 Let C ← C new
-
13 For each C i in C do
-
14 Compute its mean c j
-
15 End for
-
16 Let S ← ϕ
-
17 For each C i in C do
-
18 V j ← Covar(C i )
-
19 s ← sqrt(sum(diag(V i )))
-
20 Add s to S
-
21 End for
-
22 s ← max(S)
s
-
23 If ( 0.9 ≤ ≤ 1 ) then return C else s 0 ← s
s0
-
24 End loop
-
V. Tests Results
Using the R Environment for Statistical Computing [17], we test our model on the KDD’99 intrusion detection data set benchmark data set commonly used by many researchers for evaluation of intrusion detection techniques. The KDD’99 data set was created by processing the tcpdump portions of the 1998 DARPA intrusion detection system evaluation data set, created by Lincoln Lab under contract to DARPA; more information can be found in [13]. Actually, the KDD’99 data set includes a set of 41 features, gathered in 7 symbolic ones
(which are quantified by a binary codification) and 34 numeric. A complete description of all the 41 features is available in [10]. These features fall into four categories:
-
- The intrinsic features of a connection include the basic features of individual TCP connections. For example, duration of the connection, the type of the protocol (tcp, udp, etc), network service (http, telnet, etc), etc.
-
- The content feature within a connection suggested by domain knowledge is used to assess the payload of the original TCP packets, such as number of failed login attempts.
-
- The same host features examine established connections in the past two seconds that have the same destination host as the current connection, and calculate statistics related to the protocol behavior, service, etc.
-
- The similar same service features examine the connections in the past two seconds that have the same service as the current connection.
These features describe 23 behaviors of which one corresponds to a normal traffic and the 22 others correspond to attacks (Table 1):
Table 1. Class label in KDD’99
|
Id-behavior |
Behavior |
Category |
|
1 |
Back |
DOS |
|
2 |
buffer |
U2R |
|
3 |
ftp write |
R2L |
|
4 |
guess passwd |
R2L |
|
5 |
Imap |
R2L |
|
6 |
Ipsweep |
PROBE |
|
7 |
Land |
DOS |
|
8 |
Loadmodule |
U2R |
|
9 |
Multihop |
R2L |
|
10 |
Neptune |
DOS |
|
11 |
Nmap |
PROBE |
|
12 |
Normal |
Normal |
|
13 |
Perl |
U2R |
|
14 |
Phf |
R2L |
|
15 |
Pod |
DOS |
|
16 |
Portsweep |
PROBE |
|
17 |
Rootkit |
U2R |
|
18 |
Satan |
PROBE |
|
19 |
Smurf |
DOS |
|
20 |
Spy |
R2L |
|
21 |
Teardrop |
DOS |
|
22 |
Warezclient |
R2L |
|
23 |
Warezmaster |
R2L |
These 23 behaviors are gathered, by expert, in four categories:
-
- DOS (Denial of service): making some computing or memory resources too busy so that they deny legitimate users access to these resources.
-
- R2L (Root to local): unauthorized access from a remote machine according to exploit machine’s vulnerabilities.
-
- U2R (User to root): unauthorized access to local super user (root) privileges using system’s susceptibility.
-
- PROBE: host and port scans as precursors to other attacks. An attacker scans a network to gather information or find known vulnerabilities.
First, algorithm 1, a builder of natural classes, is applied to the training data set which contains 494,021 connections, where 97,278 correspond to normal traffic and the rest belong to one of 22 attack types. This algorithm provides a partition of 672 subsets which can be candidates of expected natural classes. Means and variances are estimated by usual estimation methods. These natural classes are used, firstly, as tools to describe learning classes and secondly to predict a new observation membership. Next, the detection system is tested on the test data set containing 4,898,431 connections where 972,781 correspond to normal traffic and the rest belongs to one of 22 attack types. The obtained results are summarized in Table 2.
Table 2. Main test results
|
G.F. |
T.D. |
T.D.R. |
F.N. |
F.N.R. |
C |
C.R. |
|
|
1 |
2203 |
2203 |
100.000 |
0 |
0.000 |
0 |
0.000 |
|
2 |
30 |
30 |
100.000 |
0 |
0.000 |
0 |
0.000 |
|
3 |
8 |
8 |
100.000 |
0 |
0.000 |
0 |
0.000 |
|
4 |
53 |
53 |
100.000 |
0 |
0.000 |
0 |
0.000 |
|
5 |
12 |
12 |
100.000 |
0 |
0.000 |
0 |
0.000 |
|
6 |
12481 |
12374 |
99.143 |
61 |
0.489 |
46 |
0.369 |
|
7 |
21 |
21 |
100.000 |
0 |
0.000 |
0 |
0.000 |
|
8 |
9 |
9 |
100.000 |
0 |
0.000 |
0 |
0.000 |
|
9 |
7 |
7 |
100.000 |
0 |
0.000 |
0 |
0.000 |
|
10 |
1072017 |
1071975 |
99.996 |
15 |
0.001 |
27 |
0.003 |
|
11 |
2316 |
2239 |
96.675 |
12 |
0.518 |
65 |
2.807 |
|
12 |
972781 |
970929 |
99.810 |
0 |
0.000 |
0 |
0.000 |
|
13 |
3 |
3 |
100.000 |
0 |
0.000 |
0 |
0.000 |
|
14 |
4 |
4 |
100.000 |
0 |
0.000 |
0 |
0.000 |
|
15 |
264 |
259 |
98.106 |
5 |
1.894 |
0 |
0.000 |
|
16 |
10413 |
10351 |
99.405 |
27 |
0.259 |
35 |
0.336 |
|
17 |
10 |
10 |
100.000 |
0 |
0.000 |
0 |
0.000 |
|
18 |
15892 |
15789 |
99.352 |
70 |
0.440 |
33 |
0.208 |
|
19 |
2807886 |
2807825 |
99.998 |
61 |
0.002 |
0 |
0.000 |
|
20 |
2 |
2 |
100.000 |
0 |
0.000 |
0 |
0.000 |
|
21 |
979 |
979 |
100.000 |
0 |
0.000 |
0 |
0.000 |
|
22 |
1020 |
1004 |
98.431 |
16 |
1.569 |
0 |
0.000 |
|
23 |
20 |
20 |
100.000 |
0 |
0.000 |
0 |
0.000 |
|
4 898 431 |
4 896 086 |
99.952 |
267 |
0.007 |
206 |
0.005 |
In table 2, G.F., T.D., T.D.R., F.N., F.N.R., C and C.R. represent respectively Global Frequency, True Detection frequency, True Detection Rate, False Negative frequency, False Negative Rate, Confusion frequency (between attacks) and Confusion Rate (between attacks).
Note that “False Negative” corresponds to case where an attack is classified as a normal traffic. As confusion matrix between all behaviors is too big, we present, in the next, a summarized confusion matrix between the five categories of behaviors which are: NORMAL, DOS, U2R, R2L and PROBE described above (see table 3).
Table 3. Results by categories of behaviors
|
NORMAL |
DOS |
U2R |
R2L |
PROBE |
|
|
NORMAL |
99.810 |
0.102 |
9e-03 |
0.049 |
0.030 |
|
DOS |
0.002 |
99.997 |
0.00 |
0.000 |
0.001 |
|
U2R |
0.000 |
0.000 |
100 |
0.000 |
0.000 |
|
R2L |
1.421 |
0.000 |
0.00 |
98.579 |
0.000 |
|
PROBE |
0.414 |
0.092 |
2e-03 |
0.007 |
99.484 |
Table 4. Performance comparison of proposed Algorithm
|
Method |
Norma l |
DOS |
PROB E |
U2R |
R2L |
|
PNRule [1] |
99.5 |
96.9 |
73.2 |
06.6 |
10.7 |
|
PSM & SVM [2] |
99.8 |
97.9 |
98.6 |
68.9 |
19.5 |
|
CSFDTM [3] |
99.2 |
100 |
71.4 |
84.4 |
99.5 |
|
NB-DT [4] |
96.64 |
96.38 |
78.18 |
11.84 |
7.11 |
|
ADWICE [5] |
97 |
99 |
99 |
92 |
31 |
|
PCA-SVM [7] |
99.80 |
92.50 |
98.30 |
05.10 |
70.20 |
|
GP Multitransformation [8] |
99.93 |
98.81 |
97.29 |
45.20 |
80.22 |
|
WANBT [9] |
99.93 |
99.91 |
99.84 |
99.47 |
99.63 |
|
SVM+DGSOFT [11] |
95 |
97 |
91 |
23 |
43 |
|
MCAD [12] |
95.20 |
99.20 |
97.00 |
72.80 |
69.20 |
|
M.C.S. [16] |
97.40 |
83.80 |
32.80 |
10.70 |
|
|
KDD cup 99 winner [16] |
99.50 |
97.10 |
83.30 |
13.20 |
08.40 |
|
Multi-C. [19] |
97.30 |
88.70 |
29.80 |
09.60 |
|
|
GDA+ANN [20] |
98.95 |
98.63 |
96.25 |
24.12 |
12.08 |
|
GDA+C4.5 [20] |
99.68 |
98.60 |
99.61 |
57.01 |
66.25 |
|
NNC+GDA [21] |
98.75 |
98.63 |
96.50 |
24.12 |
12.08 |
|
I.C.A. [24] |
69.6 |
98.0 |
100 |
71.4 |
99.2 |
|
Parzen-window. [25] |
97.38 |
96.71 |
99.17 |
93.57 |
31.17 |
|
Proposed method |
99.81 |
99.997 |
99.48 |
100 |
98.58 |
This condensed representation allows comparing obtained results with those presented in related works using the same data set. Conditional distributions are on rows. For example the first row means that normal behavior is identified as normal with estimate probability 0.99810 (True Negatives). It is identified as DOS behavior with estimated probability 0.00102, as U2R behavior with estimated probability 0.00009, as R2L behavior with estimated probability 0.00049 and as PROBE behavior with estimated probability 0.0003. Last four identifications are denoted “false positives”. From second to fifth rows, in table 3, when behavior is identified as NORMAL it is denoted “false negative” else it is denoted “true positive”.
In order to evaluate the performances of this method, results obtained by the proposed approach are compared with those presented in some related works using the same data set (Table 4).
Table 4 compares the performance results obtained using the proposed algorithm with those of 18 other models. Table 4 shows that all approaches have good performance to detect Normal and DOS behaviors, however for PROBE, U2R and R2L the models show considerable variations upon their accuracy detection.
As shown in the table, the proposed method has good performances; no other model offers better performance results. One quickly notices that proposed approach and that of [9] are the only ones who exceed 98.5% of accuracy for the five studied categories of behaviors. More, a comparison of the performances indicates that our approach has similar performances to those in [9]. However this last approach uses a hybrid learning algorithm for adaptive network intrusion detection using naive Bayesian classifier and a decision tree algorithm (ID3). As our approach is a single model, we expect that our method can be substantially improved by hybridization.
Moreover, restricted only to anomaly detection, the proposed approach exceeds 99.99% of a detection rate for known anomalies.
-
VI. Conclusion
The fact to consider that class behavior can have a multi-connected representation enabled us to build a framework which allows a high average detection rates and low rates for both false negatives and false positives. This novel approach is flexible and lets to combine advantages of anomaly and misuse detections together. It has the advantage to be quickly and easily implemented and updated. Assuming the non-connectedness of the behavior representations, results of our single model are competitive with those of the best hybrid models as shown in table 4. So, we conjecture that our method can be significantly improved by hybridization.
For example, when some natural classes aren’t convex, the use of Mahalanobis metric becomes inappropriate, so another metrics can be exploited to maintain or ameliorate the performances of the proposed approach.
In future work, we will use parallel algorithms to make the intrusion detection system faster.
Acknowledgment
This work was supported in part by a grant from DGRSDT, Algiers (Project: “Data mining and applications”).
References Intrusion Detection with Multi-Connected Representation
- R. Agarwal and M. V. Joshi, PNrule: A new framework for learning classifier models in data mining, Technical TR 00-015, Department of Computer Science, University of Minnesota, 2000.
- E. Al Daoud. Intrusion Detection Using a New Particle Swarm Method and Support Vector Machines. World Academy of Science, Engineering and Technology, 2013. 77, 59-62.
- V. Barot, S.S. Chauhan and B. Patel. Feature Selection for Modeling Intrusion Detection. International Journal of Computer Network and Information Security (IJCNIS), 2014. 6(7), 56-62.
- N. Ben Amor, S. Benferhat and Z. Elouedi. Naive Bayes vs decision trees Intrusion Detection Systems. In Proceeding ACM Symposium on Applied Computing, Nicosia, Cyprus. 2004.
- K. Burbeck and S. Nadjm-Tehrani. ADWICE - anomaly detection with real-time incremental clustering, In Park, C.-s., Chee, S. (eds.) ICISC 2004. Springer 2005. LNCS, 3506, 407-424.
- D.E. Denning "An Intrusion-Detection Model", IEEE transactions on software engineering, 1987, SE-13(2), 222-232.
- H.F. Eid, A. Darwish, A.E. Hassanien, A. Abraham. Principle components analysis and support vector machine based intrusion detection system, In 10th international conference on intelligent systems design and applications (ISDA), Cairo, Egypt, 2010. 363-367.
- K.M. Faraoun, and A. Boukelif. Securing network traffic using genetically evolved transformations, Malaysian Journal of Computer Science, 2006. 19(1), 9-28.
- D.W. Farid, J. Darmont, and M.R. Zahidur. Attribute Weighting with Adaptive NBTree for Reducing False Positives in Intrusion Detection. International Journal of Computer Science and Information Security (IJCSIS), 2010. 8 (1), 19-26.
- KDD99 Dataset. from http://www.ll.mit.edu/mission/communications/ist/corpora/ideval/data/, 1999.
- L. Khan, M. Awad & B. Thuraisingham. A new intrusion detection system using support vector machines and hierarchical clustering, The VLDB Journal, 2007. 16, 507-521.
- S. Kumar, S. Kumar and N. Sukumar. Multidensity Clustering Algorithm for Anomaly Detection Using KDD'99 Data set. A. Abraham et al. (Eds.) Springer, ACC 2011, Part I, CCIS 190, 619-630.
- R. Lippmann, J.W. Haines, J.D., Fried, J. Korba, K. Das. The 1999 DARPA off-line intrusion detection evaluation. Computer Networks: The International Journal of Computer and Telecommunications Networking, 2000. 34(4), 579-595.
- G. J. McLachlan "Classification and mixture ML approaches to cluster analysis." Handbook of Statistics, 1982. 2, 199-208.
- B. Mukherjee, L.T. Heberlein, K.N. Levitt "Network Intrusion Detection" IEEE Network, 1994. 8(3), pp. 26-41.
- H.A. Nguyen and D. Choi. « Application of Data Mining to Network Intrusion Detection: Classifier Selection Model. » Y. Ma, D.Choi, and S. Ata (Eds.), Springer : APNOMS 2008. LNCS 5297, 399-408.
- R Core Team. R: A language and environment for statistical computing. R Foundation for Statistical Computing, Vienna, Austria. URL http://www.R-project.org/, 2015.
- S. Rastegari, P. Hingston and C.-P. Lam. Evolving statistical rule sets for network intrusion detection. Applied Soft Computing, 2015. 33, 348-359.
- M. Sabhnani and G. Serpen. Application of Machine Learning Algorithms to KDD Intrusion Detection Data set within Misuse Detection Context. In Proceedings of the International Conference on Machine Learning, Models, Technologies and Applications (MLMTA), 2003.1, 209-215.
- S. Singh, S. Silakari. Generalized Discriminant Analysis algorithm for feature reduction in Cyber Attack Detection System, International Journal of Computer Science and Information Security, 2009. 6(1), 173-180.
- M.-Y. Su. Real-time anomaly detection systems for Denial of Service attacks by weighted k-nearest-neighbor classifiers, Expert Systems with Applications, 2011. 38, 3492-3498.
- A. Tesfahun, D. L. Bhaskari. Effective hybrid Intrusion Detection System: A Layered Approach. International Journal of Computer Network and Information Security (IJCNIS), 2015. 7(3), 35-41.
- S.X. Wu, W. Banzhaf. The use of computational intelligence in intrusion detection systems: A review. Applied Soft Computing, 2010. 10, 1-35.
- D. Yang and H. Qi. A Network Intrusion Detection Method using Independent Component Analysis, In 19th International Conference on Pattern Recognition, 2008.
- D.-Y. Yeung & C. Chow. Parzen-window Network Intrusion Detectors. In: 16th International Conference on Pattern Recognition, Quebec, Canada, 2002. 11-15.
