Inversion and Feedback Research on the Temperature Control and Crack Prevention for Concrete Crane Beam on Rock Wall

Author: Yang Zhang, Sheng Qiang
Journal: International Journal of Image, Graphics and Signal Processing(IJIGSP) @ijigsp
Article in issue: 1 vol.3, 2011.
Free access
Concrete crane beam on a rock wall on a new structure used in underground building has become more common in recent year. But the concrete beam cracking problem always perplexes scientists and engineers. In order to solve this, the construction information inversion and feedback analysis method is applied. A beam section was taken as a prototype experiment. The temperature and construction data was collected to inverse some necessary thermal parameters. According to the characteristics of concrete temperature field, the basic accelerating genetic algorithm was improved. The improved accelerating genetic algorithm has the merits of high precision and fast calculation. With this algorithm, the calculation temperature and measured value are very close, which shows the method is efficiency. Then inversed parameters were applied in the feedback simulation. According to the simulation results, the proper temperature control method was suggested. By this way, the concrete temperature was controlled well and the beams appear no crack in recent two year. The successful application shows that the inversion and feedback analysis of concrete temperature field can reflect the factual performance of concrete and give important direction to engineering construction.
Inversion, genetic algorithm, feedback analysis, crane beam on rock wall, temperature field
Short address: https://sciup.org/15012081
IDR: 15012081
Text of the scientific article Inversion and Feedback Research on the Temperature Control and Crack Prevention for Concrete Crane Beam on Rock Wall
Published Online February 2011 in MECS
The numerical simulation of temperature field and stress field of concrete structure is influenced by many factors, which include the material heat parameters at construction site. The temperature conductivity, thermal conductivity, surface heat transfer coefficient and adiabatic temperature of different concrete are not same. Even the same concrete in different circumstance including different air temperature, humidity, wind etc, will make some thermal parameters various. And some parameters are various with time, especially in concrete early age [1], which should be described by functions. An
Manuscript received March 5, 2011; revised March 26, 2011; accepted April 1, 2011.
Corresponding author: Sheng Qiang inaccurate parameter or functions may cause wrong results in numerical calculation for concrete temperature field which may induce improper construction measures and dangerous crack.
In the past years, temperature control for mass concrete structure such as concrete dam is emphasized enough [2]. In fact the common concrete structure also has the temperature stress problem which can be found from the high frequent appearing of concrete cracking.
Concrete crane beam on rock wall is used widely in underground structure in recent years. But the crack in concrete beam is always a problem for designer and constructor. Decreasing the length of beam is an efficient way to decrease the probability of cracking. But in some engineering, the cracks still appear even the beam length is very short. In fact, thermal stress is a very important potential reason to the crack [3]. To research such problem, the factual thermal parameters are important. In order to reflect the true temperature field and stress field of concrete crane beam, it is very necessary to get the accurate thermal parameters by site measuring temperature and back analysis [4]-[5]. In the research, the improved accelerating genetic algorithm (GA) is applied in the back analysis.
-
II. I MPROVEMENT OF ACCELERATING GENETIC
ALGORITHM
Comparing with the basic GA, the evolution iteration velocity and efficiency of the accelerating GA has been increased. But the low capability of local search and premature convergence problem of the algorithm has not been solved radically. Besides, the problem of depositing excellent solutions has not solved by whether the basic GA or accelerating GA. Therefore the improved accelerating GA is proposed [6]-[7]. The core of the improved algorithm is at two points. The first point is to classify chromosomes according to sufficiency. The chromosome is divided into best chromosome, middle chromosome and worst chromosome in the proportion of x1, x2 and x3. Here there is x1+x2+x3=1. Usually x1 is less than 5%, x2 is less than 85%, x3 is less than 10%. Their value is relation to the evolutionary generation l.
The best chromosome is copied directly, the middle chromosome participates the cross operation, the worst chromosome participates the mutation operation. Then the quasi progeny population is generated. The point is to solve the problem of depositing excellent solutions and improve the local search capability. The second point is to introducing the niche elimination operation. It is to unite the quasi progeny population and the first NR individuals which are remembered before the classifying operation, then the paired Hamming distance of the new population are compared. Let NT=NR+n. Define the Hamming distance as:
the spatial domain discrete and the time domain differential for (3). Then the finite element recurrence equation of backward difference for temperature field can be obtained:
m
■ , =| V - ■ = 2 vk - ■ ) 2
i = 1,2,..., NT - 1; j = i + 1,..., NT (1)
Suppose
S
is the control threshold value. If
S
ij
compare the value of individual sufficiency between {
V
i
,V
j
}. The individual of less sufficiency is given a greater penalty function to decrease its sufficiency furthest. Thus the elimination rate of the punished individual is great in the evolution course. Then the population variety is kept and the premature convergence is removed.
Otherwise, the common judge condition of the population convergence is improved. Suppose the object function value of the first NS individuals (usually NS =(5~10 % ) - n) after the operation of the th and (l+1) h generation and sorted from superiority to inferiority are separately fl , f /,..., f N and f . 1 + 1, f l + 1,..., f ™. Record
I [ H ] + -^[ R ] I {T n +1 } - -^[ R ]{ T „ } + { F n +1 } = 0 (4)
I A tn J A tn in which, [H] is heat conductivity matrix; [R] is heat conductivity supplementary matrix; {Tn} and {Tn+1} are node temperature array; {Fn+1} is node temperature load array; n is time step ordinal number; Atn is time step length. According to recurrence (4), the node temperature {Tn+1} of next time step can be derived from the known current node temperature {Tn } .
In which:
~
f 1 =
NS
~~
EPS = n 1 f 1 + n 2 f ,
• f 1
l +1
NS
-2
■ =1
l +1 fj
To control the temperature in concrete, pipe cooling are widely used, such as in the structure of nuclear power plants [9]-[10], and in civil building concrete structure for air-conditioning or other purposes [11]-[13]. But the unsteady temperature field including cooling pipe is always a hard problem to simulate.
Three-dimensional (3D) finite element method is a powerful measure to solve this problem, and has been studied for a long time. Early studies, such as pseudo 3D and 3D finite element methods, were developed and used for a long time[14]-[15]. However, the pseudo 3D method was converted from a simple two-dimensional (2D) analysis method and cannot correctly apply boundary conditions for the atmosphere and cooling water convection.
NS f- = 2(fj +1 j=1
^^^^^^B
fl tf, *1
n 1 — the control coefficient of premature convergence index for the same generation population;
n 2 — the control coefficient of evolution convergence for the different generation population.
Then, some calculation methods based on heat transfer by heat balance principle is developed, such as Jin Keun Kim method [16]. The water temperature distribution along the pipe can be calculated using these methods, and the boundary conditions of the atmosphere can also be applied. However, the temperature gradient properties are simplified. Also based on the heat balance principle, an explicit iterative algorithm was developed solve it [17][18], which will be applied in the inversion and simulation for the crane beam.
III. T HE P RINCIPLE OF F INITE E LEMENT M ETHOD FOR T HREE D IMENSIONAL U NSTEADY T EMPERATURE F IELD
According to the heat balance principle, at the arbitrary point in the calculation area R, an unsteady temperature field T ( x , y , z , t ) must satisfy the following heat
A typical concrete block section containing a cooling pipe, as shown in figure 1, can be described by some cube finite elements around the pipe. Every surrounding element has a free face towards the pipe, as shown in figure 2, which is the third boundary condition in thermal calculation to simulate the heat exchange between cooling water and concrete.
transfer equation:
д T ( d 2 T d 2 T d 2 T ) д0
= a 2"" +2"" +2"" I + дt ^5x2 дy2 дz2 J дт
In which, T is temperature (° C ); a is temperature conductivity coefficient (m2/h); 0 is adiabatic temperature of concrete (° C ); t is time (d); т is concrete age (d).
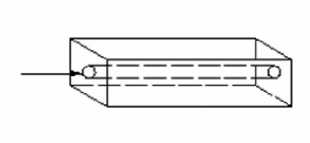
Figure 1. Sketch of pipe cooling in concrete
When finite element method is used to solve a temperature field, variation principle is applied to make
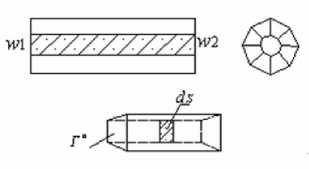
Figure 2. Heat exchange faces
IV. E NGINEERING A PPLICATION
A. Computation Parameter and Condition
A crane beam on rock wall is usually in a rock cavern. The rock is the base of the crane beam. The parameter of the rock is also important in calculation. According to detecting and test, the thermal parameters of the rock are gained, seen in table I.
By studying the heat exchange between water and concrete, the heat transfer through the pipe surface within time dt can be expressed as:
where λ is the thermal conductivity of the concrete, Γ0 is the interface between the concrete and pipe, and n is the interface normal vector.
The heat absorbed by water flowing through the section of pipe within time dt is
dQ1 = cwρwΔTwqwdt (6)
where c w , ρ w and q w stand for the specific heat, density of water and flux, respectively, and ΔT w is the water temperature difference between the inlet and outlet of the pipe section.
Given that the volume of the pipe is very small, and the water body heat increment in the pipe section can be neglected. From (5), (6), the water temperature increment within the pipe section can be found:
AT wi
-λ cwρwqw
∫∫
Γ 0 ∂ n

Because the inlet water temperature is known, the water temperature at any pipe section along the pipe can be calculated step by step. If there is a water pipe divided into several pipe sections and the water temperature increment of one pipe section is ΔT wj and the inlet water temperature is T w0 , then,
i
T wi = T w 0 + ∑ Δ T wj (8)
j = 1
Because the unknown temperature gradient on the interface between the concrete and pipe affects the water temperature distribution along the pipe, it is a nonlinearity problem of the boundary conditions and cannot be solved directly. Therefore, an iterative method should be used.
For the first iteration, the water temperature along water pipe is assumed equal to the inlet water temperature. The approximate solution of the temperature field can be calculated with (4). Then, the water temperature distribution along the water pipe can be calculated with (7) and (8). The process is then repeated until the water temperature distribution along the water pipe and the concrete temperature field reaches a steady-state solution.
TABLE I
T HERMAL PARAMETERS OF SURROUNDING ROCK
|
Rock type |
Heat conductivity λ ( kJ /( m ⋅ h ⋅ 0 C )) |
Specific heat c(kJ/(kg. ^ )) |
Linear Coefficient (10 ' 5 / ^ ) |
Temperature conductivity a (m2/h) |
|
Basalt |
7.8372 |
0.886 |
0.68 |
0.0032165 |
The merit of a crane beam on rock wall is saving the concrete pillar. But at the same time, extra long bolt must be applied in the beam and rock wall. The length of bolt is about 8~12m, the horizontal space between two bolts is about 0.7m. Because the number of bots and its function on load which influences the stress in beam evidently, the bolts should be considered in numerical calculation. Bolt is man-made homogeneous material. It is simple to get its thermal parameters, seen in table II.
T ABLE II
T HERMAL PARAMETERS OF BOLT
|
Bolt Type |
Heat conductivity λ ( kJ /( m ⋅ h ⋅ 0 C )) |
Specific heat c(kJ/(kg. ^ )) |
Linear Coefficient (10 ' 5 / ^ ) |
Temperature conductivity a (m2/h) |
|
40Si 2 MnV |
163.29 |
0.46 |
1.65 |
0.04522 |
Concrete thermal parameters are the most important parameters in the temperature field simulation. Because part of the thermal parameters that will not change in construction and running, can be gained by experiment in lab [8], such as the parameters shown in table III. Some other parameters are necessary to be inversed, such as boundary conditions.
T ABLE III
P ARTS OF T HERMAL PARAMETERS OF CONCRETE
|
Heat conductivity λ ( kJ /( m ⋅ h ⋅ 0 C )) |
Specific heat c(kJ/(kg. ^ )) |
Linear Coefficient (10 ' 5 / ^ ) |
Temperature conductivity a (m2/h) |
|
9.6868 |
0.874 |
0.85 |
0.00434 |
B. The Prototype Experiment
The first built crane beam is taken as the prototype experiment. Some temperature sensors are set in it before concrete pouring. Once the beam concrete is poured, temperature measuring work begins. The external factors, such as pouring temperature, pipe cooling course, air temperature, surface covering condition, etc, should be also recorded during all the measuring work. Figure 3 shows the excavated rock wall before the crane beam is poured. Figure 4 shows the crane beam in construction. The beam segment in the picture left half has been poured and is protected by form board. The picture right half in figure 4 shows other beam segments which are just steel reinforcement cages. The white line is the cooling water
transit pipe from a pool. Figure 5 shows the form board which is named VISA mould. The mould will keep the surface of concrete smooth and compact. It can also provide some insulation effect, so it is an important boundary condition in the numerical simulation, which should be inversed correctly.
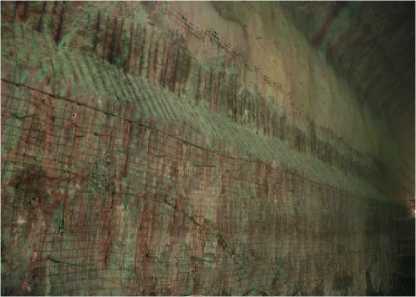
Figure 3. Rock wall before beam built
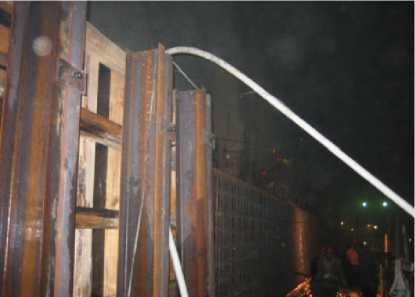
Figure 4. Crane beam on rock wall in construction
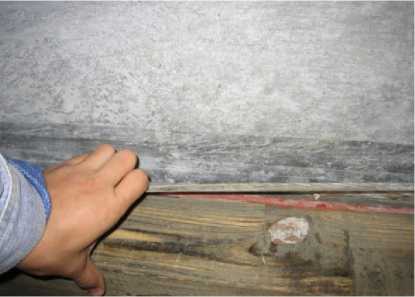
Figure 5. VISA mould of the crane beam
There are always some errors in the recorded data because of human or machine. All the data should be analyzed and the unreasonable data must be eliminated before they are used in the inversion.
-
C. The Mesh for Inversion and the Sensor Location
Figure 6 shows the whole finite element mesh for inversion, which includes part of surrounding rock, one segment of crane beam, bolts in rock wall and beam. The whole mesh includes 35784 nodes and 32411 elements. To simulate the factual situation, cooling pipe is also
disposed in the mesh. The pipe cooling course will be calculated with the explicit pipe model. The bolt layout and the pipe layout with their grid are shown in figure 7 and figure 8 separately. The calculation time step length is same as the interval of measuring. The air temperature, pipe inlet water temperature, water flux are same as the measured value.
The sensors are set at the center section location. The location of five sensors is shown in figure 9. The inner sensors are N1, N2 and N3. Sensor D4 and C5 are used to measure the temperature near concrete surface. D4 is 5cm to the beam top and C5 is 5cm to the beam side.
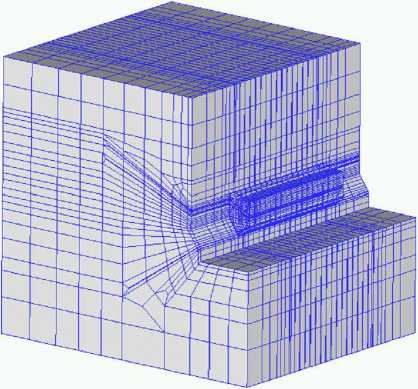
Figure 6. Finite element mesh for inversion
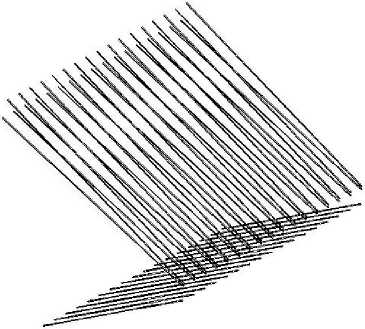
Figure 7. Bolt layout in beam
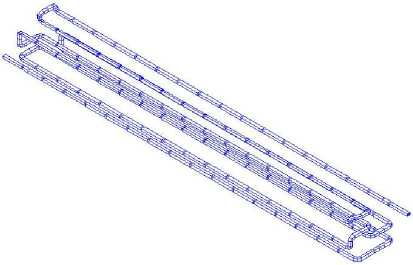
Figure 8. Pipe layout and its gird in beam
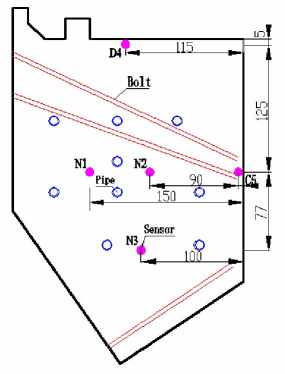
Figure 9. Sensor location on beam section
-
D. Experiment and Inversion Results Analysis
The measured data is input as known condition in the inversion program. After many times optimization, the best parameters are gained as follows.
Concrete adiabatic temperature: θ 0 = 40.00 ℃
Concrete adiabatic temperature curve: θ = 40.00 × (1 - e - 0.60 τ 1.02) ℃
Heat transfer coefficient of form board: в1 =9.18 kJ (m'jrX)
Heat transfer coefficient of wet felt: в2 =22.61 kJ/(m2-h-C)
Heat transfer coefficient of pipe wall: в3 = 45.42 kJ/(m2-h-C)
Heat transfer coefficient of uncovered concrete: в4 = 32.37 kJ/(m2-h-C)
Based on the site application of the temperature control method, comparing the inversed results with measured data, the following recognition can be gained.
-
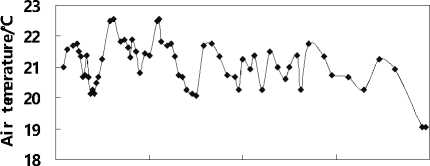
(1) From the air temperature curve in cavern (figure 10), the maximum air temperature is 22.69 ℃ , minimum air temperature is 19.06 ℃ during the first 8 days age. And the maximum air temperature difference in one day is only 2.50 ℃ . It explains why there is no greater wave on the temperature curves of surface sensor D4 and C5. Another way, the day and night temperature difference in c
02468 Time/d
Figure 10. Air temperature curve in cavern
-
(2) The beginning time of pipe cooling is late in the prototype experiment. The cooling start at the 14th hour after the concrete poured. Seen from figure 11, the maximum water temperature difference between pipe inlet and outlet is 12.80 ℃ . It is a too high value. Because in the first 14 hours, concrete hydration reaction is taking place rapidly while no pipe cooling is working. When the pipe starts cooling, much heat quantity has gathered inside the concrete beam. After the temperature peak in concrete, the water temperature difference between pipe inlet and outlet decreases and becomes stable. The inversion results also show such rule.
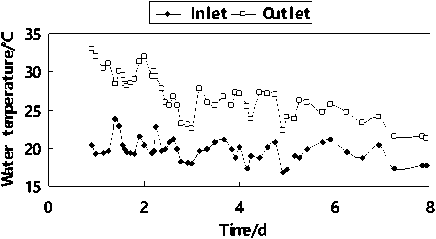
Figure 11. Water temperature curves of cooling pipe inlet and outlet
-
(3) Figure 12~16 show the measured and calculated temperature curves of different sensors. The calculated data is gained on the base of inversed parameter. Most of the data fits well which reflects the inversed parameters are reliable and can be applied in the future concrete temperature forecast and control of the crane beam.
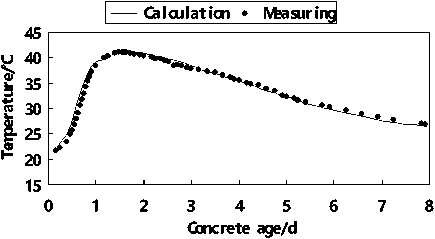
Figure 12. Measured and calculated temperature curves of sensor N1
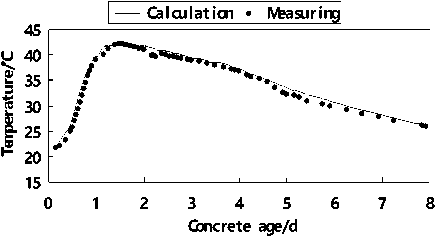
Figure 13. Measured and calculated temperature curves of sensor N2
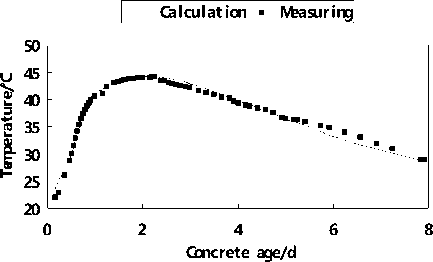
Figure 14. Measured and calculated temperature curves of sensor N3
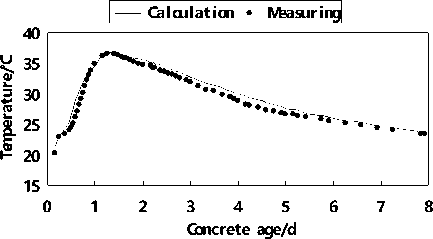
Figure 15. Measured and calculated temperature curves of sensor D4
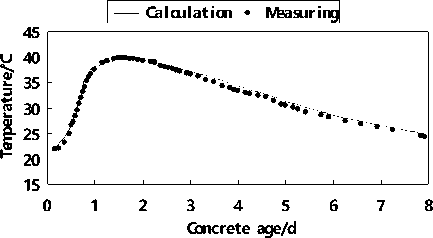
Figure 16. Measured and calculated temperature curves of sensor C5
-
(4) Under the situation of lack of test data, some thermal parameters can be gained by inversion calculation. It shows adequately the importance and necessity of concrete thermal parameter inversion.
-
E. Feedback Analysis of the Crane Beam
-
20.0O C . The water cooling begins after the pouring with the water temperature of 13.0O C and the flux of 3.00m3/h. The cooling keeps 7 days and the water direction is changed every 12 hours. The mould and felt is removed at the age of 14th day.
The feedback calculation is applied for the beam constructed later on the base of inversion. According to the site situation in the first several months, it was found that the factual pouring temperature and cooling water temperature is relative steady. So their sensitive analysis is not necessary to carry out. In the following simulation cases, the duration time of surface preservation is researched.
At first the calculation conditions are presented.
As for case 1, the thermal parameters of concrete are same as the inversion calculation. The wet felt on the top of beam is also simulated. The pouring temperature is
As for case 2, the mould and felt is removed at the age of 7th day. The other calculation situation is same as case 1.
As for case 3, the mould and felt is removed at the age of 30th day. The other calculation situation is same as case 1.
From the calculation result of case 1, the top temperature of point N1, N2 and N3 is 33.47 ^ , 35.09° C , 36.02° C , and the occur time is the 1.75th day, the 2.00th day, the 2.00th day separately. The temperature curve of N3 is shown in figure 17. The internal max tension stress never exceeds the allowable tensile strength. For example, the max tension stress of point N3 is 1.16MPa occurred at the 60th day, which is not more than the allowable tensile strength of 1.25MPa, as shown in figure 18. The line in figure 18 with the sign of 2.0 σ ais the allowable tensile strength curve with a safety factor of 2.0. In the next stress curve figures, the sign is the same meaning. From figure 18, it is obviously that the surface stress always keeps lower than the allowable tensile strength.
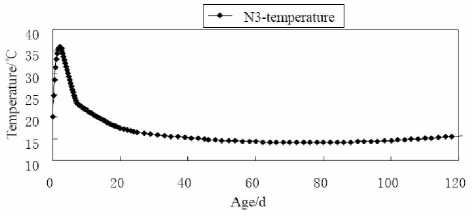
Figure 17. Temperature curve of inside point N3 in case 1
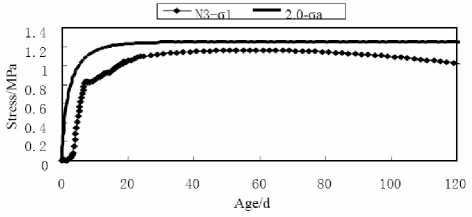
Figure 18. First principle stress σ 1 curve of inside point N3 in case 1
Figure 19 shows the temperature comparison curves of top face point D4 calculated in case 2 and case 3. Figure 20 shows the first principle stress comparison curves of top face point D4 calculated in case 2 and case 3, including the allowable stress curve. Figure 21 shows the temperature comparison curves of side face point C5 calculated in case 2 and case 3. Figure 22 shows the first principle stress comparison curves of side face point C5 calculated in case 2 and case 3, including the allowable stress curve.
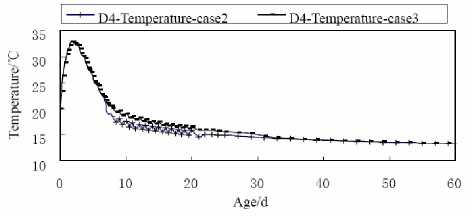
Figure 19. Temperature curves of D4 in case 2 and case 3
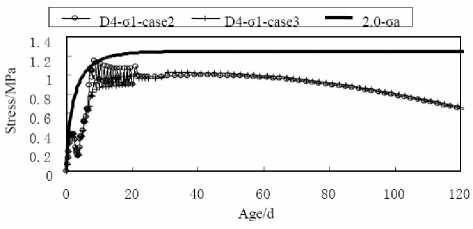
Figure 20. First principle stress σ 1 curves of D4 in case 2 and case 3
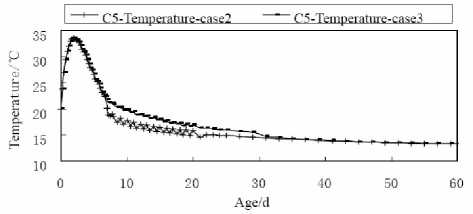
Figure 21. Temperature curves of C5 in case 2 and case 3
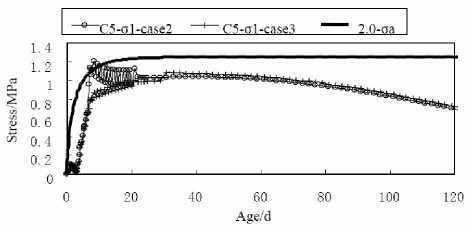
Figure 22. First principle stress σ 1 curves of C5 in case 2 and case 3
From the calculation result of case 2, the max internal temperature and stress do not change obviously contrasting with case 1. But the surface temperature and stress change much. When the covering materials are removed at the 7th day, surface temperature decreases suddenly. It changes from 22.17X to 18.93OC in only 0.5d. After the removal, surface temperature waves apparently with the day and night air temperature difference. The surface tension stress increases suddenly form 0.63MPa at the 7th day to 1.06MPa at the 7.5th day. The value is near the current allowable tensile strength 1.09MPa. Then the stress keeps rising as the temperature decreasing until it reaches 1.15MPa at the 8.5th day which exceeds the current allowable tensile strength 1.12MPa. After the top value, the stress goes down because the temperature difference between internal and surface becomes less. In the later age, the surface tension stress keeps lower than the allowable tensile strength.
From the calculation result of case 3, the temperature decreasing amplitude is less when removal occurred at the 30th day, which is only 0.5o C in 1.0d. Wherever the top face or the side face, the surface tension stress can always satisfy the allowable tensile strength.
Because the heat exchange coefficient of side face is lower than the top face, the removal of covering materials makes more influence to the side face temperature and stress, especially removing at 7th day. The temperature decreasing amplitude of side face point C5 drops is 3.60o C in 0.5d after the removal and the corresponding stress increases from 0.65MPa to 1.12MPa, which exceeds the current allowable tensile strength. In the later 2 days, the stress keeps raising to 1.20MPa, which is still more than the allowable tensile strength. While the temperature and stress does not change suddenly if the removal occurs at 30th day, and the stress does not exceed the allowable tensile strength in the whole construction time.
The above analysis shows that the preservation material and covering time have much influence on the concrete surface temperature and stress. As for the preservation material with lower heat exchange coefficient, the removal time should be later.
At the same time, the extent and time of surface preservation also depend on the extent and time of water cooling. If the extent of water cooling at early age is more, the surface covering removal can be earlier. Judging from the site situation, the pipe input water temperature is not controlled strictly, and parts of the pipe linker have water leakage which leads to the flux unsteady. Under such situation, the surface covering time can not be shortened. It should be more than 14.0d.
-
V. C ONCLUSIONS
The prototype experiment of concrete crane beam on rock wall is carried out to get the temperature of different points inside the beam. Then the improved accelerating genetic algorithm and temperature field finite element program are applied to inverse some important thermal parameters of concrete. Comparing the measured data with calculated data, they are very close. It shows the inversion method is effective. The inversed parameters are applied in the feedback simulation. According to the simulation results, the proper temperature control method is suggested. On the base of above research working, the following conclusions are drawn.
-
(1) The prototype experiment for concrete temperature is simple and feasible, which can be easily operated. The experiment results can satisfy the feedback analysis calculation and engineering construction.
-
(2) The back analysis and simulation in construction is a gradually optimizing course. It can reflect the factual performance of concrete and give important direction to engineering construction.
-
(3) In the inversion of concrete thermal parameters course, the improved accelerating genetic algorithm has the merits of high precision and fast calculation. It overcomes the shortage of traditional optimization method, most of which show a series deceleration when the inversion parameters become more, easily fall into the local extreme value, be hard to converge because of error transfer. It is worthy to be applied widely in civil engineering.
-
(4) The feedback analysis shows that the preservation material and covering time have much influence on the concrete surface temperature and stress. As for the preservation material with lower heat exchange coefficient, the removal time should be later.
-
(5) The extent and time of surface preservation is related to the extent and time of water cooling. If the extent of water cooling at early age is more, the surface covering removal can be earlier.
A CKNOWLEDGMENT
The authors wish to thank S. K. Chen, L. Guo, Z. Q. Xie, M. D. Zhu. This work was supported in part by a grant from Wuhan University Open Research Fund Program of State Key Laboratory of Water Resources and Hydropower Engineering Science (No. 2009 B060).
References Inversion and Feedback Research on the Temperature Control and Crack Prevention for Concrete Crane Beam on Rock Wall
- J H Hattel, J A Thorborg. “A numerical model for predicting the thermo mechanical conditions during hydration of early-age concrete”. Applied Mathematical Modeling, vol. 27, pp. 1-26, 2003.
- S Qiang, Y M Zhu, Y L Zhao, H L Rao. “Study on concrete temperature control and crack prevention measures of Jinping I super high arch dam”. Proceedings of the 1st International Conference on Long Time Effects and Seepage Behavior of Dams. Vol. 1, pp. 564-568, May 2008.
- B F Zhu. Thermal Stresses and Temperature Control of Mass Concrete. Second ed. Beijing:China Electric Power Press, 1999, pp.8-17.
- G J Stolz. “Numerical solution to an ivnerse problem of heat conduction for simple shampes”. J. Heat Transfer, vol. 82(C), pp. 20-26, 1960.
- Y F Ma, Y M Zhu, Y Z Liu. “Feedback study of temperature control and crack prevention of Jiangtanghu pump concrete sluice during construction”. Water Power, vol. 32, pp. 33-35, January 2006.
- Y M Zhu, Y J Liu. “Determination of thermal parameters of concrete by reverse analysis of test results”. Chinese Journal of Geotechnical Engineering, vol. 24, pp. 175-177, February 2002.
- M Zhou, S D Sun. Principle and Application of Genetic Algorithm. Beijing: National Defence Industry Press, 2000, pp.4-7.
- R Kohn, M Vogelins. “Determining conductivity by boundary measurements”. Common Pure Appl. Math, vol. 137, pp. 289-298, March 1984.
- Dundulis G., Uspuras E. and et al. “Evaluation of pipe whip impacts on neighboring piping and walls of the Ignalina Nuclear Power Plant”, Nuclear Engineering and Design. Vol. 237, pp. 848–857, 2007.
- Silin N., Masson V.P. and et al. “Hydrodynamic transition delay in rectangular channels under high heat flux”, Annals of Nuclear Energy. Vol. 37, pp. 615–620. 2010.
- Koschenz M. and Dorer V. “Interaction of an air system with concrete core conditioning” Energy and Buildings. Vol. 30, pp. 139-145, 1999.
- Tan B.K., Wong T.N. and Ooi K.T. “A study of liquid flow in a flat plate heat pipe under localized heating”, International Journal of Thermal Sciences. Vol. 49, pp. 99-108, 2010.
- He J. and Hoyano A. “Experimental study of cooling effects of a passive evaporative cooling wall constructed of porous ceramics with high water soaking-up ability”, Building and Environment. Vol. 45, pp. 461–472, 2010.
- Kawaraba H., Kanokogi T., Tanabe T. “Development of the FEM program for the analysis of pipe cooling effects on the thermal stress of massive concrete”, Transactions of the Japan Concrete Institute. Vol. 8, pp. 125-130, 1986.
- Machida N, Uehara K. “Nonlinear thermal stress analysis of a massive concrete structure”, Computers & Structures. Vol. 26, pp. 287-296, 1987.
- Kim J.K., Kim K.H. and Yang J.H. “Thermal analysis of hydration heat in concrete structures with pipe-cooling system”, Computers & Structures. Vol. 79, pp. 163-167, 2001.
- Y M Zhu, J R He, Z Q Xiao. “Calculation and experimental comparison of temperature field of embedded cooling water pipes and their application”. Journal of Hohai University, vol. 31, pp. 626-630, June 2003.
- Y M Zhu, Z Q Xu, J R He. “A calculation method for solving temperature field of mass concrete with cooling pipes”. Journal of Yangtze River Scientific Research Institute. Vol. 20, pp. 19-22, February 2003.
