Investigating Factors that Influence Rice Yields of Bangladesh using Data Warehousing, Machine Learning, and Visualization

Author: Fahad Ahmed, Dip Nandi, Mashiour Rahman, Khandaker Tabin Hasan
Journal: International Journal of Modern Education and Computer Science (IJMECS) @ijmecs
Article in issue: 3 vol.9, 2017.
Free access
In this paper, we have tried to identify the prominent factors of Rice production of all the three seasons of the year (Aus, Aman, and Boro) by applying K-Means clustering on climate and soil variables' data warehoused using Fact Constellation schema. For the clustering, the popular machine-learning tool Weka was used whose visualization feature was principally useful to determine the patterns, dependencies, and relationships of rice yield on different climate and soil factors of rice production.
Fact Constellation, K-Means Clustering, Visualization, Elbow Method
Short address: https://sciup.org/15014953
IDR: 15014953
Text of the scientific article Investigating Factors that Influence Rice Yields of Bangladesh using Data Warehousing, Machine Learning, and Visualization
Published Online March 2017 in MECS DOI: 10.5815/ijmecs.2017.03.05
-
I. Introduction
Bangladesh is an agriculture-dependent country. A land area of 9.5 million hectares, which roughly constitutes of 65% of the total land available in this country, is used for agricultural purposes [1]. We produce a huge quantity of agricultural produce and rice being the staple diet of this country; we produce an average annual quantity of 35.8 metric tons [2]. Rice is world’s 3rd most important cereal crop, based on production volume [3] and is the prime agricultural produce of Bangladesh. In the Fiscal Year 2013-14, the government sanctioned 4.66 billion Taka as fertilizer subsidy and on an average more than 5% of a fiscal year’s total budget is allocated to the agricultural sector [5] and a survey in 2010 showed that about 47% of the country’s total employment is given by agriculture [5]. Clearly the outcome of this sector is of prime importance to government’s policy makers, the general population of the country and to those corporate giants as well who act as primary buyers of certain agricultural products and process them for reselling and other purposes for example entrepreneurs who process a particular type of rice and retail it as their own product, etc.
Since this sector of agricultural production has such importance it seems logical to investigate which of the input variables of rice production are responsible for its greater yield in any specific region for any given time of the year. This will have the following advantages:
-
i) The government will be able to identify how much each type of fertilizer will be required to be imported and where they need to be distributed and in what quantity
Reason: Different growing seasons of rice cultivation in different areas will require different types of fertilizers, some of which may not be produced locally and may be imported from other countries by the government [2]. Such imports are investments for obtaining better crop yields and being able to know the quantity and location of where a specific fertilizer is needed the most can dramatically influence the crop yields.
-
ii) The government will also be able to identify how much each type of fertilizer will be needed to be imported and where they need to be distributed and in what quantity
Reason: Different growing seasons of rice cultivation in different areas will require different types of fertilizers, some of which may not be produced locally and may be imported from other countries by the government [2]. Such imports are investments for obtaining better crop yields and being able to know the quantity and location of where a specific fertilizer is needed the most can dramatically influence the crop yields.
-
iii) Corporate giants may want to invest in agricultural infrastructure in areas with better yield of their crop of interest
Reason: Primary buyers, who are retailers of processed agricultural produce, will want to know where they might find a consistent and good quality supply of such ‘raw' crops so that they can become contractual buyers of those crops.
It is evident that determining the most significant factors of rice production will be greatly beneficial not only to the consumers of the crops but indirectly, also to the producers as well. The farmers often do not get the proper price for their hard work in the harvests because of the ‘middle-men’ who act as the connecting string between the root level producers of the crops and the potential buyers of bulk quantities of those crops. If such entrepreneurs could know which locations of rice productions have a greater impact on their annual rice yield based on controllable factors like use of fertilizers and other non-climatic factors, then they might want to invest in those areas.
This research tries to fill-in those gaps between producers and consumers so that both the parties can be benefitted. This paper conveys the findings in five sections. The first section, Introduction, works as the introduction to the research’s domain and establishes its significance. The second section, Related Works, explores the domain of rice production in Bangladesh and reconnoiters the different approaches commonly taken by other researchers to attain results similar to or within the domain of this research. This section also contains brief discussion on drawbacks of those approaches and what alternatives to them could be used. The third section, Proposed Methodology, portrays the proposed solution to the problem established in the first section, along with an elaborate discussion on how the data were pre-processed and then how they were analyzed. The fourth section, Results and Discussion, describes the findings from the third section and discusses them in light of the Related Works for each variety of rice. Finally, the fifth section, Conclusion, and Future Works, wraps up the research and critically discusses the findings along with providing other scopes of future works where the findings from this research may be applied directly to or implied in an ancillary form.
-
II. Related Works
In this section, we have dwelled within the realm of the past researches done on the domain of rice production both in the geo-climatic as well as the geo-chemical context of Bangladesh. We have critically discussed the methodologies used by the researchers and explored the alternatives of those methods for achieving the goals without having to face the drawbacks those researchers faced.
-
A. Background
In Bangladesh, rice is grown almost all year round in three distinct cultivating seasons, namely Aus (midMarch to mid-August), Aman (mid-June to November) and Boro (mid-December to mid-June) [7]. Since rice is the staple diet of the citizens of this country, there naturally has been a lot of research done to find out innovative ways of maximizing its yield. Several of these researches have tried to identify the prominent factors of rice production. It is from these researches that we came to know about the principle factors that have prominent effects on yields of not only rice but also on different varieties of rice, such as for Aman the prime influencing factors are Rainfall and Temperature but not directly proportional. After a ‘certain optimum value', any further increase of either of these factors will decrease crop growth, while Humidity has a positive effect on rice yield [12]. Whereas Sunlight hours and Temperature have a positive impact on boro rice yields [12]. In this research, the historical climate and soil data were analyzed using linear regression [12]. On the other hand, soil acidity has shown a positive relationship with rice yield in general [15]. This research used GIS (Geographic Information System) to interpolated data from different variables in order to obtain a pattern. Some of the researchers have also turned to complex modeling software named as DSSAT (Decision Support System for Agrotechnology Transfer) model [11].Other variations of regression like the panel regression that amalgamates all data into a single regression and cross-section models have been used to somewhat good affect [14].
-
B. Shortcomings of above-mentioned methods
-
i. Any regression based model would assume the linearity between dependent (crop yield) and independent (climate, soil, etc.) variables [10].
-
ii. Panel regression, as well as cross-section models, also suffers from the issue mentioned in the above point [14].
-
iii. Complicated crop production models such as the DSSAT need the input weather data on a resolution of daily observations. Such models can also have specific parameters for specific varieties of rice, which may give precise predictions but also increases the complexity of the analysis process as the one using the model would need to explicitly keep track of data of all types of crop varieties [11].
-
iv. Models like GIS that are heavily dependent on spatial dimension of a particular data set do have their own shortcomings [16]
-
C. An Alternative Approach
-
i. Data organized into a data warehouse through a fact constellation schema is by default normalized [9]. It will provide maximized transactional and query processing rates on data access. The window of opportunity also remains open if one is willing to create a predictive model on the data warehouse [20].
-
ii. Using Simple K-Means clustering on the data stored in the data warehouse will enable us to empirically classify the data points that exhibit similar characteristics. Unlike regression-based models, K-Means does not assume the linearity of data variables [16].
-
iii. K-Means also does not depend on the resolution of input data, only that all the factors’ data that are to be input need to be of the same resolution [16]. It will be easier to fit the data onto it than on a complicated model like the DSSAT.
-
iv. K-Means depend on neither the spatial nor the temporal dimensions of a dataset [16] and hence will not have the pitfalls of GIS.
-
v. K-Means is such a widely used and elegant algorithm that made open-source tools such as Weka has the algorithm built into it [17].
-
vi. Using Weka to perform clustering, we can not only cluster the data but also visualize it in many different and often very useful ways to extract maximum knowledge from the data points [17].
-
vii. Even though clustering is supposed to be unsupervised learning, Weka enables the use of machine learning by enabling its clustering algorithms to be trained by splitting the input data into training and test sets [17].
-
III. Proposed Methodology
In this section, we discussed the nature and the condition of the data to be analyzed that were collected from multiple sources, how it was pre-processed and finally how it was analyzed using the tools that were mentioned and discussed to be beneficial in the previous section.
-
A. Structure of Data Collected
Rice yield data was collected from BRRI (Bangladesh Rice Research Institute) and for some undisclosed reason, they could only provide us with yield data for rice in the three cultivation seasons of between the years 2011 to 2014. That too for the regions of Dhaka, Manikganj, and Tangail only. In addition to that, they do not record the yield from hybrid varieties of rice, hence the total yield amount of the local variety of was collected. Therefore, in order to widen the scope of analysis, yield data for the aforementioned rice categories for the years 2008, 2009, 2010 and 2015 were collected from yearbooks, publications etc. from BBS (Bangladesh Bureau of Statistics) [8]and historical data archives of different agricultural agencies. Data for climatic and soil variables could not be found from a single, unified source. Hence it had to be collected from multiple sources for the factors that were mentioned before to have a prolific impact on rice yields. The data for minimum and maximum temperature , rainfall , relative humidity, and sunshine hours were collected from BARC (Bangladesh Agricultural Research Council) and DAE (Department of Agricultural Extension), while the data for soil pH and soil mineral deficit were collected from SRDI (Soil Resource Development Institute), the latter being the indicator of how much mineral will be needed by the soil in the form of fertilizers, hence each deficit value will represent the amount of mineral supplied to the soil for producing a particular type of rice.
The climatic and soil variables’ data were collected in numeric form so as maintain the homogeneity in the ‘factors dataset’ that was being put together with the exception being that SRDI only records soil data in an interval of 8 years and the soil data collected was recorded for the year 2010, which meant between the years 2010 and 2015 the soil data would remain unchanged and hence its effect would not be observable through data analysis alone. On the other hand, the climatic data could be collected for each of the three aforementioned locations for each of the years (and in some instances for each month of the years) between 2008 and 2015. Therefore, henceforth the soil data was used as Spatial data while the climate data was used as Tempo-Spatial data.
-
B. Data Cleaning and Pre-processing
Since the rice yield data was obtained three specific locations and within the years 2008 to 2015, the records for the climate data with the matching tempo-spatial properties were kept and the others discarded in order to avoid missing value issues for rice yield once it was treated as an attribute. Similarly, the spatial soil data was cleaned of records that were not of those three locations. Specifically, data for the ‘soil mineral deficit’ was averaged for the different species of rice that are sown during each of the three seasons to obtain a location-wise value of deficit of each mineral for growing rice varieties of each particular season.
Once the cleaning was completed, those climate factors that had a higher resolution of data (i.e. monthly data for each year) had to be coarsened since the rice yield data was in the resolution of years. This was done by simply finding the average value for all the months of that year. This was done for the factors Rainfall, Relative Humidity and Sunshine Hours. While the temperature data had the appropriate, yearly resolution in order to maintain homogeneity, the average of the max and min temperatures were calculated. Since the rice yield data, mentioned above was of tempo-spatial in nature so the yield data had to be made into location wise averages for each type of rice, the rice type being the season when the rice was grown.
-
C. Analysis
With the homogenous data for the climate and soil variables along with rice yield, a data warehouse was created using a Fact Constellation schema, such as the one shown in Fig. 1. This kind of schema is used to design data warehouses with multiple fact tables [9, 13].The fact constellation that is shown before consists of ‘dimension tables' which held those quantities of the data set that are truly independent, such as Time and Location. Since the soil data is spatial and the climate data is tempo-spatial in nature and was obtained for each type of rice respectively, all of these factors had to represent in the data warehouse with respect to Time and/or Location and hence the climate data is put into fact tables that have a tempo-spatial structure such that when analyzed, each fact table will portray the relationship of the individual climate variables with that of the yield of a particular type of rice (that is either for Aus, Aman or Boro). Similarly for the soil data, the pH and mineral deficits for each mineral for each area for a particular type of rice has been put together in the soil_yield fact tables. In the fact tables the values of the foreign keys were treated as nominal values while the values for other attributes were used as numeric.
Once the data had been organized into the abovedescribed structure, the ‘facts' then had to be fed into the K-Means clustering algorithm in Weka. But before analyzing the clusters, it was needed to obtain a value for K or the deciding how many clusters would be sufficient to obtain a reliable clustering formation from the algorithm.
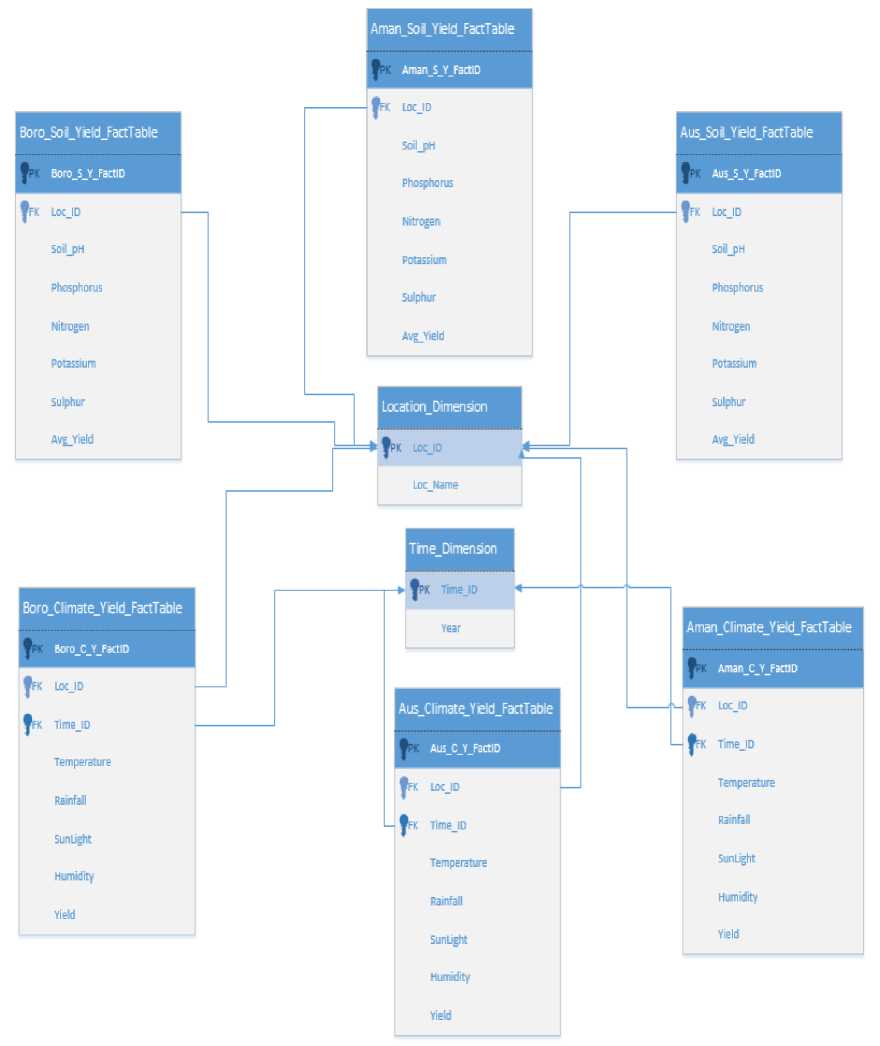
Fig.1. Fact Constellation Schema for the data warehouse
There are various methods of determining the value of K , one of those methods is known as the ‘elbow-method’, where the value of K is taken to be the number of clusters beyond which any further increase in K does not decrease the error present in the clustered instances.
This was simply found out by running the K-Means clustering on each of the fact tables and recording the
Sum of Square of Errors for each cluster set of clusters obtained after each run.
Then plotting the number of clusters in the x-axis and the latter in the y-axis showed us the point after which the error did not show any drastic change for an increase in the number of clusters. The results of the plots are shown in Fig.2 to 4.
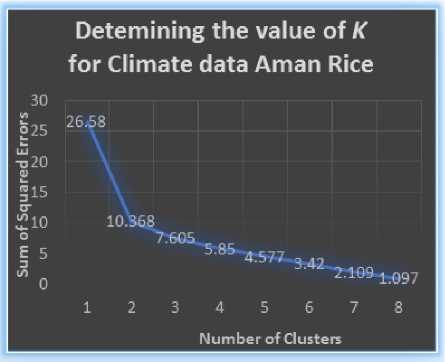
Fig.2. Identifying the ‘elbow point’ for the value of K for clustering for Climate data of Aman Rice
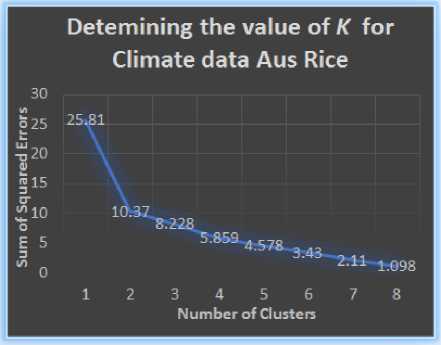
Fig.3.Identifying the ‘elbow point’ for the value of K for clustering for Climate data of Aus Rice
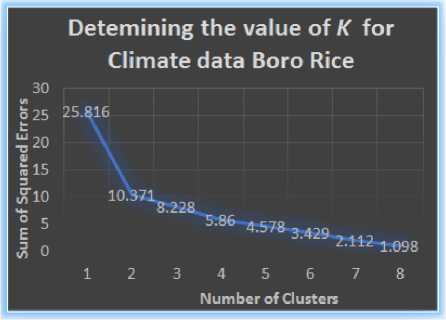
Fig.4.Identifying the ‘elbow point’ for the value of K for clustering for Climate data of Boro Rice
From the Fig. 2 to 4 we can see that for each of the plots, the graph shows a significant bending for K =2, hence the elbow point was taken as K =2. For the soil_yield fact tables, each fact table average locationwise yield data and since there were only three locations whose yield data could be collected, there would only be three rows in each of the fact tables. So using the elbow method to obtain the value of K would be trivial. Value for K =2 was also taken for clustering the soil_yield facts.
With the value of K now determined, each of the fact tables was clustered and their clusters were visualized using Weka's built-in visualization tool. For the climate_yield fact tables’ 40% data points were used to train the clustering algorithm and use the rest of the 60% of the data points to test as well as for creating clusters. The results of the visualizations were as follows.
-
i. For AmanRice :
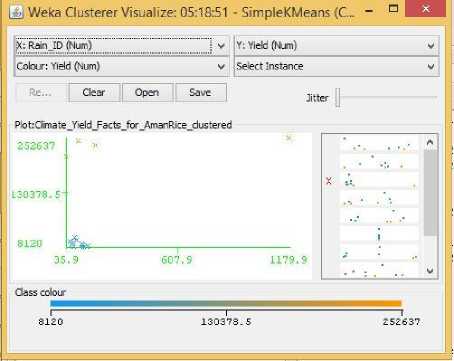
Fig.5. Rainfall Vs Yield Cluster Visualization

Fig.6. Temperature Vs Yield Cluster Visualization
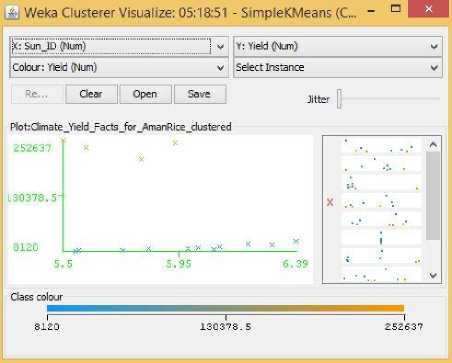
Fig.7. Sunlight Hours Vs Yield Cluster Visualization

Fig.8. Humidity Vs Yield Cluster Visualization
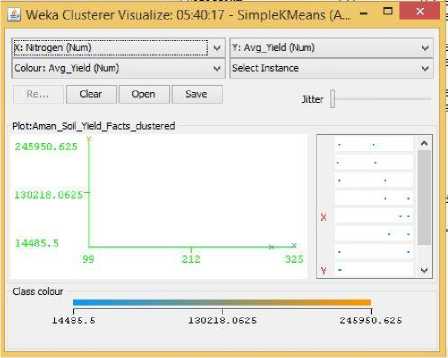
Fig.11. Nitrogen Vs Yield Cluster Visualization
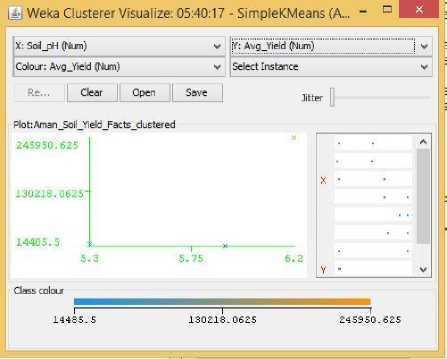
Fig.9. pH Vs Yield Cluster Visualization
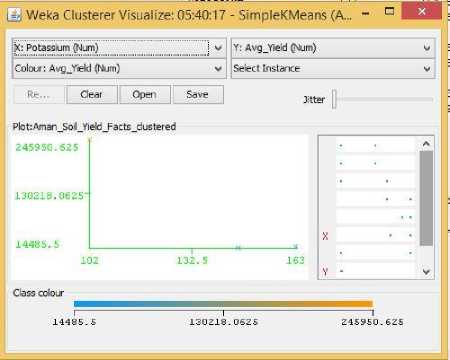
Fig.12. Potassium Vs Yield Cluster Visualization
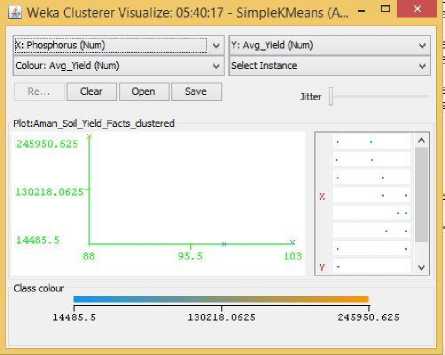
Fig.10. Phosphorus Vs Yield Cluster Visualization

Fig.13. Sulfur Vs Yield Cluster Visualization
ii. For BoroRice :
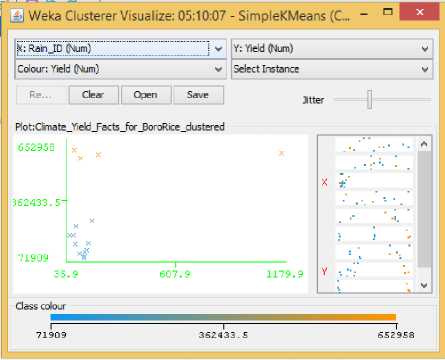
Fig.14. Rainfall Vs Yield Cluster Visualization
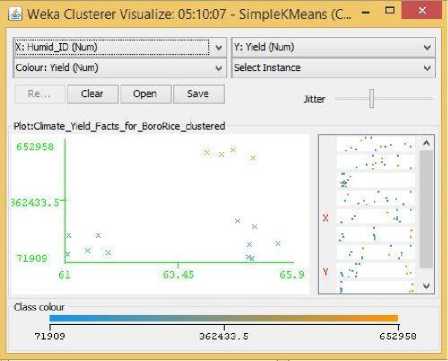
Fig.17. Humidity Vs Yield Cluster Visualization
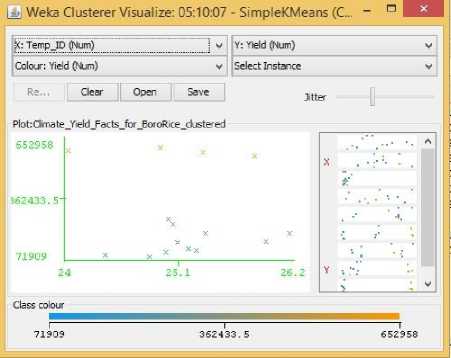
Fig.15. Temperature Vs Yield Cluster Visualization
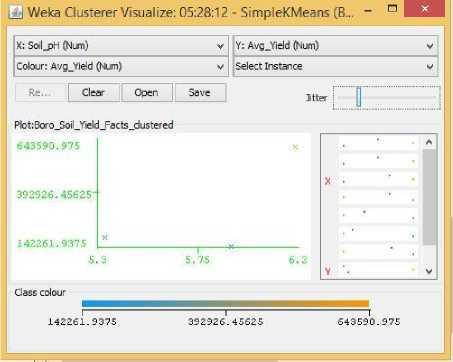
Fig.18. pH Vs Yield Cluster Visualization
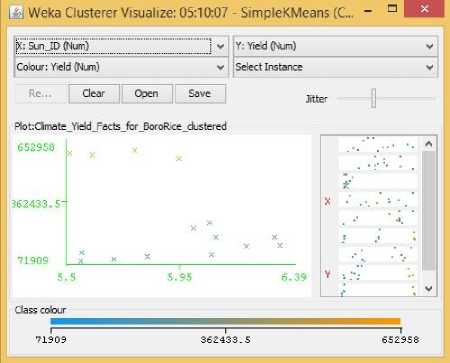
Fig.16. Sunlight Hours Vs Yield Cluster Visualization
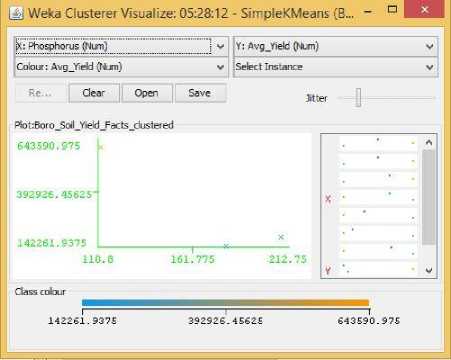
Fig.19. Phosphorus Vs Yield Cluster Visualization
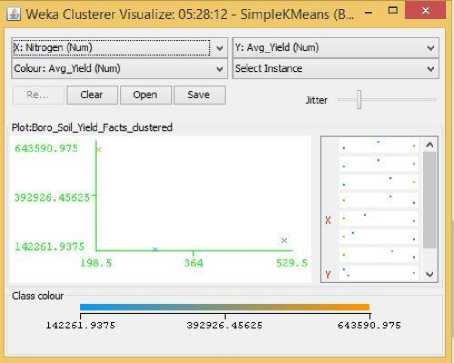
Fig.20. Nitrogen Vs Yield Cluster Visualization
iii. For AusRice :
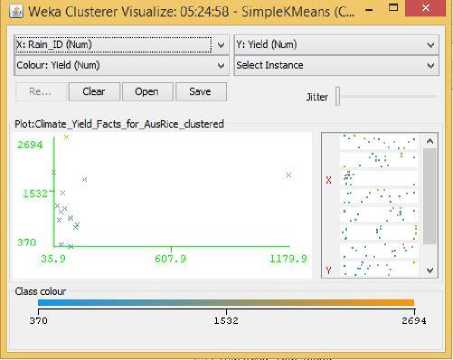
Fig.23. Rainfall Vs Yield Cluster Visualization
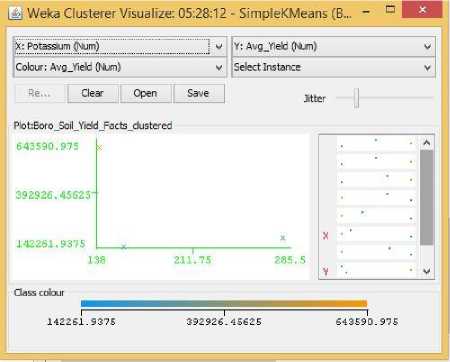
Fig.21. Potassium Vs Yield Cluster Visualization
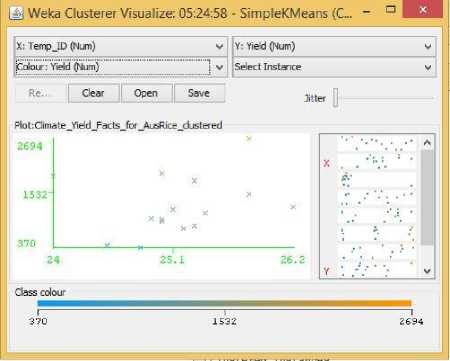
Fig.24. Temperature Vs Yield Cluster Visualization
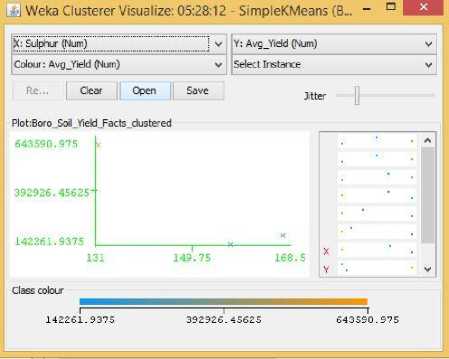
Fig.22. Sulfur Vs Yield Cluster Visualization
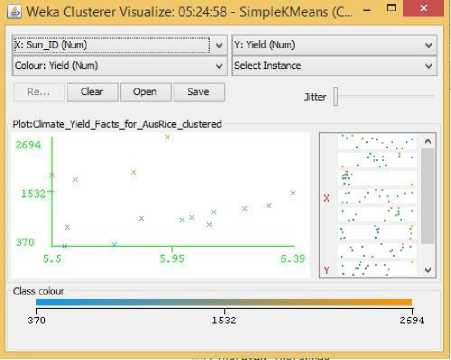
Fig.25. Sunlight Hours Vs Yield Cluster Visualization

Fig.26. Humidity Vs Yield Cluster Visualization
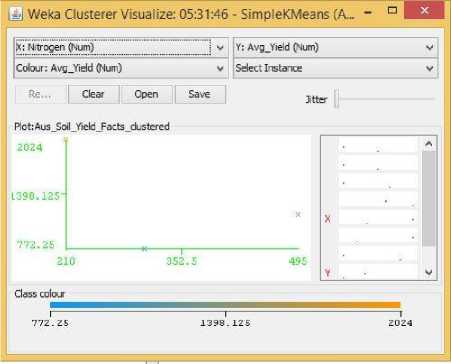
Fig.29. Nitrogen Vs Yield Cluster Visualization
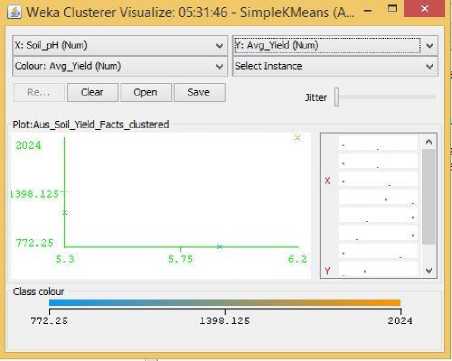
Fig.27. pH Vs Yield Cluster Visualization
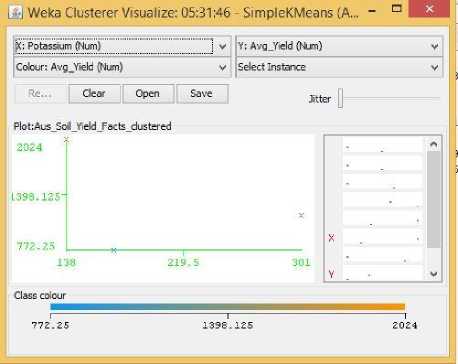
Fig.30. Potassium Vs Yield Cluster Visualization
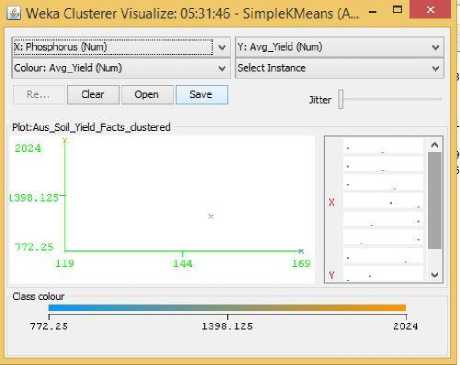
Fig.28. Phosphorus Vs Yield Cluster Visualization
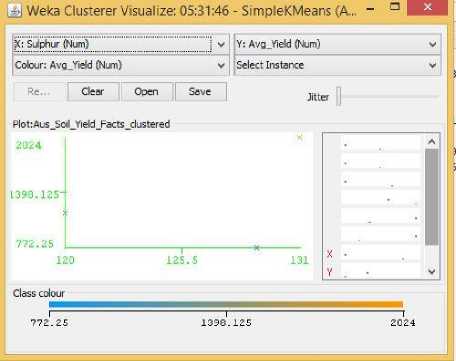
Fig.31. Sulfur Vs Yield Cluster Visualization
As it can be seen from the fig. 5 to 31, even though the clustering algorithm simply created K clusters of data points based on their relative characteristics, using the visualization tool in Weka, we could individually correlate the variation of each factor, whether it be climate or soil factor, against rice yield values and directly deduce their relationship with each other from the visualizations themselves.
In each of the visualizations, the x-axis represented a factor that would influence the rice production and on the y-axis are the yield values. The clustered data points have been classified based on their yield values and thus have been colored according to the yield value they represent for easier understanding of relationship between the factor under observation and the yield, such that, for data points lower yield values the color of the centroid will be more towards ‘blue’ while for data points that correspond to a higher yield value will have a color more towards the yellow end of the spectrum. The color spectrum has been shown for each visualization under ‘Class Colour’.
-
IV. Results and Discussion
In the previous section, we showed how we used K-Means clustering and Weka's visualization feature as the primary tool for obtaining the patterns found within the data points themselves. This section “Results and Discussion” describes the findings obtained by carrying out visual analysis on the organization and distribution of the clusters’ centroids in order to determine the behavioral patterns of visualized dependent variable, that being rice yield, with variation of the independent variables, that being the factors that affect rice yields which were identified in the second section of this paper. As we did in section three, the discussion of results in this section has been done for each variety of rice, which again was identified in the second section of this paper.
For Aman Rice:
For Boro Rice
From the Related Works section,we learned that Sunlight hours and Temperature had a positive impact on Boro rice production. But from the data visualization from section three, the scenario looks to be quite different. Fig. 15 shows a moderately positive relationship between temperature and yield, that is, for increasing temperature the yield for Boro rice seemed to have both its highs and lows. Meanwhile Fig. 16 showed that higher yields were obtained when the crops received fewer amounts of Sunlight hours. That is, after a particular value for Sunlight hours the centroids’ distribution showed that rice yields not only stopped increasing, it started to decline. One probable reason for this opposite behavior towards sunlight could be due to the increase in UV radiation in sunlight which in turn had adversely affected the crop growth [19]. Even though no previous research showed any positive relationship between humidity and yield of boro rice, our visualization in Fig. 17 clearly shows a positive trend between humidity and yield where for increasing value of humidity the centroids tend to position themselves for increasing values of yields. Now there were also some centroids that showed lower rice yields for increased humidity in the same figure, but we can argue that for lower humidity values there were not a single centroid that displayed large quantities of Boro rice yield, and hence there must be a positive relation between the two. As in the case of Aman rice, soil acidity shows a positive trend with yield in Fig. 18. where centroids tend to align with larger rice yield for increasing pH.
For Aus Rice
No such researches could be found that would indicate the important factors of rice yield for this particular season of the year. Probably because this season produces the least amount of rice compared to the other two seasons. Hence in the Related Works section, no such factors could be identified for Aus rice that could be cross-referenced with our visualization results. However, Aus rice does show some unique patterns. It does not show any predictable or understandable pattern for Rainfall in Fig. 23. It shows a somewhat positive trend towards increasing temperature, humidity, and pH in Fig. 24, 26, 27, while showing a decreasing trend with increasing Sunlight hour in Fig. 25. The latter could be contributed from the same reason described for boro rice above.
Overall
On the whole, the outcome of the analysis using the proposed approach has been quite revealing. Since the visualizations could positively show the trends in yield and the factors as seen from more exhaustive statistical methods used by other researchers [10, 11, 12, 14, 16],it can be safe to assume that this approach can and does give accurate results. For the rest of the times when the results did not concur with other researches, appropriate reasons have been provided for probable causes for each case in this section. The validity of these probable causes remains to be seen through further research.
-
V. Conclusion and Future Work
Through this research, we wanted to show that, analyzing multi-dimensional data using open source tools, useful patterns in dependency of rice yields on different factors of rice production can be identified. As time progresses the tools, techniques, and methods used to study, analyze and eventually understand our surroundings tend to change, often quite dramatically. Now, more than ever, researchers are using latest breakthroughs in technology for agricultural problems that were previously difficult to solve [21, 22, 23].
The prevalent factors for rice production were determined from relevant previous researches done on rice yield data in countries throughout the world. Using K-means clustering algorithm implemented in Weka, we analyzed the observed data for the factors we obtained cluster instances of data points. These data points were then visualized using different factors on the x-axis against the rice yield in y-axis using Weka’s built-in visualization tool. Then, through visual analysis we could identify the trends the data points exhibited which enabled us to approximate the dependency of rice yield on each of the factors individually.
On a different note, for further work on this research, in order to make the results of this research even more meaningful, a correlation analysis can be carried out in order to find out the correlation between the factors themselves so that we can better understand the dependency of rice yield on the factors and might also conclusively explain some of the anomalies observed in our findings. Specifically, the approaches used by the researchers in [23], even though it was for an entirely different crop, can be used in conjunction with the data analysis techniques used in this research in order to further enrich the results and hence portray the dependence of rice yield on the various factors on a more granular level. Also, the data warehouse could be made richer by including data for min, max parameters of all variables. Data for organic matter, CO2, etc. could also be collected and included into the warehouse. To further extend the bounds of this research, a neural network can be built to run on the data warehouse and can be integrated with the one discussed in [23] to create an allround machine learning system that can theoretically provide the knowledge one might need to achieve optimal rice yields. It is then that we might actually be able to bring out even more revealing, enticing, or even surprising knowledge about the crop without which more than 3.5 million people cannot live [24].
References Investigating Factors that Influence Rice Yields of Bangladesh using Data Warehousing, Machine Learning, and Visualization
- Trading Economics, "Agricultural land (% of land area) in Bangladesh", Available: http://www.tradingeconomics.com/bangladesh/agricultural-land-percent-of-land-area-wb-data.html, last visited: 1st Jan 2015
- http://www.foodsecurityatlas.org/bgd/country/availability/agricultural-production, last visited: 2nd Jan 2016.
- Sergio Luján-Mor, PanosVassiliadis, and Juan Trujillo, "Data Mapping Diagrams for Data Warehouse Design with UML", last visited: 21st Jan 2016.
- Robert H. Stolt, "Seismic data mapping and reconstruction," GEOPHYSICS 2002 67:3, pp. 890-908 .
- http://www.thefinancialexpressbd.com/old/index.php?ref=MjBfMDlfMDVfMTNfMV8xXzE4MjMxMw==, last visited: 21st Jan 2016.
- http://www.statista.com/topics/1443/rice/, last visited: 7th May 2016.
- M. A. Razzaque, S. Rafiquzzaman, "Comparative Analysis of T. Aman Rice Cultivation under Different Management Practice in Coastal Area," JARD, vol. 5(1&2),pp. 64-69, June 2007.
- www.bbs.gov.bd/, last visited: 12th May, 2016.
- scn.sap.com/docs/, last visited: 12th May, 2016.
- M. H. Ali, M. G. Mostofa Amin, 'AmanGrow : A simulation model based on weather parameters for predicting transplanted Aman Rice production in Bangladesh,' Article in Indian Journal of Agricultural Sciences.
- Jayanta Kumar Basak, M. Ashraf Ali, Md. Nazrul Islam, Md. Abdur Rashid, 'Assesment of effect of climate change on boro rice production in Bangladesh using DSSAT model,' Journal of Civil Engineering(IEB), 38(2), pp. 95-108, 2010.
- Md. Ruhul Amin, Junbiao Zhang, Mingmel Yang, 'Effects of Climate Change on the yield and cropping Area of Major Food Crops: A Case of Bangladesh,' Article inSustanability Journal (7), pp. 898-915, 2015, doi:10.3390/su7010898.
- Aditya Kumar Gupta, BireshwarDassMazumdar, 'Multidimensional Schema for Agricultural Data Warehouse,' IJRET, vol.2, issue.3, March 2013.
- David B. Lobell, Marshall B. Burke,'On the use of statistical models to predict crop yield responses to climate change,' Article inElsevier AGMET, 2010.
- Abu Ahmed Mokammel Haque, HemanthaJayasuria, 'Assesment of Influential Soil Properties in Irrigated Rice Domain of Bangladesh by GIS: A Case Study,' ResearchGate, December 2007.
- Hds.essex.ac.uk/, last visited: 14th May, 2015.
- Hetal Patel, Dharmendra Patel, 'A Brief survey of Data Mining Techniques Applied to Agricultural Data', IJCA, vol.95-no.9, June 2014.
- Georg Russ, Rudolf Kyuse, 'Machine Learning Methods for Spatial Clustering on Precision Agricultural Data,' Otto-vonGuericke-Universitat Magdeburg, Germany.
- DM. Olszyk, K.T. Ingram, 'Effects of UV-B and Global Climate change on Rice Production: The EPA/IRRI Cooperative Research Plan,' International Rice Research Institute, Philippines.
- M. Charles Arockiaraj, 'Applications of Neural Networks in Data Mining,' International Journal of Engineering and Science, vol.3, issue. 1, pp. 8-11, May 2013.
- Shekhar F. Lilhare, Dr. N.G.Bawane, 'Artificial Neural Network Based Control Strategies for Paddy Drying Process,' International Journal of Information Technology and Computer Science, vol. 6, no. 11, pp. 28-35, October 2014.
- Shaikh Habiba Sultana, M. Shahjahan Ali, Mst. AshrafunaharHena, M. Muntasir Rahman, 'A Simple Model of Mapping of Land Surface Temperature from Satellite Digital Images in Bangladesh,' International Journal of Information Technology and Computer Science, vol. 5, no.1, pp. 51-57, December 2012.
- Kohei Arai, Yoshihiko Sasaki, Shihomi Kasuya, Hideto Matusura,' Appropriate Tealeaf Harvest Timing Determination Based on NIR Images,' International Journal of Information Technology and Computer Science, vol. 7, no. 7, pp. 1-7, June 2015.
- 'The Global Staple', CGIAR, available: http://ricepedia.org/rice-as-food/the-global-staple-rice-consumers, last visited : 20th July, 2016.
