Investigation of the metrological characteristics of the PulsESPI system applied to the precision inspection of thermal deformations

Author: Zavyalov P. S., Kravchenko M. S., Urzhumov V. V., Kuklin V. A., Mikhalkin V. M.
Journal: Siberian Aerospace Journal @vestnik-sibsau-en
Section: Aviation and spacecraft engineering
Article in issue: 2 vol.20, 2019.
Free access
High-precision and reliable inspection of thermal deformations is necessary in terms of simulating the effects of space in the ground-based experimental processing of antennas and mirror systems of spacecrafts. Inspection of objects up to 1.5 m in size is considered in the paper. In practice, it can reach sizes up to 10 m. Requirements for thermal deformation are in range of 10–200 micrometers. The deformable surface is rough (Ra » λoptic). The measurement error, however, should not exceed ± 1 micron. The electronic speckle pattern interferometry (ESPI) method is the most suitable for solving this problem. The method allows to inspection objects with a randomly inhomogeneous surface. The method assumes that it is necessary to calculate the wave phase values from the recorded picture by the digital matrix. It is the phase that contains information about the deformation, and the spatial phase shift method is used to calculate it. One of the measuring systems based on this method is the measuring system PulsESPI (Carl Zeiss Optotechnik GmbH production, Germany). It has a high sensitivity which is about 50 nm. However, this measuring system is designed for single measurements. In this regard, an additional software module for processing and visualization the result of a series of several hundred measurements has been developed. The experimental test bench with a test object has been developed to research the metrological characteristics of the PulsESPI system in accordance with thermal deformations measurements (multiple determinations). The PulsESPI system and the Renishaw XL-80 interferometer introduced into register of measuring instrumentation of Russian Federation were located on different sides of the object 1.5 m in size. As a result of measuring the surface displacement measured by the Renishaw XL-80 interferometer and its corresponding point from the PulsESPI system deformation map are compared. Three types of tests were carried out at the developed bench. The root-mean-square deviation of single measurements was no more than ± 0.2 μm. Error was no more than ± 1 μm when the series of measurements was conducted in which a total strain of 200 μm was obtained. The results obtained suggest the possibility of using this system for high-precision inspection of thermal deformations of large objects.
Electronic speckle pattern interferometry, method of spatial phase shift, measurement system for thermal deformations, thermal deformations measurement.
Short address: https://sciup.org/148321680
IDR: 148321680 | UDC: 681.787.7 | DOI: 10.31772/2587-6066-2019-20-2-210-218
Text of the scientific article Investigation of the metrological characteristics of the PulsESPI system applied to the precision inspection of thermal deformations
Introduction. To determine the temperature effect on the geometrical parameters of spacecraft elements under conditions of simulation influence of space factors, high-precision and reliable inspection of thermal deformations of objects about 1.5 m in size is necessary. Special attention is paid to reflectors and mirror systems, which thermal deformations should be measured with an accuracy of 1 micrometers. The maximum deformation for the entire test period is about 200 μm, and the error of its measurement should be no more than 1 μm.
The objects to be used in tests to determine thermal deformations of surfaces are carbon fiber reflectors, the surface of which is usually rough (Ra » λoptic). The diameter of the objects does not exceed 1.5 m, and the depth of its central part relative to the edges is no more than 0.5 m. At the same time, the distance between the object and the measurement system is in the range from 1 to 6 m. Horizontal vacuum installation unit with the capacity size of 600 m3 will be used to simulate the effects of space. Tests are conducted under conditions of simulation influence of space factors ( p ≈ 1.333 * 10–3 Pa; t ± 150 ° C).
The measurements of a test object made of aluminum with dimensions of 1.5 x 1.5 m and having thickness of 5 mm were made as part of this work. The surface of the object was rough. Tests were conducted under normal conditions.
Method of measurement. A review of contactless methods for measuring large-sized objects with a rough surface showed that the required metrological characteristics of the inspection are provided by the speckleinterferometry method [1–3]. In order to inspection the thermal deformations of spacecraft elements, it is necessary to use the modification of the method with the use of electronic image registration devices – the method of electronic speckle pattern interferometry (ESPI). This method has been widely used for non-destructive testing of deformations [4], displacements [5], vibrations [6] of various kinds of the studied environments, and also, unlike standard methods of interferometry, this method makes it possible to inspection objects with an optically rough surface (randomly heterogeneous), which most of the elements of the apparatus in the aerospace industry possess.
The method of speckle interferometry makes relative measurements, at which changes in the surface shape between the initial and final states are recorded. Wherein, the shape of the object can be arbitrary. The interference pattern is obtained both on flat and on volumetric objects. At the same time, the depth of the object should not exceed the value of half the coherence length of the laser interferometer.
In the optical scheme of a speckle interferometer, the coherent radiation of the laser 1 is guided by the mirror 3 and scattered by the lens 4 on the surface of the object 7 (fig. 1) [7].
The spatial separation of the reference and object arm occurs on the beam splitter 2. Then, the addition of the reference wave passing through the lens 5 and directed by the beam splitter 8 is performed with the object scattered by the object formed by the lens 6. The intensity of final speckle pattern distribution depends on relative phase shift of these waves formed as a result of the deformations on the object 7.
Digital camera 9 registers the initial and deformed state of the object in the form of speckle images, which are described by formula (1) [8]. The difference of the illumination vector k and the observation vector k он gives the sensitivity vector ? of the whole system. Deformations are recorded in the direction of this vector. As a result of performing a number of arithmetic operations, computer 10 forms a picture of interference fringes (fig. 2), which is decoded and transformed into the field of displacements of the test surface.
I result = I obj + I refer + 2 ^I obj I refer COS( ф + Аф ). (1)
Information about the change in the surface of the object carries a change in the phase φ of the object wave. To calculate it from formula (1), it is also necessary to know two other unknowns: the intensity of the reference Irefer and the intensity of the subject Iobj waves.
Thus, to determine these three variables, it is necessary to register two more images that will have a known phase shift Аф . At the same time, during the acquisition of all three images, the object must remain stationary and not undergo any changes (fig. 3).
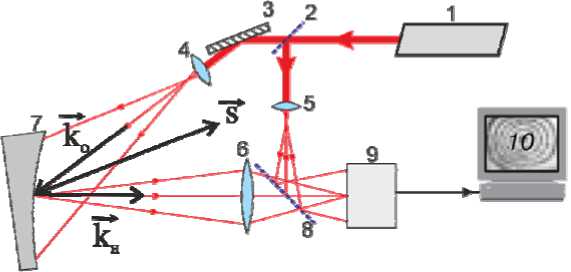
Fig. 1. Key diagram of the speckle interferometer
Рис. 1. Принципиальная схема спекл-интерферометра
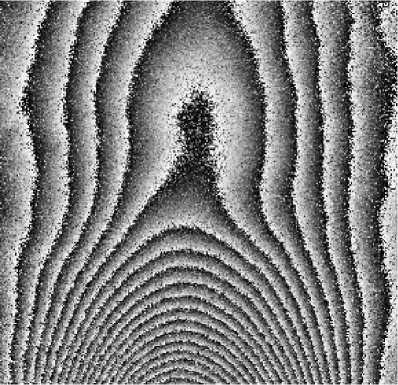
Fig. 2. Interference fringes
Рис. 2. Интерференционные полосы
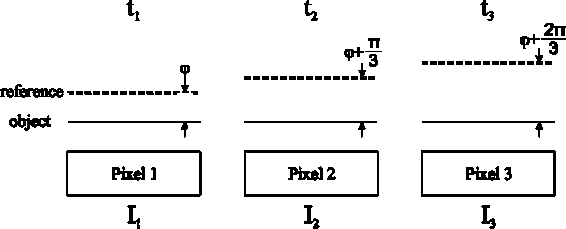
Fig. 3. Temporal phase shift method
-
Рис. 3. Метод временного сдвига
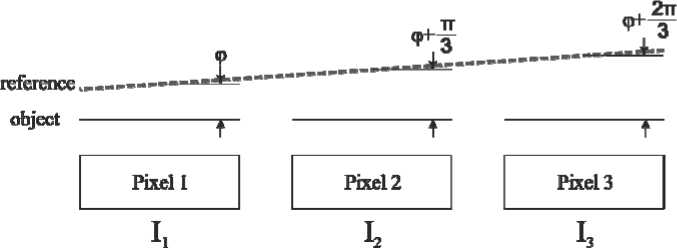
Fig. 4. Spatial phase shift method
Рис 4. Метод пространственного сдвига
For the π/3 shift, we obtain a system of three equations 1. Solving it, we obtain formula (2) for determining the phase. This is the time shift method. In practice, the sequential acquisition of three images with a motionless object is often impossible.
ϕ = arctan 3 I result 1 I result 2 . (2) result 1 result 2 result 3
Another way to obtain a system of three equations for calculating the phase is the spatial phase shift method [9]. Reference wave I refer. is projected onto the matrix at a certain angle, thereby setting the known phase shift between adjacent pixels. As a result, you can get one image and, moving it pixel-by-pixel, get the values of I result 1 , I result 2 , I result 3 . Substituting the obtained values of illumination in expression 2, we obtain the phase φ (fig. 4).
The composition of the measuring system. One of the measuring systems based on this method is the system for measuring thermal deformations of surfaces PulsESPI (hereafter – PulsESPI), manufactured by Carl Zeiss Op-totechnik GmbH, Germany (fig. 5). Its work is based on the spatial phase shift method. The sensitivity of this system is less than the value of the wavelength of optical radiation and is about 50 nm. It shows good results in the quantitative analysis of the correlation fringes of high contrast obtained using a pulsed laser [10; 11]. Moreover, for work in conditions of a thermal pressure chamber simulating the climatic conditions of a spacecraft, it is not always possible to create ideal conditions for the stability of the base. In this case, the application of the doublepulse laser mode [12–14] is also important. It is also known that the PulsESPI system was used to measure the deformations of the reflector in the thermal vacuum chamber in the DLR in Berlin [15; 16].
The main components of the PulsESPI system are: synchronization unit 1, data analysis system 2 (FRAMESplus), HLS-R20 ruby pulsed laser 3 (wavelength 694 nm, pulse energy 1 J, pulse duration 20 ns, coherence length 1 m), optics 4, CCD camera 5 (resolution 1280 × 1024 pixels, pixel size 6.7 x 6.7 microns).
The data analysis system (FRAMESplus) is designed to work with a single measurement of deformation. Cycle processing from several single measurements is possible using additional software packages. At the same time, this processing takes a long time. Therefore, for processing and analyzing a series of measurements, an additional software module has been developed that allows one to load source data into FRAMESplus automatically and save the results in a separate file. With this software module it is possible to process and visualize a series of several hundred measurements with minimal operator involvement.
System testing. To test the PulsESPI system in order to determine its metrological characteristics, a bench has been developed, the scheme of which is shown in fig. 6.
An aluminum sheet 2 with dimensions of 1.5 × 1.5 m and a thickness of 5 mm is used as the test object. The elements of the spacecraft, in turn, may have a reflectivity different from aluminum. Therefore, in the process of setting up the PulsESPI system, one of the stages of adjustment is to adjust the brightness of the object beam. The reference beam in all experiments has a similar intensity, and the object beam is adjusted to it. For this, the possibility of changing the object beam diameter and the diameter of the aperture diaphragm of the camera lens is provided.
The PulsESPI 1 system is placed at a distance of no more than 6 m on one side of the object, and on the other side of the sheet a reflector 3 and the Renishaw XL-80 4 displacement interferometer are placed. The object is rigidly fixed to the inflexible columns 5, thereby providing the necessary rigidity. The surface area measured by the Renishaw XL-80 is deformed by the actuator 6. The measurement results compare the displacement readings recorded by the Renishaw XL-80 and the corresponding point from the deformation map obtained by the PulsESPI system. This is possible due to the fact that the sensitivity vector ? of the PulsESPI system and the direction of measurement of the linear movement of the Renishaw XL-80 coincide.
The Renishaw XL-80 interferometer and object columns are mounted on a massive base 7, which ensures their immobility relative to each other during the tests. To ensure the accuracy of measurements, external sources of vibrations and fluctuations of the measuring point were eliminated, optical paths were isolated, the synchronicity of reading registration and the PulsESPI system at the level of not more than 0.01 s. was provided.
Three types of tests were carried out:
-
1. Determination of measurement error between adjacent frames . In the process of testing the object is stationary, it has no effect. One hundred and twenty frames are recorded. Fig. 7 shows an example of a decoded interference pattern and a color matching scale in the image of
-
2. Determination of the measurement range between two adjacent frames . The object is stationary, the area measured by the Renishaw XL-80 is deformed (indicated by a white mark). The magnitude of the deformation during the test is constantly increasing. It starts with a value of 0.5 μm between adjacent frames and ends with a value of 10 μm. It is necessary to determine at what amount of deformations the interferograms will be correctly processed.
-
3. Determination of the total range of deformation measurements at which the measurement error does not exceed 1 μm. The object is stationary, the area measured by the Renishaw XL-80 is deformed (indicated by a white mark). The value of the deformation during the test is constant and equal to 5 μm (fig. 10). Seventy frames are registered and thus the total deformation obtained for the entire test is of about 350 microns.
the deformation value. It can be seen that the right, left and lower parts of the object are not deformed. These areas correspond to the columns and the area measured by the Renishaw XL-80 (indicated by a white mark), which is stressed by the actuator. The upper and central parts of the object are free and can oscillate, which can be observed on the deformation map.
Fig. 8 shows a histogram of the measurement error distribution frequencies: the difference in measurements at a point obtained from the deformation map of the Puls-ESPI system and measured by the Renishaw XL-80 interferometer. The standard deviation was 0.17 µm.
Fig. 9 shows an example of a decoded interference pattern and a color matching scale in the image of the deformation value.
It can be seen that the right and left parts of the object corresponding to the columns, are not deformed. At the same time, the area measured by the Renishaw XL-80 is deformed by an actuator by a value of about 10 μm. Because of this, there is a pass of the fringes in the lower part of the object when decoding the deformation map (areas are marked with white rectangles). When an object is deformed by an actuator of about 5 μm, no pass of the friges is observed (fig. 10).
Fig. 11 shows the difference between the readings of the Renishaw XL-80 interferometer and the PulsESPI system. The difference is random up to a deformation value of 6 μm, and its value is similar to the error value of test 1. However, with a deformation of 7 μm or more, when a pass of the fringes occurs, the error increases and begins to be systematic.
Fig. 12 shows the difference between the accumulated readings of the Renishaw XL-80 interferometer and the PulsESPI system. It can be seen that the difference in readings is less than 1 μm up to a value of 230 microns.
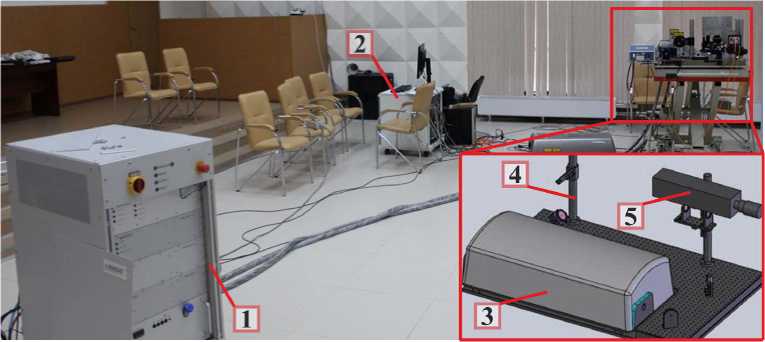
Fig. 5. General view of the PulsESPI System
-
Рис. 5. Общий вид системы PulsESPI
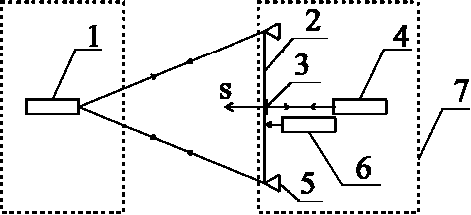
Fig. 6. Test bench layout of the PulsESPI
Рис. 6. Схема стенда для испытаний системы PulsESPI
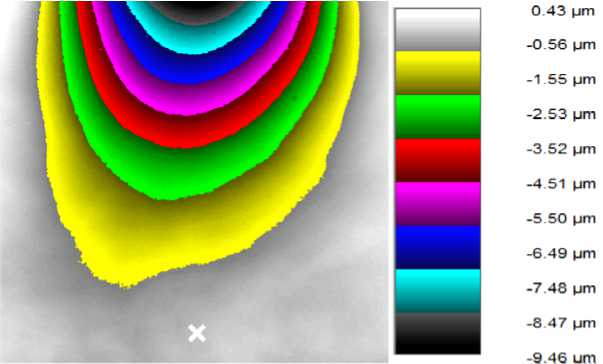
Fig. 7. Object deformation map. Test 1 (deformation at point 0 microns)
Рис. 7. Карта деформаций объекта (деформация в точке 0 мкм)
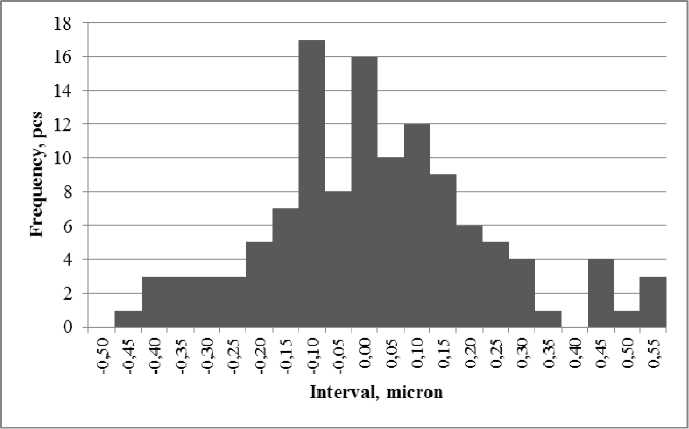
Fig. 8. Error frequency histogram. Test 1
Рис. 8. Гистограмма частот ошибок
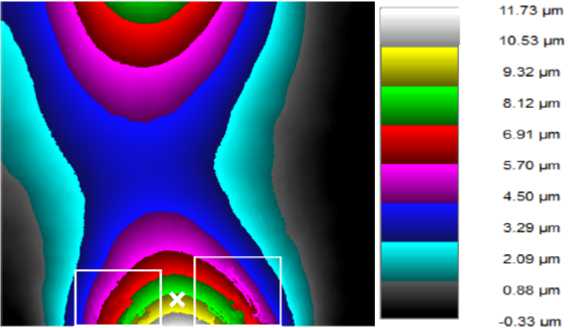
Fig. 9. Object deformation map. Test 2 (deformation at point 10 microns)
Рис. 9. Карта деформаций объекта (деформация в точке 10 мкм)
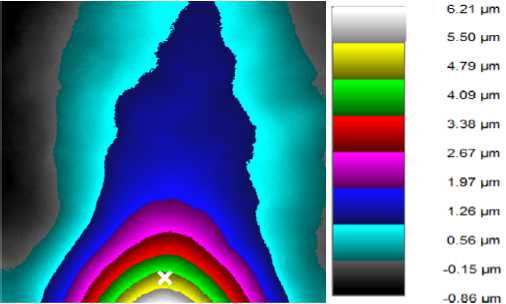
Fig. 10. Object deformation map. Test 3 (deformation at point 5 microns)
Рис. 10. Карта деформаций объекта (деформация в точке 5 мкм)
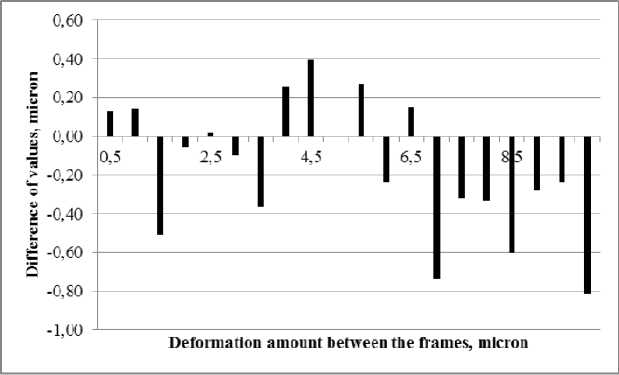
Fig. 11. The difference between the measurements of the Renishaw XL-80 interferometer and the PulsESPI System. Test 2
Рис. 11. Разница показаний интерферометра Renishaw XL-80 и системы PulsESPI
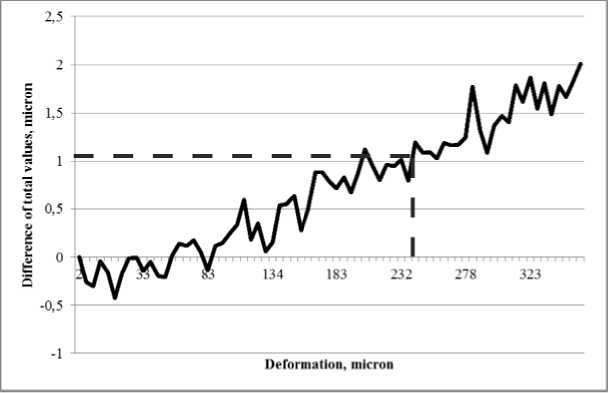
Fig. 12. Difference of total measurements of the Renishaw XL-80 interferometer and the PulsESPI System. Test 2
Рис. 12. Разница суммарных показаний интерферометра Renishaw XL-80 и системы PulsESPI
A possible reason for the appearance of an accumulating error is the instability of the temperature of the room in which the tests were conducted.
When tested in conditions simulating the impact factors of outer space two changes will occur in the optical measurement scheme: a window will be added, by means of which optical radiation will be brought inside the vacuum unit and the refractive index of the medium will change.
The presence of a vacuum has a positive effect on the measurements, since there will be no air flow, and the change in the temperature of the medium will not affect it. Due to the relativity of measurements, the window will not introduce an error in the measurement results. Error will occur only if there is a temperature gradient on the window [17].
Conclusion . As part of this work, the study of the PulsESPI measuring system was carried out, based on the method of electronic speckle pattern interferometry. This method performs the inspection of changes of the object surface relative to the initial state. To test the PulsESPI system for the purpose of studying the metrological characteristics, a test bench has been developed. As a result of testing, the following data were obtained: the maximum deformation between two consecutive measurements (frames) is of no more than 5 μm (with a larger step, the fringes gap occurs and, accordingly, the deformation value is calculated incorrectly); the maximum total deformation for the entire test period, at which the error does not exceed ± 1 μm, is no more than 200 μm. The results obtained and the chosen measurement method allow us to speak about the possibility of using this system for high-precision inspection of thermal deformations of large-sized objects, such as reflectors and elements of mirror systems of spacecraft under conditions of simulation of space impact factors.
References Investigation of the metrological characteristics of the PulsESPI system applied to the precision inspection of thermal deformations
- Franson M. Optika speklov [Speckle optics]. Moscow, Mir Publ., 1980, 171 p.
- De la Torre I. M., Hernandez-Montes M. del S., Flores-Moreno J. M., Santoyo F. M. Laser speckle based digital optical methods in structural mechanics: A review. Optics and Lasers in Engineering, 2016, Vol. 87, P 32–58.
- Ulyanov S. S. [What is speckle]. Sorosovskiy Obrazovatel'nyy zhurnal. 1999, No. 5, P. 112–116 (In Russ.).
- Arai Y. Three-dimensional shape measurement beyond the diffraction limit of lens using speckle interferometry. Journal of modern optics. 2018, Vol. 65, No. 16, P. 1866–1874.
- Aksenov E. A., Shmatko A. A., Zvorsky V. I., Kravchuk A. S. [Noncontact speckle interferometric meter for small displacements]. Radioelectronic and computer systems. 2008, No. 1 (28), P. 15–19.
- Stetson K. A. Vibratory strain field measurement by transverse digital holography. Applied Optics. 2015, Vol. 54, No. 27, P. 8207–8211.
- Pedrini G., Tiziani H. J. Double-pulse electronic speckle interferometry for vibration analysis. Applied optics. 1994, Vol. 33, No. 34, P. 7857–7863.
- Vest Ch. Golograficheskaya interferometriya [Holographic interferometry]. Moscow, Mir Publ., 1982, 504 p.
- Kujawinska M., Wojciak J. Spatial phase shifting techniques of fringe pattern analysis in photomechanics. Second International Conference on Photomechanics and Speckle Metrology, Proc. SPIE, 1991, Vol. 1554B, P. 503–513.
- 10 Cookson T. J., Butters J. N., Pollard H. C. Pulsed laser in electronic speckle pattern interferometry. Optics and Laser Technology. 1978, Vol. 10, P. 119–124.
- Tyrer J. R. Application of pulsed holography and double pulsed electronic speckle pattern interferometry to large vibrating engineering structures. Optics in Engineering Measurement. 1985, Vol. 599, P. 181–185.
- Spooren R. Double-pulse subtraction TV holography. Optical Engineering. 1992, Vol. 31, No. 5, P. 1000–1007.
- Pedrini G., Pfister B., Tiziani H. Double pulseelectronic speckle interferometry. Journal of Modern Optics. 1993, Vol. 40, No. 1, P. 89–96.
- Van der Auweraer H., Steibichler H., Haberstok C. et al. Industrial applications of pulsed-laser ESPI vibration analysis. Proceedings of the International Modal Analysis Conference – IMAC, Kissimmee, FL, United States, 2001, Vol. 1, P. 490–496.
- Nösekabel E. H., Ernst T., Haefker W. Measurement of the Thermal Deformation of a Highly Stable Antenna with Pulse ESPI. 18th International Congress on Photonics in Europe, Proc. SPIE, Munich, Germany, Proc. SPIE, 2007, Vol. 6616, P. 18–21.
- Ernst T., Linke S., Lori M., Fasold D., Haefker W., Nösekabel E-H., Santiago-Prowald J. Highly Stable Q/V Band Reflector Demonstrator Manufacturing and Testing. Proc. of 29th ESA Antenna Workshop, ESTEC, Noordwijk, Netherlands, 2007.
- Zavyalov P. S., Senchenko E. S., Chugui Yu. V., Mikhalkin V. M., Khalimanovich V. I. [Thermodeformation measurement of spacecraft elements by laser speckle interferometry]. Мaterialy XVIII Mezhdunar. nauch. konf. “Reshetnevskie chteniya” [Materials XVIII Intern. Scientific. Conf “Reshetnev reading”]. Krasnoyarsk, 2014, Vol. 1, No. 18, P. 82–83 (In Russ.).
