Investigation of the resolution of phase correcting Fresnel lenses with small values of F/D and subwavelength focus

Author: Minin I.V., Minin O.V., Gagnon N., Petosa A.
Journal: Компьютерная оптика @computer-optics
Article in issue: 30, 2006.
Free access
The focusing properties of phase correcting Fresnel lenses with small values of focal length - to - diameter (F/D) and with focal lengths of two wavelengths or less are investigated. For these lenses, the paraxial approximation for the Rayleigh resolution criterion is no longer valid. For Fresnel lenses designed with F/DF ≤ λ, spatial resolutions of less than 0.5λ are possible, which is finer than what can typically be achieved for conventional (paraxial) designs. The spot beams in these cases are not quite axially symmetrical due to the presence of anti-symmetric field components, which vanish for larger values of F/D.
Short address: https://sciup.org/14058717
IDR: 14058717
Text of the scientific article Investigation of the resolution of phase correcting Fresnel lenses with small values of F/D and subwavelength focus
For diffraction-limited optical and quasi-optical systems, which are subject to the paraxial approximation, the Rayleigh criterion gives the spatial resolution, ∆ , for a circular lens of diameter D and focal length F as [1]:
Fresnel Lens Design
The binary phase-correcting Fresnel lenses used in this study consist of a set of annular dielectric rings whose radii were determined using the traditional Fresnel zoning rule for flat surfaces with the geometric optics approximation [6]:
F ∆= 1.22 λ
D
i
⎛ i λ ⎞ 2
Fi λ+⎜⎝ 2 ⎟ , i = 1, 2,... N
The Rayleigh criterion defines the xy spatial resolution that can be achieved based on the wavelength of radiation that is used, the acceptance angle of the lens, and the index of refraction of the medium in which the radiation is propagating. From (1), it is seen that the spatial resolution decreases linearly with F/D . However, the paraxial approximation is generally agreed to be accurate when the value of F / D ≥0.5 [2, 3], for which the spatial resolution is limited by ∆= 0.61 λ . It is well known that optical instruments are limited by diffraction, whose spatial resolution limit was originally determined by E. Abbe, to be approximately half a wavelength.
For optical applications, lenses are typically designed with values for F / D much larger than one, due to the physically small values for the wavelength. These lenses thus have spatial resolutions much greater than a wavelength. At microwave and millimetre-wave frequencies, since the wavelengths are much longer, as well as in microoptics, it is feasible to design lenses with values of F / D <0.5. For these values, (1) is no longer an accurate estimate of the resolution. Although some studies were carried out on Fresnel lenses at microwave frequencies, only the impact of having small diameter lenses was investigated [4]. It is thus not clear what spatial resolution can be obtained for such designs. Moreover, for small values of F , the focal spot is in the reactive near field of the lens, and the effects of these reactive field components cannot be neglected, as is the case for larger values of F [5]. To investigate the behaviour of such lenses, the focal fields of a phase correcting Fresnel lens were examined for several small values of F / D and with F ≤ 2 λ .
where F is the focal length of the lens, λ is the wavelength, r i is the radius of the i th Fresnel zone, and N is the total number of zones in the lens of diameter D . (It should be noted that the optimisation of the Fresnel zone radii for improved focusing was not the aim of this study.) The thickness ( t ) of the rings is calculated based on the requirement of achieving a 180° path difference between the waves travelling through the dielectric rings and those travelling through air:
λ t =

where ε r is the dielectric constant of the rings. Three lenses were designed at 30 GHz using a dielectric constant of ε r = 4, which from (3) result in a ring thickness of t = λ /2.
Table 1. Fresnel zone radii (in mm) for different focal length designs
|
i |
F=2 λ |
F= λ |
F=0.5 λ |
|
1 |
15.00 |
11.18 |
8.66 |
|
2 |
22.36 |
17.32 |
14.14 |
|
3 |
28.73 |
22.91 |
19.36 |
|
4 |
34.64 |
28.28 |
24.49 |
|
5 |
40.31 |
33.54 |
29.58 |
|
6 |
45.83 |
38.73 |
34.64 |
|
7 |
51.23 |
43.87 |
39.69 |
|
8 |
- |
- |
44.72 |
|
9 |
- |
- |
49.75 |
The focal lengths for the lenses were chosen to be 2 λ , 1 λ , and 0.5 λ . The resultant radii for these lenses are listed in Table 1 and a diagram of the lenses is shown in
Figure 1. The diameters for the three lenses are somewhat different since an integer number of zones was used for each case; the values were chosen as close to D / λ =10 as possible. The correspondent Fresnel numbers ( π D 2 /( λ F ) ) are between 150 and 600.
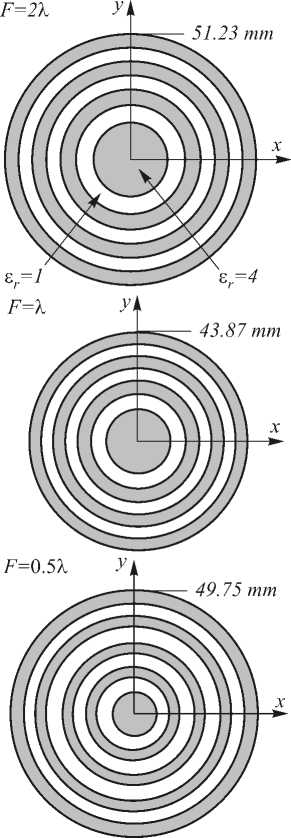
Fig. 1. Geometry of the phase correcting Fresnel lenses
Focusing Behaviour
The focusing behaviour for the case of an incident plane wave, polarized in the y-direction, as defined in Figure 1, was investigated for the three lenses, using finite difference time domain (FDTD) analysis [7].
In the calculations the mesh discretisation were as follows:
-
• Along z axis:
air: 20 points per wavelength at 30 GHz;
lens region: dielectric material: 25 points per wavelength at 30 GHz; air: 50 points per wavelength at 30 GHz;
-
• Along x and y axis:
air (around the lens): about 17 points per wavelength at 30 GHz;
-
• lens region:
dielectric material: 15-17 points per wavelength at 30 GHz; air: 25-29 points per wavelength at 30 GHz;
-
• maximum discretisation about 19 points per wavelength at 30 GHz.
The simulated focal fields in the y-z plane (at x=0) are shown in Figure 2, where the focal spots are seen to the right of the lenses.
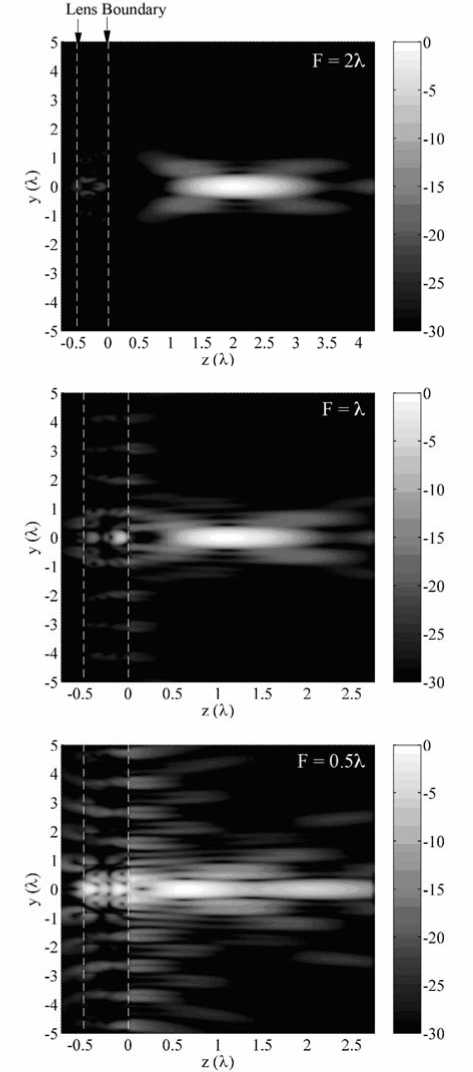
Fig. 2. Normalized power density in the y-z plane for the three Fresnel lens designs
For all three lenses, the maximum intensity occurs close to the designed focal length. This can be better observed in Figure 3, which plots the power density (nor- malized to the peak value) along the focal axis (x=y=0). The focal spots in the x-y plane, taken at a distance from each lens where the focal fields had a maximum intensity, are shown in Figure 4. The spatial resolution of the three lenses can be estimated from the location of the first nulls in the spot-beam pattern, the same rule as used by Rayleigh. Figure 5 shows the normalized magnitude for the spot beams, from which the resolution can be determined. The results are listed in Table 2. Since the spot beams were not perfectly axially symmetrical, the spatial resolution in both the x- and y-planes are listed. Except for one case (F =2λ), the spatial resolutions are all less than 0.5λ, which is significantly finer than the spatial resolution achieved from lenses with large values of F/D.
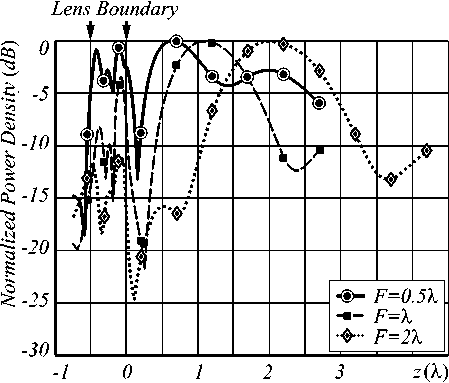
Fig. 3. Normalized power density along the focal axis (x=y=0)
Table 2. Estimated spatial resolution and aperture angles of the three Fresnel lens designs
|
F=2 λ |
F= λ |
F=0.5 λ |
|
|
Aperture angle |
137° |
154° |
169° |
|
Resolution (x-plane) |
0.52 λ |
0.45 λ |
0.40 λ |
|
Resolution (y-plane) |
0.48 λ |
0.45 λ |
0.37 λ |
|
1st side maximum (x-plane), dB |
-14 |
-12 |
-10 |
|
1st side maximum (y-plane), dB |
-12.5 |
-11 |
-7 |
Discussion
This preliminary investigation on the focusing properties of phase correcting Fresnel lenses with values of F/D <0.2 and with F ≤ 2 λ has shown that a spatial resolution of less than 0.5 λ is achievable. The "Abbe barrier" was thus completely broken by such lenses. As the F/D values decrease, so does the spot beam size and thus a finer resolution is achieved. Although the spot beam decreases with decreasing F / D , the total amount of focusing power also decreases.
This can be seen in Figure 2, which shows the focal fields less well confined into a single spot as the F/D decreases. There is thus a trade off between refined resolution and focusing power, and the selection of the F/D will thus depend on the intended application.
The reason for the slight axial asymmetry in the intensity patterns arises from the anti-symmetrical component of the electric field in the z-direction (direction of the incident wave). This component is significant for small values of F/D , since the focal spot is in the reactive near-field of the lens, and it causes the slight asymmetry in the intensity patterns.
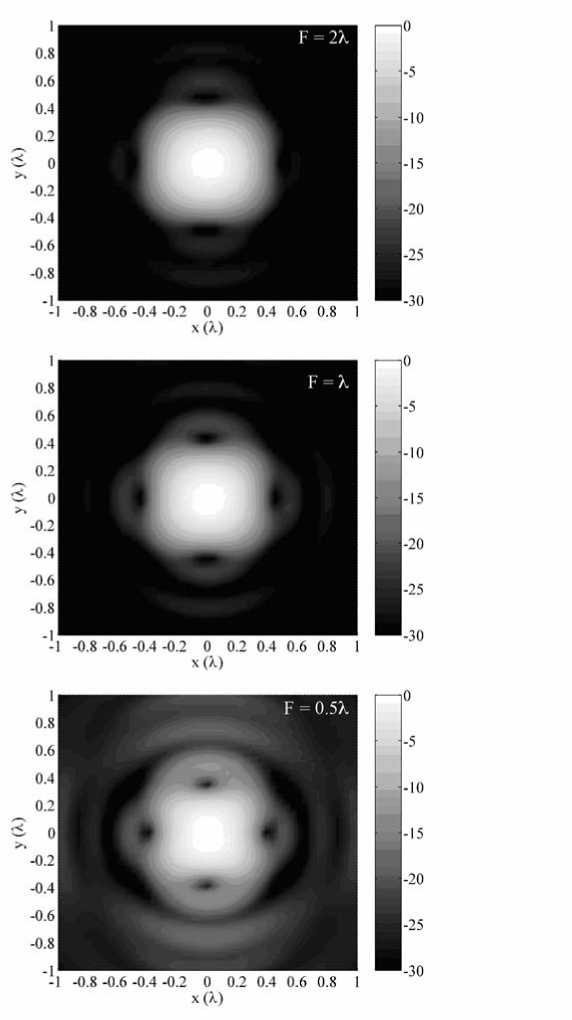
Fig. 4. Normalized power density at the distance of maximum intensity
As the values for F/D increase, the amplitude of this component quickly decreases and thus does not contribute significantly to the intensity, resulting in a symmetric pattern [8].
Normalized Power Density ЫВ) Normalized Power Density (dB)
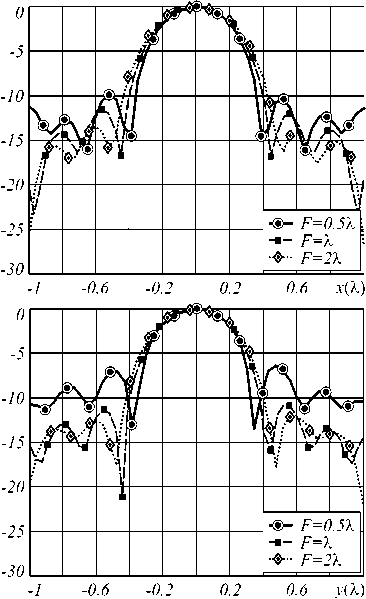
Fig. 5. Spot beams for the three Fresnel lenses
The results presented in this paper may find useful applications in optical microscopes, nondestructive testing, microoptics, and low-profile FZP arrays [9].
