Investigation of Wavelets for Representation and Compression of Skin Cancer Images

Author: Pavithra D.R., Sudarshan Patil Kulkarni
Journal: International Journal of Image, Graphics and Signal Processing @ijigsp
Article in issue: 2 vol.15, 2023.
Free access
Wavelets play a key role in many applications like image representations and compression, which is a main issue in the process of reducing the size in bytes of a digital image file to store it in the memory and as well as to transmit. This paper presents image representation using various wavelet transforms. In the proposed method, the comparison between wavelets applied on an image are considered by counting the number of approximation coefficients retained for the representation of images and comparative analysis of the standard wavelets available is presented. This paper mainly aims at the type of the wavelet which retains less number of approximation coefficients for representing skin cancer image and gives the reduced compressed file size by considering the various parameters like Peak Signal to Noise Ratio (PSNR), Mean Square Error (MSE), Structural Similarity Index Measure (SSIM) and Compression Efficiency.
Image Compression, Compression efficiency, MSE, PSNR, Skin Cancer, SSIM, Thresholding, Wavelets
Short address: https://sciup.org/15018751
IDR: 15018751 | DOI: 10.5815/ijigsp.2023.02.03
Text of the scientific article Investigation of Wavelets for Representation and Compression of Skin Cancer Images
Images consist of huge information which needs large memory and bandwidth for transmission. The storage capacity of an image increases as the size of an image file increases. In compression, the storage of required information to reproduce an image is enough rather than retaining all the information is very important. In lossy compression techniques of an image, Wavelets and Fractals offers better compression ratio than JPEG and GIF. For encoding of lossy images, wavelet plays a predominant role and has many applications in field of Image Processing (IP). Compression and denoising are the two main applications of wavelets which depend on the sparse representation and feature extractions. The filter banks have set of filters often has 2 filters: lowpass filter and highpass filter which separates the image frequency into 2 sub-bands. These sub-bands are compressed more successfully than the original image signal [1]. Wavelets have more applications and are an analytical tool which has noble features. Annihilation of polynomials in wavelets allows more compact representation of image signals [2]. Skin cancer images contain certain critical regions essential to characterize the severity of disease; such regions need to be represented with fine details. At the same time, these images also contain regions which are not useful for the purpose of cancer detection and hence can represented sparsely. This work investigates for the most appropriate wavelet that can be used to most efficiently represent the given skin cancer image. In section 2, image compression technique that is conventionally followed is explained. Section 3 provides the required mathematical background of wavelets followed by literature survey related to medical image representation in section 4. In section 5, proposed method is illustrated with steps which is followed by experimental results and related discussion in section 6. Conclusion and and future scope are discussed finally in section 7.
2. Method of Image Compression
The main requirement of the universal system for image compression is to reduce the image file size for storage and to reconstruct it as close as to the input image. Fig.1 depicts the different blocks in the process of image compression and decompression. Here, the input image is applied to the mapper to transform it into a format which lessens the inter-pixel redundancies available. The amount of information required to represent the image depends on the mapper. Due to some predetermined factors, the accuracy of the mapper reduces. The output of the mapper is quantized by the quantizer which gives approximated finite values. The output of the quantizer is encoded using an encoder having fixed or variable length code. Encoder and mapper are reversible on the other side of image reconstruction. Thus, the compressed image is rebuilt using inverse mapper and decoder [3].
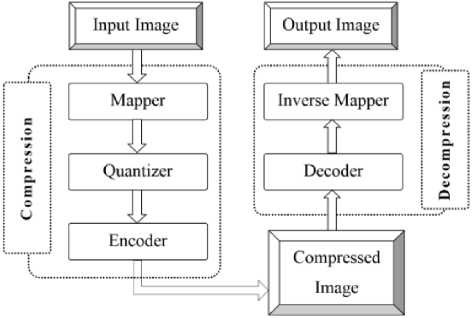
Fig. 1. Process of Image Compression and Decompression.
-
A. Parameters considered in Image Compression
Following are the parameters considered for better image compression [4].
-
i. Compression Efficiency
Image compression efficiency is determined by Compression Ratio (CR), which is calculated as in equation (1).
CR= —
C c
Where, C0 is the original file size in Kb and Cc is the compressed file size in Kb. The Compression Success Rate (CSR) is obtained by the equation (2)
CSR = 1 - —
CR
-
ii. Quality of an Image
The quality of digital image is determined by 2 considerable parameters, such as Peak Signal to Noise Ratio (PSNR) and Mean Square Error (MSE). PSNR is measured in dBs with respect to the peak value in the original image. If the original image is X(m, n) and the compressed image is Y ( m, n ) then the MSE and PSNR is given as in the equations (3) and (4) respectively.
MSE — £Mj№(m,n)-Y(m,n)]2
MN
PSNR = 10log1Q^2-
10 MSE
Where, xp is the max [ X1 ( m, n )]
-
iii. Bits Per Pixel (BPP)
In an image, BPP is used to represent the number of binary bits used per pixel. The number of colors or shades represented by BPP is given as 2bpp. Suppose the BPP is 1, two colors are represented and if it is 2, four colors are represented, and so on.
-
iv. Structural Similarity Index Measure (SSIM)
Similarity is found with both the original image and compressed image is considered for measuring the quality of the image. If SSIM measured between same images, then the value of SSIM is 1. The SSIM index is a full reference metric, the measurement or prediction of image quality is based on an original or uncompressed or lossless image as reference. The different windows of the images x and y of size NXN are used to calculate SSIM. The SSIM is calculated on various windows of the image the measure between two windows x and y of common size NXN is given by
SSI M (x,y)
(2^ x M y +C i )(2o x ° y +C 2 )
(м Х +М ^ +C i )( o X + o y +C2)
where, µ x , µ y are mean values of x and y respectively. Similarly σ x , and σ y are the standard deviations for images x, y; and C 1 = (0 . 01 L )2 , C 2 = (0 . 03 L )2. L being the dynamic range used to represent the pixel value given by 2bpp-1.
The SSIM equation is founded on 3 parameters measurements between pixels of x and y of the images, such as luminance (Z), the contrast (c), and structural (s) term of the image.
Z(x,y)
2 ^ X ^ y + C 1 ^ x^ +^+C i
c(x,y)
2 ° X ° y + C 2 O x^ + Oy^+C ^
s(x,y)
O xy +C 3
O x O y + C 3
where, σ xy is the cross covariance for images x, y specified in equation (8); C 3 = C 2 / 2. SSIM can be rewritten as in the equation (9) with weights of α, β, and γ to 1.
SSIM(x,y) = [Z(x,y)]K[c(x,y)]^[s(x,y)]y
3. Medical Image Compression
Medical imaging with compression is very crucial to cope up with the distant treatment which is becoming common now a days by speeding image transmissions as well as efficient storage for further usage. Wavelet transform technique plays an outstanding role in medical image compression [5]. Medical image representation and compression is very much essential in tele-radiology applications. In order to manage the information related to medical image communication, transmission and associated data, there exists a standard known as Digital Imaging and Communications in Medicine (DICOM). DICOM includes protocols for image exchange, image compression etc. [6]
-
A. Skin Cancer Images
Skin Cancer is the most frequent type of cancer. Early detection of skin cancer helps doctor to treat effectively. Various skin cancer types exists which differs in appearance. Skin growths due to cancer looks different compare to the non-cancerous skin growths. Among images of lumps, bumps, spots, sores and other marks which changes frequently, skin cancer images looks different and easily identified. The main cause for the skin cancer is the over exposure to the sun light. Genetic material in skin cells changes due to ultraviolet (UV) rays in the sun light. Due to sunlamps, tanning booths and X-rays which produces UV rays results in malignant cell mutations causes damages on skin. Basal Cell Carcinoma (BCC) and Squamous Cell Carcinoma (SCC) and Melanoma are the various kinds of cancers. Different image processing techniques such as denoising, re-sizing and segmentation are used to find skin cancer [7]. Melanoma is a very dangerous type of skin cancer. Overall 75% of deaths are due to Melanoma cancer even it reports 4% of all skin cancers [8]. In order to represent these skin cancer images in compressed form, it is very important that critical information related to skin and disease are retained while suppressing the redundant information to the maximum extent possible.
-
B. Lossy Compression Approaches
In lossy image compression methodology, only useful information of an image is retained and unrelated information is distant [9]. Thus, while removing irrelevant information, some relevant information may be lost. Therefore, compressed image is dissimilar to the original image.
-
i. Discrete Wavelet Transform
A wavelet is a waveform of effectively constricted duration that has an mean value of zero. It is defined as in equation (10).
^(t) = -L^(£z^) a,bER (10)
where, ‘a’ and ‘b’ are called dilation (scale) and translation (position) parameters. If scales ‘a’ and position ‘b’ are chosen to be discrete then analysis becomes much easier and do not generate the huge data. This idea of choosing discrete values for ‘a’ and ‘b’ is implemented using redundant wavelet transforms and orthonormal bases for wavelets or Multi Resolution Analysis (MRA). For redundant wavelet transforms, ‘a’ is chosen to be an inter powers of one fixed dilation parameter a0 > 1 i.e., a = a0m. The different values of ’m’ correspond to wavelets of different widths. The narrow wavelets are translated by small steps while wider wavelets are translated by larger steps. Therefore ‘b’ is discretized by b= nb0a0m, where, b0 > 0 is fixed and n ϵ Z. The corresponding discretely labeled wavelets are therefore given in (11),
т
^т;п(к) = ar/2 V(^ т.п е Z
For a given function f(k), the inner product ( f, Ψ m,n ) then gives the DWT as given in equation (12)
т
DWT(m,п) = (f^-) = а0"тЕ/(к)У* (а0тк — пЬо) (12)
In order to obtain more efficient and accurate analysis, scaling and position are expressed in terms of multiples of two named as dyadic scales and position called multi-resolution analysis. For special choice of ψ (k) and a 0, b 0 the ψm,n ( k ) represent an orthonormal basis for L2(R). In particular, if a 0 = 2, b 0 = 1, then there exist ψ ( k ) with good timefrequency localization properties given in (13)
т
Чт.тАк) = 2"V (2-тк — п) т.п е Z
For a given function f(k), the inner product ( f, Ψ m,n ) then gives the DWT as given in equation (14)
DWT(m, п) = (f, Ут,п) = 2-т Е/(к), V* (2-тк — п)
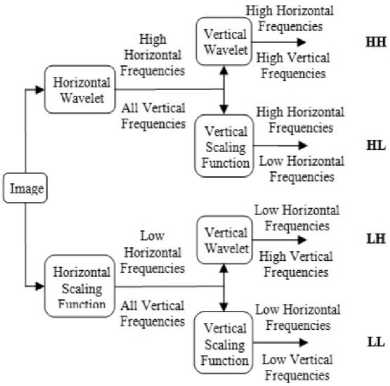
Fig. 2. Schematic Diagram of Pyramidal Decomposition.
Wavelet compression is more applicable for image, audio as well as video compression where some loss of information is allowed. It is a more proficient and accepted transform to defeat the drawbacks of regular transforms. In wavelet compression, trade-off between the time and frequency resolution acts as an imperative task. For examining the extensive region of signal with low frequency, the expansive basis function can be utilized. Likewise, for analyzing the diminutive region of signal with high frequency, a little basis function may be utilized. The DWTs are the wavelet transforms, in which the wavelets are exclusively sampled. The DWTs trades by means of 2 tasks, such as scaling and wavelet functions. Also it has more benefits compared to traditional Fourier Transform. DWTs are exceptionally proficient technique for decomposition of image signals. The DWT is an essential means for various applications viz compression, classification, and also estimation of the images. One of the main feature of wavelets in reality is that wavelets makes unrestricted bases for several distinct classes of signals. Thus, the majority of the signal information in wavelet spreading outs is transmitted through a comparatively few counts of larger coefficients. This useful feature of wavelets is especially ideal in signal evaluation. It has been found that wavelets can reduce noise more capably than earlier used techniques. This noise may be caused by numerous grounds together with interference in transmissions, restrictions in data collection, supremacy of audio recording, experimental error etc.
DWT divides the time signal into various frequency bands, by consecutively filtering it into low and high frequency signals [10]. Fig.2 depicts the schematic diagram of pyramidal decomposition using DWT. In order to get low frequency components of each and every row data of an image, low pass filter is utilized. In the same way, high pass filter is utilized for getting high frequency same row components. The frequency of an output of low pass filter is only the 1st half part of the input frequency range concerned. Low pass filter output is decimated to get the significant information contained in an image while high pass filter output gives the noisy component of an image. Therefore, image is filtered horizontally followed by filtering the sub images vertically. The pyramidal decomposition of an image is divided as 4 bands indicated as LL, HL, LH, and also HH after single and two-level decomposition [9] are displayed as in Fig.3.
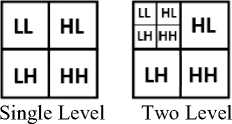
Fig. 3. Pyramidal Decomposition of an Image
The quantizer is applied for quantizing continues values of the image into discrete values. Finally encoding of estimated constituent values results in the compressed image. Different images have different prominent information and characteristics. Hence, a single wavelet system of fixed filter coefficients cannot efficiently compress and represent those images. Filter coefficients needs to adapt based the image characteristics. Thus, for achieving compact image representation using such adaptive technique considering various performance criteria is a challenging.
-
ii. Image Compression by Wavelet Thresholding
Any type of wavelet is used to decompose an image and represent it by coefficients. Compression can be achieved by discarding all coefficients below threshold value. The number of coefficients retained is used to compactly represent an image. The type of wavelet which provides less number of coefficients becomes more efficient compared to other wavelets. The information retained by the wavelets is called the retained energy, which is 100% then there is no loss of information. Suppose, there exist any loss of retained energy then loss of information exists.
-
C. Types of Wavelets
Different wavelets are used for the decomposition of an image to represent it using less number of coefficients. The wavelet families such as Daubechies, Symlets, Bi-orthogonal and Coiflets are considered as they provide compact support. The names of the wavelets such as dbN, symN gives the number of vanishing moments for the wavelet as mentioned by its N value. For example, db6 and sym3 has six and 3 vanishing moments respectively. Coiflets has 2N vanishing moments so coif5 has 10 vanishing moments likewise bi-orthogonal wavelets represent biorNr : Nd where ‘Nr’ is the number of vanishing moments for synthesis wavelet and ‘Nd’ is the number of vanishing moments for analysis wavelet. For example, bior3.5 has 3 and 5 vanishing moments for input and output wavelet filters respectively.
-
i. Haar Wavelets
The simplest wavelet among all the wavelets is Haar wavelet. Haar Transform is applied when haar wavelets are used in discrete form. Haar wavelet is a basic model for all other wavelets used. Haar wavelet is also called as db1. The dilation and wavelet equation of Haar wavelet is given by (15) and (16)
0(t) = 2 + Z(^o(k)0(2t - к)
w(t) = 2 + Z(Mk)0(2t-k)
Replacing ‘t’ by 2 j- 1 t to hold for all ‘t’
0(2'-1t) = 2 + E(MWt-fc)
a(2i-1t) = 2 + Z(Mk)0(2;'t-k)
The lowpass and highpass haar filter coefficients are given as h 0[ n ] = [0.5 , 0.5] and h 1[ n ] = [0.5 , - 0.5] substituting this in equations (17) and (18) respectively yields the equations (19) and (20) for scaling and wavelet functions for Haar wavelets respectively.
0(t) = 0(2t)0(2t-1)
w(t) = 0(2t)0(2t — 1)
-
ii. Daubechies Wavelets
Daubechies Wavelets are the wavelets with scalar products of scaling and wavelet function with averages and differences [10]. Daubechies wavelets are used in many applications. The scaling signals and wavelets have somewhat extended supports in Daubechies wavelet transforms i.e., they produce averages and differences using just a few more values from the signal producing great improvement. They give a set of powerful tools for performing basic signal processing tasks.The scaling coefficients of Daubechies D4 wavelet are given by h 0 = - 0 . 1830127, h 1 = - 0 . 3169873, h 2 = 1 . 1830127, h 3 = - 0 . 6830127 and wavelet coefficients have the relationship as g 0 = h 3 , g 2 = -h 2 , g 3 = h 1 and g 4 = h 0 . Equations (21) and (22) gives the scaling and wavelet function of Daubechies wavelet respectively
d i = h oS2l + h 1S2l+1 + h 2S2i+2 + h 3S2l+3 (21)
Ci = 9 oS2i + S 1S2i + 1 + 9 2S2i+2 + 9 3S2i+3 (22)
-
iii. Symlets
Symlets are the least asymmetric wavelets. The solutions for wavelet given by Daubechies are not always specific and have peak smoothness. The purpose of the Daubechies is to bring on symmetry to the induced Symlets. The confinement that has been evoked into Symlets are orthogonal, consolidated support filter length of N=2p. They have ‘p’ vanishing moments and are linear phase.
-
iv. Coiflets
Coiflets were named after R. Coifman is the orthonormal filter banks which are having maximum number of vanishing moments for scaling and wavelet functions. For compression and denoising applications, it is necessary to have maximum vanishing moments at the analysis filter banks and to limit the functions to have the smoothness at the synthesis filter banks. These are obtained by dividing vanishing moments between wavelet and scaling operations.
v. Bi-orthogonal Wavelets
4. Related Works
5. Proposed Method
Bi-orthogonal wavelets are the wavelets with linear phase. Linear phase is necessary for signal as well as image reconstruction. For decomposition and reconstruction, two wavelets are used rather than single wavelet for multiresolution analysis. Sparse representation is possible with greater number of vanishing moments at the same time smoother wavelet is used for reconstruction.
A comparative analysis of various thresholding methods for image denoising and compression is presented in [11]. In this research, the spatial filtering and wavelet coefficients thresholding methods are used. Wavelet based methods such as Bayes Shrink, Feature-Adaptive Shrink are good at denoising thereby obtaining high PSNR and less MSE.
In [12], a comparative study has been made on global and local threshold methods after wavelet decomposition. If level of decomposition increases percentage zeroes also increases without thresholding in the detailed sub-bands which ranges less compared to approximation sub-band thereby filtering more details. Hence instead of using global threshold with the limited values local thresholding gives better results. There is a good trade-off between PSNR and compression is obtained using local thresholding methods.
N.S.A.M Taujuddin et.al aims at image compression by calculating wavelet detail coefficients threshold at wavelet sub-bands [13]. Discrete Wavelet Transform (DWT) is applied to obtain vertical, horizontal and diagonal sub-bands. By applying standard deviation method, threshold value for each sub band is determined. Detail coefficients greater than threshold are retained by discarding other values. For each image assorted threshold values are applied and obtain nearzero coefficients without degrading the image quality.
In 2018, an algorithm is developed to improve image compression by applying wavelet and fractional transform with three main considerations [14]. Selection of the wavelet decomposition is first thing to consider with Daubechies wavelets as mother wavelet. Secondly 1D fractional DCT is applied to the LL sub-band for encoding and compression. Finally, detailed sub-bands are encoded with appropriate scale and only non-zero values are retained. This method achieves higher compression compare to other methods Medical Image Compression is achieved by the combination of Discrete Wavelet Transform and Vector Quantization by applying thresholding between the two techniques [15]. Wavelet coefficients are generated and the values below threshold are zeroed to increase the efficiency and also maintaining the quality of the image. The desired size of code book consists of default code word having zeroes and finally, for encoding, the Huffman encoding algorithm is used. Thresholding does not affect the quality of the image and its very negligible.
The sparse representation of the image is an essential to the digital image. The method used here is to retain few approximation coefficients to represent an image. The skin cancer images used for experimentation are taken from [16]. In the proposed method, all the images used for experimentation are in tiff file format and size 450 x 600 pixels. For simulation 20 skin cancer images are taken. The one level of wavelet decomposition is applied. Wavelets applied are from the families of Bi-orthogonal, Daubechive, Symlets Coiflets and they are applied on each image. The main intention is to reduce the number of approximation coefficients by using global threshold. The coefficients which is below the threshold value are set to zero and also the value above threshold are left as it is. A global threshold value of 80, 100, 120 are used to reduce the number of approximation coefficients by considering the quality of the image. The retained number of coefficients are counted after applying each wavelet. compressed file size, MSE, PSNR, and SSIM are calculated.
Following are steps involved in this proposed technique:
Step 1: Read an input image.
Step 2: Convert the input image to gray image given by the equation
Gray = (0.299R + 0.587G + 0.114B)
Step 3: Apply 2-D forward wavelet given by the equation
djk = £(/(№) (23)
where, Tjk(t) = 2J/2T(2jt - k)
Step 4: Apply threshold (80,100,120) after decomposition
Step 5: Make all approximation coefficients to zero suppose it is less than the threshold.
Step 6: Retain the number of coefficients which are greater than threshold which represents the predominant information
Step 7: Apply various standard wavelets available
Step 8: Count the retained approximation coefficients in all the images after applying different types of wavelets
Step 9: Calculate MSE using equation (24)
Mgg _ I. M,NUi (m,n)-l 2 (rn-n)].2
MN
Step 10. Calculate PSNR for all the images with different threshold values using equation (25)
PSNR = 10log1Q^ (25)
where, Ip is the max[I1(m, n)]
Step 11. Calculate SSIM using equation (5)
Step 12. Calculate compression efficiency and compression success rate using equation (26)
( 1- l; ) X100 (26)
which gives the success rate in percentage.
6. Results and Discussion
Skin cancer images used for experimentation are in the tiff file format. There are 20 medical skin cancer images are considered and taken from [16] for experimentation. One level of decomposition is applied using DWT and only LL band is considered and a global threshold is applied to reduce the number of approximation coefficients which are in the dynamic range for each image. Then the compressed image is obtained by applying IDWT with the reduced approximated coefficients along with detail, vertical and horizontal coefficients. Results are obtained for different threshold values like 80, 100 and 120. In each threshold value biorthogonal 3.1 wavelet gives reduced file size compare to all other wavelets.
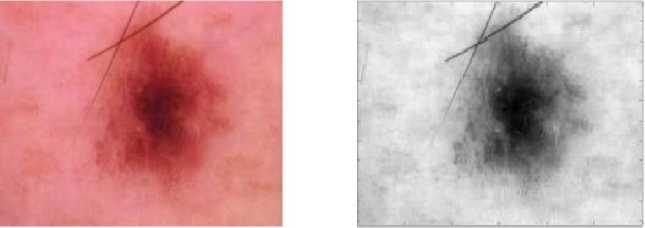
Fig. 4. (a) Skin Cancer Image (b) Approximated Coefficients.
Fig.4(a) depicts the skin cancer image considered for experimentation and Fig.4(b) depicts approximated coefficients of the input image after applying DWT. The count of least number of approximation coefficients for each wavelet after applying threshold value, MSE, PSNR, and SSIM are also calculated. Here, Bior3.1 wavelet provides the least number of approximation coefficients for each image considered compared to the all other types of wavelets for threshold value of 80,100 and 120. Therefore, Bior3.1 wavelet provides the least number of coefficients to compactly represents the image compared to the all other types of wavelets. 5(a) gives the image obtained considering only the significant coefficients above threshold and vanishing remaining coefficients below the threshold for image given in 4(a). and Image 5(b) gives compressed image after applying IDWT of reduced approximation coefficients with detail, vertical and horizontal coefficients for image given in 4(a). Fig. 6 depicts the plot of compressed file size for the five test medical images considering all the 40 wavelets. Then a comparative analysis is done by applying different threshold values for all Skin Cancer Images by calculating least number of coefficients, MSE, PSNR and SSIM using all families of wavelets like bior, dbs, symlets and coiflets
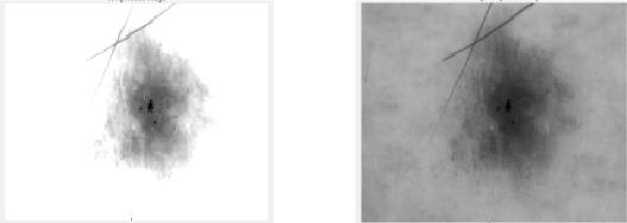
Fig. 5. (a) Image of Retained Approx. Coefficients (b) Compressed Image.
Fig.6 depicts the compressed files size of five skin cancer images considered for experimentation. Reduced compressed file size is obtained for Bior3.1 compared to other wavelet which also retains less number of approximation coefficients compare to other wavelets. The same results are also obtained with the threshold value of 80 and 100. Results with the threshold value of 120 is presented here.
Compressed File Size in KB
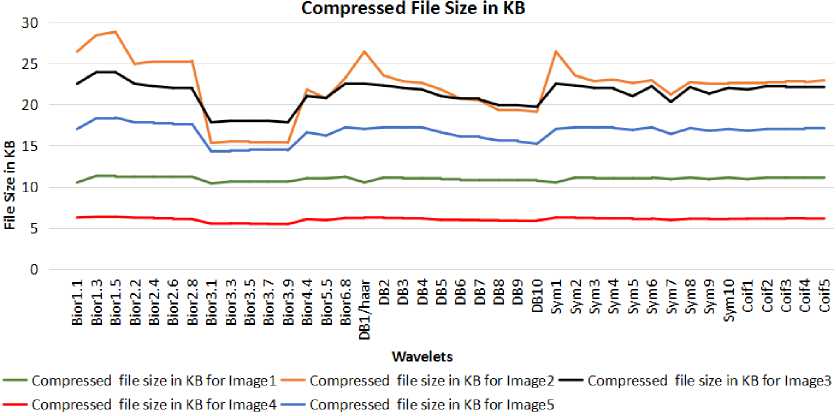
Wavelets
---Compressed file size in KB for Image 1---Compressed file size in KBforlmage2---Compressed file size in KBforlmage3 ---Compressed file size in KB for Image4---Compressed file size in KB for Images
Fig. 6. Compressed File Size of Skin Cancer Images.
The Fig.7, 8, 9, 10 and 11 depict the count of retained nonzero filter coefficients after DWT, MSE, PSNR, SSIM and Compression Efficiency respectively after applying all wavelets to five skin cancer images with the threshold value of 120. After applying various wavelets, Bior3.1 wavelet provides the least number of coefficients compared to other types of wavelets for all the threshold values considered. After exhausted experimentation it has been found that with 20 medical images applied with 40 wavelets on each image, with three different threshold values gives better compression for the Biorthogal wavelet compare to other.
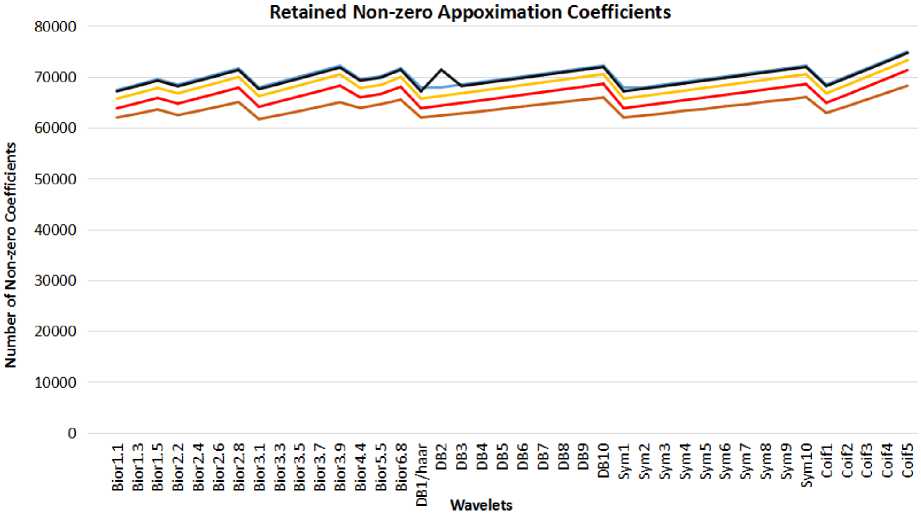
Retained Non-zero Approx Coefficients for Image 1
---Retained Non zero Approx Coefficients for Image 3
---Retained Non-zero Approx Coefficients for Image 5
---Retained Non zero Approx Coefficients for Image 2
---Retained Non zero Approx Coefficients for Image 4
Fig. 7. Retained Non-zero Coefficients for Skin Cancer Images.
The MSE, PSNR, SSIM are also calculated after compression for all the images considered. Fig. 8 and 9 depicts less MSE and better PSNR using Bior3.1 wavelet.
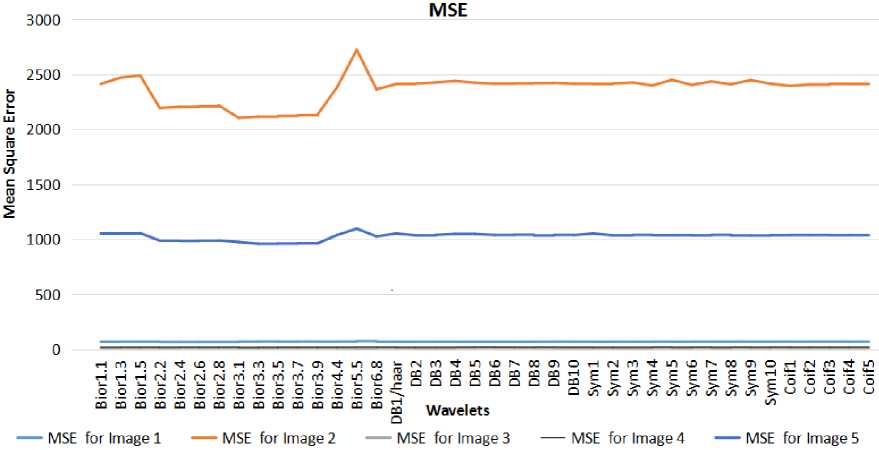
Fig. 8. MSE of Skin Cancer Images.
Compression success rate is calculated with all threshold values. And Compression success rate with threshold value of 120 is plotted in Fig. 11 where better success rate is achieved for Bior3.1 compare to other wavelets.
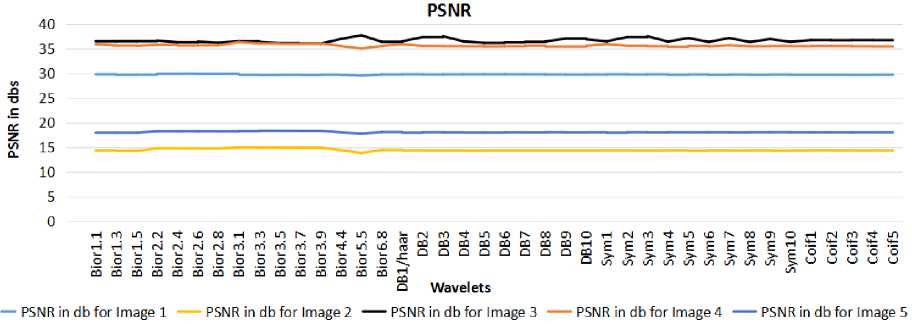
Fig. 9. PSNR of Skin Cancer Images.
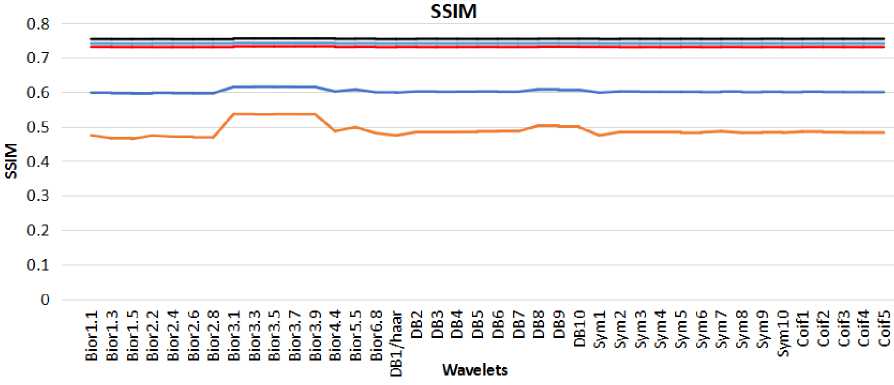
— SSIM for Image 1 — SSIM for Image 2 ---SSI M for Image 3 --- SSIM for Image 4 ---SSIM for Image 5
Fig. 10. SSIM of Skin Cancer Images.
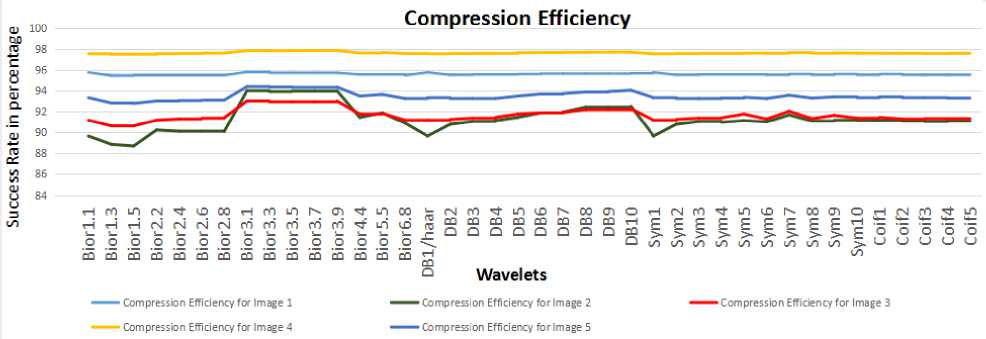
Fig. 11. Compression Efficiency of Skin Cancer Images.
7. Conclusions
In this paper, various wavelets such as Bi-orthogonal, Daubechies, Symlets and Coiflets are considered for experimentation. There are 20 skin cancer images of size 450 x 600 16are considered. The Bior3.1 wavelet provides the better compression ratio retaining good PSNR compared to other wavelets. Reduced file size or better compression is obtained for Biorthogonal3.1 wavelet. The compressed image obtained from the experimentation is presented in Fig. 5. Reduced compressed file size for Bior3.1 is presented in Fig. 6. The PSNR, MSE, SSIM and compression efficiency are calculated are plotted in the figures from 7 through 10. Bior3.1 wavelet gives better PSNR and reduced MSE values compare to other wavelets. Fig. 11 depicts better compression efficiency after using Bior3.1. Coiflets takes more number of coefficients compared to other wavelets hence not suitable for compact representation. From the exhaustive experimentation, it is found that the above said wavelet gives optimum results and is best suitable for the compact representation of medical skin cancer images. Representation techniques that can adapt based on the characters of given image can be explored in future to further improve the efficiency of compression.
References Investigation of Wavelets for Representation and Compression of Skin Cancer Images
- Gilbert Strang, Truong Nguyen, “Wavelets and Filter Banks”, Revised Edition, 1997
- Ana Sovi´c, Damir Serˇsi´c, ” Adaptive Wavelet Image Decomposition using LAD Criterion”, 19th Europian Signal Processing Conference, (EUSIPCO 2011) Barcelona, Spain, pp.594-598, August - September 2, 2011
- Pavithra D R, Sudarshan Patil Kulkarni, “A Review on Various Image Representation Techniques and Outcomes”, IJPRET, Vol 6 26-38, 2013
- Khalid Sayood, “Introduction to data compression”, Fourth Edition, 2012.
- S.G. Mallat, A theory for multi-resolution signal decomposition: the wavelet representation,IEEE Pattern Anal. Machine Intell. 11 (7) (1989) 674693.
- https://dicom.nema.org/medical/dicom/current/output/chtml/part01
- https://www.cancer.org/cancer/skin-cancer/skin-cancerimage -gallery.html
- Shivangi Jain, Vandana jagtap, Nitin Pise, “Computer aided Melanoma skin cancer detection using Image Processing”, International Conference on Intelligent Computing, Communication & Convergence, Proceedings Computer Science 48, 735 – 740, 2015.
- Daubechies, “Image coding using wavelet transform”, IEEE Trans. on Image Proc., 1 (2):205-220, April 1992
- Antonini M, Barlaud M, Mathieu P, Daubechies I. Image coding using wavelet transform. IEEE Tranactions on Image Processing
- Fei Xiao, Yungang Zhang, “A Comparative study on Thresholding methods in Wavelet” Elsevier, Procedia Engineering 15
- K S. Selvanayaki “Study and Analysis of wavelet based image compression techniques” International Journal of Image Processing and Vision Sciences (IJIPVS) ISSN(Print): 2278 – 1110, Vol-1 Iss-3,4 ,2012
- N.S.A.M Taujuddin, Rosziati Ibrahim, Suhaila sari,”Wavelet coefficients reduction method based on standard deviation concept for high quality compressed image” Journal of Theoretical and Applied Information Technology, ISSN: 1992- 8645, Vol.79. No.3, 2015
- Naveen kumar. R, B.N. Jagadale and J.S. Bhat, An Improved Image Compression Algorithm using Wavelet and Fractional Cosine Transforms, I.J. Image, Graphics and Signal Processing, 19-27, 2018
- M. Vettereli and J. Kovaˇcevi´c, ‘Wavelets and sub-band Coding’, Prentice Hall, Englewood Cliffs, NJ, 1995.
- https://www.isic-archive.com/#!/topWithHeader/onlyHeaderTop/galler
