Investment process in the region: the new century - old problems

Author: Gubanova Elena Sergeevna, Vorontsova Tatyana Vladimirovna
Journal: Economic and Social Changes: Facts, Trends, Forecast @volnc-esc-en
Section: Problems of the expanded reproduction
Article in issue: 3 (11) т.3, 2010.
Free access
The article deals with the investment process in the Vologda oblast, its peculiarities and problems in comparison with the North-West federal district and Russia. The ways to overcome the low investmentactivity with the increasing role of the government regulation in the region are determined.
Vologda region, investments, investment process, government regulation
Short address: https://sciup.org/147223208
IDR: 147223208 | UDC: 330.322(470.12)
Text of the scientific article Investment process in the region: the new century - old problems
Nearly twenty years separate us from the beginning of radical economic reforms in Russia relating to the transition to the market economy, but the subject matter related to investment activity does not lose its importance, moreover, with each new step in the development of the market economy it is becoming increasingly important. Today we have sufficient time interval in our arsenal in order to establish certain regularities of the investment process and its problems, as well as to determine the necessary approaches to solving the identified problems.
Investment sphere of the country in the 1990’s was in the grip of a deep crisis, which is reflected in the unprecedented decline in investment in the country as a whole and in individual regions. After a four-fold decrease in the volume of investment in the first half of 1990 over the next few years there was stagnation in which the decline in investment continued. These phenomena were accompanied by falling rates and volumes of production in all sectors of the economy, and lower living standards. The default of 1998 for national and regional economies became a turning point, because after it the recovery of the investment process began, but today we can say that a number of opportunities has not been realized.
By this time in the investment area serious problems had been exposed which were
hindering the socio-economic development of the country as a whole and its individual regions. Their solution required substantial material and financial resources, strong political will and time, which, as we understand it today, were limited by almost ten years interval. Without overcoming the crisis in the investment field, caused by the transition to a new management model, in 2008, there is an immersion in a new wave of crisis. We note here that there were significant changes in the investment process during years preceding a new crisis, but many problems are unresolved, which are likely to hamper the withdrawal from the new wave of crisis. We try to identify these “pain points” by analyzing national statistics on the Russian Federation, North-West federal district and the Vologda region.
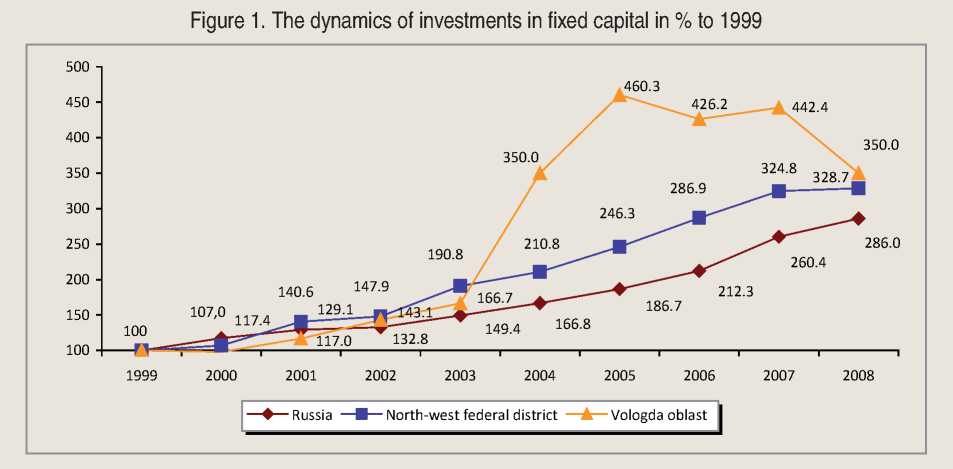
One of the most important features of the investment process of the post-default period is its stable positive dynamics, as it is shown in figure 1.
This graphic illustrates how fairly synchronously investment processes develop in Russia, in the regions of the North-West federal district and in the Vologda region. Based on the data we can state that there was a significant increase in the level of investments in 1999. A sharp rise in investments in the Vologda region is particularly impressive that allowed the region to improve its ranking among the regions of Russia, although through the neighbourhood its place remains quite modest (tab. 1). In 2008 investment dynamics sensitively reacts to the approach of the financial crisis, which is reflected in a slowdown of investment and change of its vector. The latter becomes particularly noticeable in the Vologda oblast.
Analyzing the data presented above, there is the: how did such a substantial rise in investment in the region reflect on the qualitative characteristics of the investment flow, were there prerequisites for the transition to a qualitatively new stage of development?
In connection with the transition to the market economy the structure of investment by ownership patterns has changed (tab. 2) . We should recognize the emergence of a substantial number of new investors as a good thing, because this is the evidence that the investment market of the region is dynamically developing. Over the past ten years the proportion of private investors has significantly increased, for which the Vologda oblast is becoming increasingly attractive as a ground for investing.
Changes in the structure of investment by ownership patterns have led to changes in the structure of funding sources (tab. 3) . They have become more diverse, but the following
Table 1. Rating of the Vologda region in investments in fixed capital per 1000 people
|
2000 |
2003 |
2004 |
2005 |
2006 |
2007 |
2008 |
|
|
In the Russian Federation |
|||||||
|
North-West federal district |
2 |
3 |
3 |
3 |
3 |
3 |
N/d |
|
Republic of Karelia |
21 |
31 |
26 |
34 |
41 |
52 |
- |
|
Komi Republic |
8 |
11 |
13 |
8 |
7 |
14 |
- |
|
Arkhangelsk oblast |
28 |
15 |
14 |
15 |
9 |
8 |
- |
|
Vologda oblast |
32 |
26 |
10 |
9 |
12 |
16 |
- |
|
Kaliningrad oblast |
51 |
28 |
24 |
23 |
20 |
24 |
- |
|
Leningrad oblast |
14 |
9 |
9 |
10 |
8 |
11 |
- |
|
Murmansk oblast |
25 |
25 |
36 |
31 |
31 |
44 |
- |
|
Novgorod oblast |
31 |
34 |
47 |
41 |
33 |
38 |
- |
|
Pskov oblast |
64 |
64 |
73 |
79 |
81 |
79 |
- |
|
St. Petersburg |
27 |
12 |
18 |
16 |
16 |
13 |
- |
|
In the North-West federal district |
|||||||
|
Republic of Karelia |
3 |
8 |
7 |
8 |
9 |
9 |
9 |
|
Komi Republic |
1 |
2 |
3 |
1 |
1 |
4 |
2 |
|
Arkhangelsk oblast |
6 |
4 |
4 |
4 |
3 |
1 |
1 |
|
Vologda oblast |
8 |
6 |
2 |
2 |
4 |
5 |
6 |
|
Kaliningrad oblast |
9 |
7 |
6 |
6 |
6 |
6 |
5 |
|
Leningrad oblast |
2 |
1 |
1 |
3 |
2 |
2 |
3 |
|
Murmansk oblast |
4 |
5 |
8 |
7 |
8 |
8 |
7 |
|
Novgorod oblast |
7 |
9 |
9 |
9 |
7 |
7 |
8 |
|
Pskov oblast |
10 |
10 |
10 |
10 |
10 |
10 |
10 |
|
St. Petersburg |
5 |
3 |
5 |
5 |
5 |
3 |
4 |
Table 2. Investments in fixed capital of the region by ownership, %
Great expectations were associated with attraction of foreign capital into the economy of
Russia and its regions. But practice has shown that serious capital comes only when there is confidence of recipients in themselves. Therefore, more significant (in the scale of Russia) flows of foreign capital were recorded in the period after 1998. The dynamics of foreign investment directly depends on the structure of the region's economy, as industries of the commodity sector and the primary processing are still more attractive for foreign investors.
The low proportion of foreign investments in the economy of the region shows a decline of investment attractiveness of the Vologda
Table 3. Investment structure on funding sources, %
We note here that, in the Vologda region there were significant investments of foreign capital in 2004, but it was presented almost by loans taken out from the USA and UK in the development of the metallurgical industry. In spite of the positive features of the period 2004 – 2008, the volume of foreign capital has not grown, although the region has good conditions for foreign capital. The following prerequisites can be identified: the good transport position, the stable social and political climate, prevalent economic potential, developing infrastructure. In general, we should recognize the structure of foreign capital irrational from the perspective of the region, since it has small proportion of direct investments.
A good indicator of changes in the structure of the economy is the technological structure of investments, which forms the ratio between active and passive parts of the basic production assets. The higher the share of machinery and equipment, the higher the proportion of the active part of basic assets, which, of course, creates opportunities for high-quality technological progress. During the monitoring period in the technological structure of the investments in the region (fig. 2) there were no significant changes: the cost of building and construction works is still high. This leads to the fact that today in the region the share of equipment in operation for five years reduced at times, while over two-thirds of all machinery and equipment operate more than 15 years (this indicator is twice higher than in developed countries), the average age of equipment in the industry is 20 years.
Reproductive investment structure of the Vologda region for 2000 – 2008 has the opposite tendencies (tab. 5) . On the one hand, the
Table 4. The volume of foreign investments in the economy of the region by types, million USD
|
Foreign investment |
2000 |
2003 |
2004 |
2005 |
2006 |
2007 |
2008 |
2008 to 2000, times |
|
Total |
19.9 |
286.6 |
1108.3 |
430.96 |
161.47 |
177.84 |
4142.79 |
208.2 |
|
Direct |
9.2 |
18.9 |
1.0 |
14.59 |
18.61 |
55.76 |
5.87 |
0.63 |
|
Portfolio (shares) |
2.6 |
1.0 |
1.8 |
10.99 |
22.37 |
2.53 |
0.15 |
0.06 |
|
Other investments (loans) |
8.2 |
266.7 |
1105.6 |
405.38 |
120.49 |
119.55 |
4136.76 |
504.5 |
|
Percentage of total investments |
0.2 |
4.1 |
4.4 |
5.0 |
0.7 |
5.2 |
1.7 |
8.5 |
Table 5. Reproductive structure of investment in fixed capital, % to total
|
Industry |
2000 |
2003 |
2004 |
2005 |
2006 |
2007 |
2008 |
2008 to 2000 |
|
Investment in fixed capital |
100 |
100 |
100 |
100 |
100 |
100 |
100 |
- |
|
Modernization and reconstruction |
69.5 |
58.9 |
43.7 |
33.7 |
29 |
23.5 |
26.6 |
38.3 |
|
New Construction |
30.5 |
25.8 |
46.5 |
58.5 |
62.5 |
65.8 |
58.1 |
190.5 |
|
Acquisition of fixed assets |
- |
15.3 |
9.8 |
7.8 |
8.5 |
10.7 |
15.3 |
- |
Figure 2. Technological structure of investment in fixed capital, in %
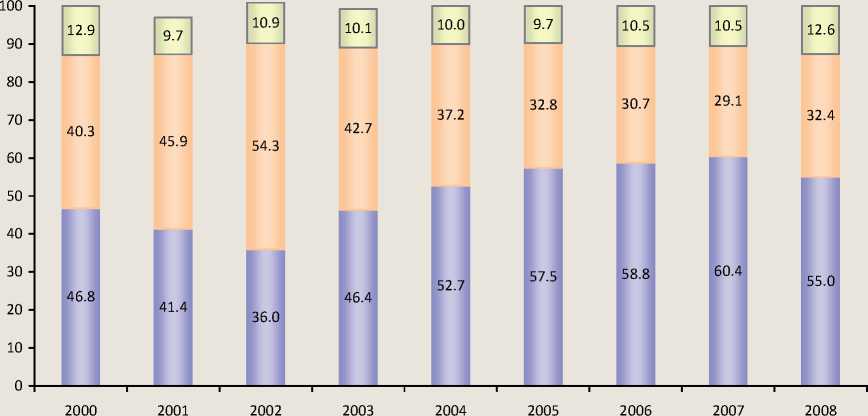
□ BCW ■ Machinery, equipment □ Other capital works and costs
declining share of capital investments allocated for reconstruction and technical re-equipment, which can lead to the preservation of a high degree of depreciation of production assets. This, in turn, indicates that the volume of investments is mainly determined by minimal technological needs and investment, preserving technological backwardness, can not become a support for the region’s economy. On the other hand, the share of investment for their accumulation increases (new construction) that can be considered as the beginning of the transition to innovative development of the economy. However, in this financial crisis the increase in the share of investment for new construction is likely to lead to an increase in the number of unfinished construction projects.
One of the major structural characteristics of the investment process, reflecting the direction of investment flows, is the branch structure of investment, which transformation reflects the trends of the country’s economic policy. The greatest changes occurred in the period of shock therapy, when, because of the liberalization of prices, some industries have lost the financial resources that did not allow to compete with the influx of imported products. Since the second half of 1990, the intensity of changes in the sectoral structure of investment has declined, however, they continue to be evident.
First of all, we note that the movement of investments is formed under the following circumstances:
-
• capital flows to the industry with the highest yield;
-
• the movement of capital is carried out in those segments of the economy where there is a guarantee for sustainable business income;
-
• direction of investment is determined by the economic spheres, which develop under the multiplicative effect of “growth potentials”;
Table 6. The sectoral structure of investments of the Vologda region, %
|
Sector |
2000 |
2003 |
2004 |
2005 |
2006 |
2007 |
2008 |
2009 |
2008 to 2000, p.p. |
|
Industry |
40.3 |
53.3 |
50.0 |
42.3 |
32.7 |
31.5 |
37.1 |
39.7 |
98.5 |
|
Agriculture |
5.9 |
5.7 |
2.3 |
2.5 |
3.6 |
4.5 |
4.4 |
1.5 |
25.4 |
|
Construction |
1.5 |
3.4 |
0.7 |
0.6 |
0.9 |
1.3 |
1.3 |
0.8 |
53.3 |
|
Transport and communications |
30.4 |
21.0 |
39.3 |
47.2 |
53.9 |
49.9 |
39.9 |
42.8 |
140.8 |
|
Trade |
1.6 |
3.1 |
0.9 |
0.8 |
1.1 |
2.2 |
1.2 |
1.1 |
68.8 |
|
Other |
20.3 |
13.5 |
6.8 |
6.6 |
7.8 |
10.6 |
16.1 |
14.1 |
69.5 |
|
Total |
100 |
100 |
100 |
100 |
100 |
100 |
100 |
100 |
- |
Table 7. Investment structure in fixed capital by industries,%
|
Branch |
2003 |
2004 |
2005 |
2006 |
2007 |
2008 |
2008 to 2003, p.p. |
|
Industry |
100 |
100 |
100 |
100 |
100 |
100 |
- |
|
Metallurgical production |
57.8 |
70.1 |
71.9 |
58.9 |
43.3 |
55.3 |
95.7 |
|
Chemical production |
19.3 |
10.3 |
4.7 |
13.4 |
33.4 |
21.8 |
113.0 |
|
Wood processing |
6.3 |
2.5 |
3.2 |
4.1 |
9.8 |
7.5 |
119.0 |
|
Food production |
4.8 |
7.4 |
6.0 |
3.0 |
3.1 |
4.7 |
97.9 |
|
Machinery and equipment production |
1.7 |
0.9 |
0.4 |
1.5 |
1.2 |
1.5 |
88.2 |
|
Textile production |
0.3 |
0.7 |
0.3 |
0.3 |
0.6 |
0.5 |
166.7 |
|
Pulp and paper production |
1.0 |
0.1 |
0.1 |
0.6 |
0.8 |
0.7 |
70.0 |
|
Other non-metallic production |
6.9 |
4.5 |
6.3 |
5.7 |
2.6 |
4.4 |
63.8 |
|
Other industries |
1.9 |
3.5 |
7.1 |
12.5 |
5.2 |
3.6 |
189.5 |
-
• spatial orientation of investment flows is formed in the direction of economic centers and zones of influence with more developed infrastructure and providing more income with less investment.
The sectoral structure of investments of the Vologda oblast (tab. 6 and tab. 7) shows the unbalanced development of the regional economy.
During the period of economic transformation the investment in agriculture reduced significantly. This trend can be seen as unfavorable, because decline in investment in agriculture can affect the country’s food self-sufficiency. This fully applies to the Vologda region, which has all conditions for the production of essential foodstuffs, not only for domestic consumption but for export outside the region. The share of investment in construction in the oblast also remains at a relatively low level, although the industry is of great importance to investment activities. As for such an important product of the construction industry, as construction of residential houses, the share of investment in housing construction in the area tends to decrease. In the sectoral structure the investment of transport and communications is marked out on the volume. We note here that the jump in the volume of investment in figure 1 is the result of increased investments in this sector. Of course, for infrastructure development of the oblast these investments are important, even though much of them are related to the financing of pipeline construction linking gas deposits in Siberia with Western Europe.
Data of table 6 and table 7 give a visual representation of the direction of investment flows. We conclude that the basic income country (and some regions, including the Vologda region) extract from oil exports, raw materials and metals; part of these revenues in the form of investment is in the same industry. We also note that with the visible growth of investment there is no noticeable change in the basic proportions of the economy and industry.
It should be emphasized that the decline in shares of such industries as machinery, forest industry, and light industry looks oppressive, as for the development of these industries in the country and in the Vologda region there are all the necessary conditions (natural resources, skilled labor forces, scientific and technical basis). In this case the products of these industries are aimed at domestic consumers, so their development will contribute to the accumulation process at the regional level. Also we should note that the share of investment in industries that define scientific and technological advance is still not high enough.
As for the territorial structure, it remains asymmetrical, and does not create opportunities for the development of municipalities of the Vologda region (tab. 8) .
The data in this table very clearly show that for the period 2000 – 2009 much of the investment still goes to two major industrial centers of the oblast – Vologda and Cherepovetz. Most of the municipalities of the region do not receive sufficient investment that in the future can adversely affect the functioning of their economies.
The following table shows the grouping of the municipal entities of the region in two important coordinates, they are: the share of investment, which accounts for a certain municipality, and the index of physical volume of investment, which allows to make a comparable assessment of investments over a period of time (tab. 9) .
The analysis of the tables shows that over the past ten years in some districts-outsiders (investment share in the overall volume is less than 1%) investments increases, but these rates
Table 8. Grouping of municipalities of the Vologda region in terms of investment, as % of total
|
More than 10% |
From 10% to 3% |
From 3% to 1% |
Less than 1% |
|
Year of 2000 |
|||
|
Vologda Cherepovetz |
District of Vologda District of Vytegra |
District of Belozersk District of Vashki District of Veliky Ustyug District of Gryazovetz District of Sokol District of Chagoda District of Cherepovetz District of Sheksna |
District of Babaevo District of Babushkino District of Verkhovazh’ye District of Vozhega District of Kadui District of Kirillov District of Kichmengsky Gorodok District of Mezhdurech’ye District of Nikolsk District of Nyuksenitsa District of Syamzha District of Tarnoga District of Tot’ma District of Ust’-Kubinskoye District of Ustyuzhna District of Kharovsk |
|
Year of 2009 |
|||
|
Vologda Cherepovetz |
District of Veliky Ustyug District of Vytegra District of Sheksna |
District of Vologda District of Gryazovetz District of Cherepovetz |
District of Babaevo District of Babushkino District of Belozersk District of Vashki District of Verkhovazh’ye District of Vozhega District of Kadui District of Kirillov District of Kichmengsky Gorodok District of Mezhdurech’ye District of Nikolsk District of Nyuksenitsa District of Sokol District of Syamzha District of Tarnoga District of Tot’ma District of Ust’-Kubinskoye District of Ustyuzhna District of Chagoda District of Kharovsk |
Table 9. Grouping of municipalities of the region by the share of investments and the index of physical volume
The share of investment to total investment in the region (%)
|
sS E E |
More than 10% |
From 3% to 10% |
From 1% to 3% |
Less than 1% |
|
|
More than 300% |
Vologda |
District of Veliky Ustyug District of Sheksna |
District of Kharovsk |
||
|
More than 200% |
District of Vytegra |
District of Verkhovazh’ye District of Mezhdurech’ye District of Syamzha District of Ust’-Kubinskoye District of Ustyuzhna |
|||
|
More than 100% |
Cherepovetz |
District of Vologda District of Gryazovetz District of Cherepovetz |
District of Kichmengsky Gorodok District of Nyuksenitsa District of Sokol District of Tot’ma |
||
|
Less than 100% |
District of Babaevo District of Babushkino District of Belozersk District of Vashki District of Vozhega District of Kadui District of Kirillov District of Nikolsk District of Tarnoga District of Chagoda |
Note. A group of districts having extremely low investment rates is in italics.
are clearly insufficient to overcome the one percent barrier and enter the path of sustainable development. The group of regions located in the lower right square arouses anxiety, which investment rate is extremely small.
Thus, in the investment sphere of the Vologda region there are profound crises related to the establishment of the market economy. However, in the period from 1999 to 2009 there were positive changes, which include the following:
-
1. Positive dynamics of investment in recent years and generally increasing volume of investments have improved the proportion of gross fixed capital formation in GRP.
-
2. There are new owners-investors, who have interests in our region and are ready to invest in the development of a number of industries.
-
3. Financing sources of investment are more diverse, amounts of foreign capital are increasing.
These positive characteristics of the investment process allow positioning the Vologda region, which belong to the territories compris- ing the “investment core” of the country. The region has sufficient investment potential and decreasing investment risks, as is reflected in the ratings annually carried out by the magazine “Expert”.
However, along with the positive characteristics there is a number of negative ones, the overcoming of which would make the investment process even more dynamic. They are:
-
1. Lack of stability in the positive dynamics of the investment process.
-
2. Insufficient investment in the sectors of the economy of the region, capable to alter its appearance.
-
3. Irrationality in terms of development prospects of the oblast of industrial, technological and territorial structure of investment, as well as the structure of foreign capital.
Finding of ways to overcome the crisis in the investment area is part of one of the most serious discussions throughout the period of transformation, it concerns the question of the relation between market and government regulatory tools of economic processes (including investment).
In essence, this is a struggle between two conceptions of socio-economic development of the country, which oppose the market and the state. This question nonpluses us.
We try to look at this problem from another side. The basis for the development of complex systems is the interaction of self-organization and the organization. The character feature of the process of self-organization is the spontaneous nature, while the organization is associated with the deliberate ordering human activities. Hence, in an economic research the problem of the relation of spontaneous self-organization (in fact, they are market processes) and deliberately organizing human role in them (it can be represented by functioning of state institutions) has the essential importance. Hence, there is an important methodological conclusion, based on the fundamental postulates of the system and synergistic approach: in terms when a system is undergoing a profound transformation and is in unbalanced state, when choosing regulatory tools taking into account of motion trends of the system and analysis of its response to external exposures becomes necessary. Moreover, a system in an unstable state has increased sensitivity to even small incidents that may have a decisive influence on the trajectory of its development.
Recognition of the investment sector in the region as complex and open system that has the ability to develop, but is characterized by dependence on external conditions, suggests that its evolution follows the laws inherent in this class of systems. We especially note that during periods of instability "an unpredictable behavior of people, endowed with freedom of will may play the role of the destabilizing factor" that can cause unpredictable behavior of complex system. But an accident does not negate determinism, moreover, it complements it. This is manifested in the fact that at the point where there is a choice of development alternatives, the field of possible paths of development is limited by the internal properties of the system. The fact that ways of evolution of complex systems are not the only ones, and there are a range of possible paths within the field of possibilities, is outlined by E. Knyazeva [4], S. Kurdyumov [2], V. Budanov [1]. We agree with these authors, who affirm that there is a higher type of determinism – determinism with understanding of the ambiguity of the future and the possibility of entering the desired future, i.e. determinism, which strengthens the role of man. This pattern of complex system development has specific requirements for management. Taking into account the above information, the following requirements to the nature of the state regulation of the investment process in the region, which should be active, effective, “soft” and meets the following criteria, were formulated:
-
1. State regulation should be based on the functioning laws of the system.
-
2. State regulation should force the synergetic effect, in which the volume of the result is determined by the volume of investment funds, and how the used funds and management practices correspond to the internal properties of an object for investment, determining its susceptibility to influences as well.
-
3. Detection of investment objects, initiating cooperative effects, reduced to the justification and selection of investment priorities. Support for selected objects of investment by the state operates as the control parameter, a trigger mechanism for self-organizing processes (on the principle of the multiplier). These investment objects are called to play the role of a link, and if it is grasped, you can pull the whole chain.
-
4. State regulation should be timely.
-
5. The regulatory system should be seeking feedback from the investment sphere, to prevent destructive and strengthen creative tendencies.
The past years, according to some authors, were a period of missed opportunities. So today, taking into account the new system calls of the “turbulent” decade, we need more active and substantiated steps in the direction to sustainable development of the country as a whole and its individual regions.
References Investment process in the region: the new century - old problems
- Alexeev, A. Investment structure: is it the best?/A. Alexeev, N. Kuznetsova//The Economist. -2010. -№ 3. -Pp. 6-19.
- Budanov, V.G. The principles of synergetics and crisis management/V.G. Budanov//Synergetic paradigm. Man and society in conditions of instability. -M.: Progress-Tradition, 2003. -Pp. 86-98.
- Gubanova, E.S. Formation and implementation of regional investment policies/E.S. Gubanova. -Vologda: Legia, 2007. -300 p.
- Zamaraev, B. How cloudy were “cloudy” years?/B. Zamaraev//Economics. -2010. -№ 2. -Pp. 53-65.
- Investment in fixed capital in cities and regions of the Vologda oblast in 2009: stat. coll./Vologdastat. -Vologda, 2010. -24 p.
- Investment processes in the oblast: stat. digest/Vologdastat. -Vologda, 2009. -159 p.
- Kapitsa, S.P. Synergetics and forecasts of the future/S.P. Kapitsa, S.P. Kurdyumov, G.G. Malinetskii. -M.: Editorial URSS, 2003. -288 p.
- Knyazeva, E.N. The laws of evolution and self-organization of complex systems/E.N Knyazeva, S.P. Kurdyumov. -M.: Science, 1994. -236 p.
- Korishchenko, K. New challenges in the regulation of the financial sector in the crisis/K. Korishchenko, I. Solov'eva//Economics. -2010. -№ 4. -Pp. 100-113.
- Mau, V. Economic policy in 2009: between crisis and modernization/V. Mau//Economics. -2010. -№ 2. -Pp. 4-26.
- Neshitoy, A. Towards a new model of economic development: the reproductional aspect/A. Neshitoy//The Economist. -2010. -№ 2. -Pp. 10-25.
- The Russian Economy in 2009: rapid decline and slow recovery/I. Borisova, B. Zamaraev, A. Kiyutsevskaya, A. Nazarova //Economics. -2010. -№ 4. -Pp. 24-43.
- Sukharev, O. On the priorities of the policy of modernization/O. Sukharev//The Economist. -2010. -№ 3. -Pp. 20-25.
