Investment processes and structural changes in the economy of old industrial regions of the northwestern federal district

Author: Melnikov Aleksei E.
Journal: Economic and Social Changes: Facts, Trends, Forecast @volnc-esc-en
Section: Regional economy
Article in issue: 2 (62) т.12, 2019.
Free access
In the changing global geopolitical and geo-economic conditions, the issues related to sustainable growth of the national economy, promoting its pronounced development dynamics and providing it with high technology are among the most important directions for Russia's modern economic policy. The priority tasks of national development require an inflow of large-scale investments in the economy, but the question of their rational distribution remains open, so that the attention of investors is directed mainly toward resource-based activities. At the same time, knowledge-intensive industries, which should be at the forefront of new industrialization, are experiencing a clear lack of investment and are in a state of stagnation. In particular, the above is true for a group of Russia's old industrial regions, in which the described situation is even more serious and leads to de-industrialization against the background of insufficient amount of investment at hand. In this regard, the goal of the paper is to analyze investment processes and assess their impact on the changes in the structure of industrial production on the example of old industrial regions of the Northwestern Federal District. We have chosen this object for our study due to the fact that these subjects of Russia occupy one of the worst positions among all old industrial territories according to a number of economic and social parameters. Scientific novelty of our work consists in the need to reveal modern patterns of socio-economic processes and identify structural deformations in the economy. The findings of our study reflect the current state of investment processes and the nature of structural transformations in the old industrial regions of the Northwestern Federal District, taking place against the background of strengthening resource-based industries. Practical significance of the findings is determined by the fact that they contribute to a better understanding of the current socio-economic situation of the sample under consideration and are useful for further study of the specifics of these territories and the problems they face.
Old industrial regions, economic structure, structural changes, industrial production, investment
Short address: https://sciup.org/147224173
IDR: 147224173 | UDC: 338.45 | DOI: 10.15838/esc.2019.2.62.5
Text of the scientific article Investment processes and structural changes in the economy of old industrial regions of the northwestern federal district
Introduction. The structural changes in the Russian economy that have taken place in recent decades as a result of market reforms and destabilization of the external environment have been naturally reflected in the development of old industrial regions. The dependence of these territorial entities on the external economic situation is currently increasing, the technical and technological level of production is shut down, there is a threat of reducing tax revenues to the budget system, reducing consumer demand [1]. Structural transformations have played a significant role in the deformation of material production of old industrial regions, especially high-tech industries, and have become one of the causes of investment drought in it.
Old industrial regions of the Northwestern Federal District1 (hereinafter referred to as OIR NWFD), compared with other regions of this type, are territories of depressive development.
This conclusion is based on the performance of indicators such as GRP (in recent years, the growth amounted to 104.4% against 112.6% in general for all old industrial regions), industrial production (111.3% against 115.3%) and capital investment (98.3% against 114.4%), people employed in the economy (the decline in OIR NWFD was 12% against 2.8% for the entire sample). According to these parameters, OIR NWFD occupy one of the worst positions among all old industrial regions.
Such features of regional development put forward an assumption, according to which the current state of OIR NWFP is determined by both insufficient incoming investment and its structural imbalance. In this regard, the purpose of the study is to analyze investment processes and assess their impact on changes in the structure of industrial production on the example of a separate group of Russian regions characterized by similar socio-economic problems.
Theoretical aspects of the research. A lot of research works are devoted to the study of old industrial regions; they raise a variety of issues of development of these territories. Such attention on the part of the scientific community is due to acute system problems, which in the future may be reflected in the slowdown in the growth of the entire Russian economy. In other words, old industrial regions can turn from development drivers into a “burden”.
Therefore, the scientific attention is concentrated both on the regional economy as a whole, as well as sectoral economy and municipal economy. In the latter case, the emphasis shifts from the regions themselves to single-industry towns, the examples of which cover issues of revitalization, strategic management, organization, priority development areas, demographic sustainability, environmental safety, etc. [5–8].
At the regional level, the search for optimal solutions to ensure economic security and new industrialization, and eliminate acute problems of socio-economic development is particularly relevant [1; 9; 10]. In particular, the researchers note that the most characteristic bottlenecks for many old industrial regions are financial and personnel shortage, low productivity, innovative inertia, predominance of low-level industrial production, high depreciation, slow pace of technical and technological renewal, often – dependence on materials industries, etc. [11-14].
In this regard, research works pay much attention to the improvement of the regional industrial policy and investment optimization. A special role is belong to the issues of increasing the efficiency of interaction between the production sector, the authorities and educational institutions [11; 15]. The features of spatial distribution of productive forces are covered [16]. The state of old industrial regions taking into account institutional, economic, social, organizational, environmental and other factors is still not a downward trend [10–13]. This is largely due to heterogeneous territorial groups under study, as well as the regular need for disclosing modern patterns of socioeconomic processes.
It can be stated that old industrial regions as a research object are now widely covered in the scientific literature. However, there is still insufficient attention to individual territorial groups or regions, which leaves particular problems of socio-economic development out of the focus of the scientific community. This, in turn, prevents the formation of a full image of the state of old industrial regions. We should also note that in light of the increasing development of approaches to analyzing the impact of structural changes on the economic development, the study of transformational changes in the national economy and factors causing them becomes particularly relevant.
Research methods. To achieve the specified goal we use methods of economic, statistical and comparative analysis, generalization. The methodological framework of the research includes the materials of territorial bodies of the Federal State Statistics Service for republics of Karelia and Komi, the Arkhangelsk, Vologda, Murmansk and Novgorod oblasts, data of the Unified Interdepartmental Information and Statistics System, as well as the works of leading economists in regional economy.
A kind of incentive for the research was the publication of B. Zamarayev and T. Marshova “Investment processes and structural restructuring of the Russian economy”, which presents methodological approaches to assessing the structural characteristics of the Russian economy in the context of indicators such as investment, production capacity, GVA [17]. With some assumptions these materials are tested in OIR NWFD.
Due to no access to the initial detailed data for the calculation of the regional sectoral structure of production capacity and GVA in this study, the assessment of structural changes is carried out based on indicators “investment in fixed capital” and “volume of shipped own goods, works and services”. We emphasize that the change in the set of indicators did not become critical and only led to a change in the perspective of the stated problem: now the focus is on the analysis of the dependence of intensity of production activities in the industry of OIR NWFD on the volume of available investment.
Despite the adjustment, the approach to assessing structural transformations in the economy remains the same: indicators “structural shift vector” and “structural shift intensity” are used for the analysis. The first indicator shows the total change in the share of the element and is calculated according to the formula:
V j = d j" - d f , (1)
where: Vj –structural shift vector of element j ; d j — share of j -th element of the structure under review in year t ; t0 ... tn – year of the period under review.
The second indicator – the rate of change in the share of the element in the total for a specified period – is calculated according to the formula [17] :
Sj =
- 1
* 100,
where: S j – index of structural shift intensity of element j .
Structural changes in the economy of OIR NWFD are reviewed during 2005–2017. In order to eliminate annual fluctuations in calculations of shift vectors we use values averaged for three years.
Main research results. The most important role in the development of old industrial regions belongs to the industrial sector, whose average share in the sectoral structure of GVA at the end of 2017 amounted to 45.1%. A similar situation is observed in the group of OIR NWFD ( Tab. 1 ): on average, this sector accounts for 43.1% of GVA, the highest volume being produced by processing industries (22%), slightly less – fuel and energy (16.7%). It can be noted that the Murmansk Oblast is somewhat out of place: there, industry forms only 28.2% of GVA, but this is not an indicator of deindustrialization, but rather a consequence of developed fishery, since the region is one of the largest Russian suppliers of fish products to domestic and foreign markets.
Analysis of the performance of industrial production in the past 13 years leads to a conclusion about the relatively stable rates of industrial development in all OIR NWFD ( Tab. 2 ). It is obvious that in view of the high increase rate in production and a considerable volume of output, these regions, for the most part, have significant resource and teccho-
Table 1. Share of industry in the GVA structure in 2017, %
|
Region |
B |
C |
D |
E |
Total |
|
Komi Republic |
37.2 |
11.7 |
2.8 |
0.5 |
52.2 |
|
Arkhangelsk Oblast |
30.9 |
16.9 |
2.2 |
0.4 |
50.4 |
|
Novgorod Oblast |
0.8 |
38.9 |
5.5 |
0.8 |
46.0 |
|
Vologda Oblast |
0.0 |
38.1 |
3.1 |
0.9 |
42.1 |
|
Republic of Karelia |
17.6 |
16.9 |
4.1 |
1.0 |
39.6 |
|
Murmansk Oblast |
13.4 |
9.7 |
3.9 |
1.2 |
28.2 |
|
Average value |
16.7 |
22.0 |
3.6 |
0.8 |
43.1 |
|
Legend: B – mining; C – processing; D – provision of electricity, gas and steam; air conditioning; E – water supply; water disposal, waste collection and disposal, pollution control activities. Source: compiled by the author according to the Federal State Statistics Service. |
|||||
Table 2. Industrial production, bln RUB (in the prices of 2017)
The structure of industrial production of the territories under review is dominated by output of intermediate products, whose share in 2017 amounted to 43.5%. In recent years, the positions of the fuel and energy sector have significantly strengthened, the share of consumer and investment products – slightly increased. This was mainly the result of the transformation processes in the regional economy caused by changes in the external and internal environment.
In particular, they were negatively manifested in a significantly decreased share of shipped products of metallurgy (there was a decline from 27.7 to 18.9 percentage points (p.p.)) and a number of other industries, but at the same time led to a significant development of food and machine-building industries – their share increased by 2.2 and 3.1 p.p. respectively ( Tab. 3 ).
The analysis of transformations in the structure of industrial production of OIR NWFD shows that during 2005–2017 greatest positive changes occurred in mining (the shift value – 8.8 p.p., average annual intensity – 2.5%), in food (2.9 p.p. and 3.4%, respectively) and chemical (1.8 p.p. and 1.3%) industry. The decline in the relative size of metallurgical plants
Table 3. Structure of industrial production in OIR NWFD, %
|
Type of economic activity |
2005 |
2010 |
2015 |
2016 |
2017 |
|
Fuel and energy products |
22.2 |
31.1 |
31.8 |
33.1 |
30.6 |
|
Mining |
|||||
|
Intermediate products |
54.7 |
47.0 |
45.2 |
44.1 |
43.5 |
|
Manufacture of wood and wood products |
4.6 |
3.5 |
4.2 |
4.5 |
4.1 |
|
Chemical and petrochemical products |
10.7 |
10.8 |
13.1 |
11.1 |
10.5 |
|
Metal products |
27.7 |
20.8 |
18.4 |
17.8 |
18.9 |
|
Production of electricity, gas, water |
11.7 |
11.9 |
9.6 |
10.7 |
10.0 |
|
Consumer products |
13.9 |
15.1 |
16.4 |
17.2 |
14.3 |
|
Food products |
5.4 |
7.8 |
8.5 |
8.7 |
7.6 |
|
Pulp and paper products |
7.1 |
5.9 |
6.5 |
7.0 |
6.1 |
|
Other types of manufacturing |
1.5 |
1.4 |
1.4 |
1.5 |
0.6 |
|
Investment products |
9.1 |
6.8 |
6.6 |
5.6 |
11.6 |
|
Production of non-metal mineral products |
2.1 |
1.6 |
1.3 |
1.4 |
1.4 |
|
Machine building |
7.0 |
5.2 |
5.3 |
4.2 |
10.2 |
|
Source: compiled by the author according to the Federal State Statistics Service. |
|||||
Figure 1. Structural shift vector in shipment of industrial products in OIR NWFD in 2005–2017, p.p.
Mining
I 8.8
Manufacturing -7.4
Food production
Chemical and petrochemical production
Machine building
Pupl and paper
Other manufacturing types of production
Woodwork and wood products
Production of non-metal mineral products
Metallurgy -11.8
^™ 2.9
1.8
0.9
-0.3 I
-0.4 I
-0.7 ■
0.1
Production of electricity, gas, water

Source: calculated by the author according to the Federal State Statistics Service.
amounted to -11.8 p.p., the average compression rate – 3.7 %. The decrease in the share of this type of activity led to a negative shift vector in manufacturing in general (-7.4 p.p.) with an average annual intensity of 0.9% ( Fig. 1 ).
At present, the necessary conditions for ensuring sustainable economic growth are the stimulation of investment and innovation activities, the implementation of effective industrial policy, and the improvement of the business climate [18–20]. A wide range of measures are implemented in the Northwestern Federal District for this purpose, but the level of investment attractiveness of these territories still does not accumulate a large amount of investment. Thus, during 2005–2017, investment in fixed assets increased only by 32.8%, the average annual growth rate – 2.4%.
A steady inflow of investment mostly reflects fuel and energy in OIR NWFD, transport companies and processing industries, which is a sign of lack of proper investment in other economic sectors, available funds and high risk ( Fig. 2 ).
The greatest positive structural changes in investment in the economy of OIR NWFD during 2005–2017 were recorded by type of activity in “mining” and “public administration and military security”. In the first case, the structural shift value was 7.4 p.p. with an average annual rate of 2.0%, in the second – 4.6 p.p. with the intensity of 11.4% ( Fig. 3 ). Against this background, processing industries look extremely faded (0.5 p.p. and 0.2%, respectively), investment in which has not significantly changed over the years, which once again emphasizes the inertia of the development of this activity.
Significant negative transformations in the investment structure occurred in transport (shift – 8.5 p.p. with an average annual rate of 2.0%) and construction (-2.7 p.p. and 8.1%, respectively). Attention is drawn to the reduction of investment in socio-cultural activities, in particular, education and health: the shift value was -0.2 and -0.7 p.p., average annual intensity – 1.3 and 4.6%, respectively.
Figure 2. Structure of investment in the economy of OIR NWFD in 2017, %
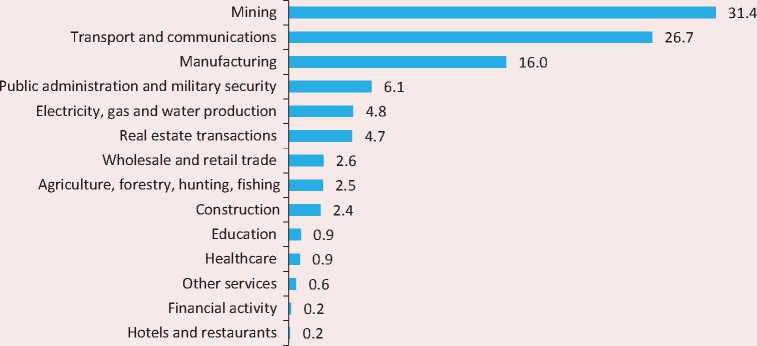
Source: calculated by the author according to the Federal State Statistics Service.
Figure 3. Structural shift vector of investment in the economy of OIR NWDFD in 2005–2017, p.p.
Mining
Public administration and military security Manufacturing
Electricity, gas and water production Other services
Wholesale and retail trade
Hotels and restaurants
Agriculture, forestry, hunting, fishing
Education
Financial activity
Healthcare
Real estate transactions
Construction
Transport and communications -8.5
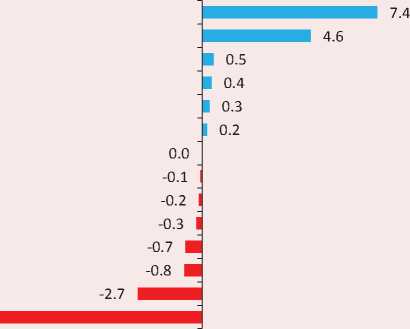
Source: compiled by the author according to the Federal State Statistics Service.
As for industries themselves, it can be noted that fuel and energy occupies the largest share in the structure of investment (60.2% in 2017). The types of activities that produce intermediate products account for slightly less than one third of all investment: basically, they are accumulated by production of electricity, gas and water (9.2%), metallurgy (8.4%) and chemical products (7.3%).
Apparently, production of investment products in OIR NWFD does not cause any significant investment interest, which demonstrates, firstly, its lowest share in the analyzed structure, and second, its gradual decline in recent years ( Tab. 4 ). Without touching upon the issue of competitiveness of machinebuilding enterprises located in the regions under review, we can assume that one of the reasons
Table 4. Structure of investment in industry in OIR NWFD, %
|
Type of economic activity |
2005 |
2010 |
2015 |
2016 |
2017 |
|
Fuel and energy products |
48.8 |
55.0 |
67.3 |
60.4 |
60.2 |
|
Mining |
|||||
|
Intermediate products |
36.9 |
30.9 |
26.0 |
30.0 |
28.3 |
|
Production of electricity, gas, water |
7.2 |
16.3 |
7.2 |
7.1 |
9.2 |
|
Metal products |
19.7 |
6.6 |
5.1 |
6.9 |
8.4 |
|
Chemical and petrochemical products |
4.9 |
5.2 |
11.0 |
11.6 |
7.3 |
|
Manufacture of wood and wood products |
5.1 |
2.8 |
2.7 |
4.3 |
3.5 |
|
Consumer products |
10.4 |
12.0 |
6.0 |
8.4 |
9.9 |
|
Pulp and paper products |
6.0 |
8.5 |
2.4 |
4.0 |
6.8 |
|
Other types of manufacturing |
2.1 |
1.9 |
2.9 |
3.5 |
2.3 |
|
Food products |
2.3 |
1.6 |
0.7 |
0.9 |
0.8 |
|
Investment products |
4.0 |
2.1 |
0.8 |
1.2 |
1.7 |
|
Machine building |
1.1 |
0.7 |
0.5 |
0.8 |
0.9 |
|
Production of non-metal mineral products |
2.9 |
1.4 |
0.3 |
0.3 |
0.7 |
Figure 4. Structural shift vector of investment in industry of OIR NWSD in 2005–2017, p.p.
|
Mining Manufacturing -4.4 Chemical and petrochemical products Other types of manufacturing Puplandpaper -0.1 | Machinebuilding -0.2 | Productionofnon-metalmineralproducts -1.1 ^^H Production og food -1.2 ^^H Woodworkandwoodproducts -1.5 ^^^H Metallurgy-5.3 ^^^^^^^^^^^^^^^H Productionofelectricity,gas,water -0.6 ■ |
|
|
5.0 |
|
|
^^^^^^^^H 4.1 ^H 0.9 |
Source: calculated by the author according to the Federal State Statistics Service.
for such a situation is the unstable economic situation in the country, which is quite fully described by the following quote: “When within one year ruble fluctuates to dollar within 25%, and real interest rates on loans remain at least 7–8%, it is too risky to invest” [21].
The leaders in the strength and speed of positive structural shifts in industrial investment are mining (shift value – 5.0 p.p., average annual intensity – 0.6%) and chemical and petrochemical production (4.1 p.p. and 4.2%, respectively).
The strongest negative structural shift occurred in metallurgy – the change during 2005–2017 was -5.3 p.p. with an average annual intensity of 4.3%. The shift value in woodworking, food and other non-metal industries is almost in the same range [-1,5; -1,1], but the transformation rate varies from 2.8 to 9.1% ( Fig. 4 ).
Figure 5. Intensity of structural changes in industry of OIR NWFD in 2005–2017, p.p.
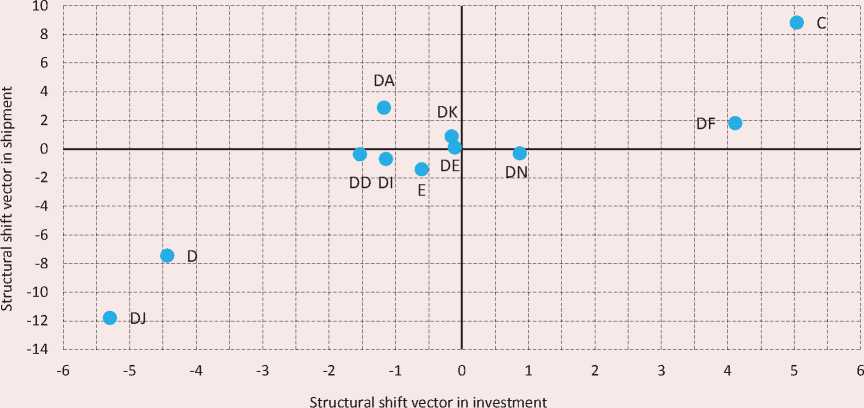
Legend:
C – mining; D – manufacturing; DA – manufacture of food products, beverages and tobacco; DD – manufacture of wood and wood products; DE – pulp and paper; publishing and printing; DF – manufacture of coke, refined petroleum products and nuclear materials, including chemicals, manufacture of rubber and plastic products; DI – manufacture of other non-metal mineral products; DJ – metallurgic and finished metal products; DK – manufacture of machinery and equipment, including electrical, electronic and optical equipment, manufacture of vehicles and equipment; DN – other products, including textile and garment, leather, leather goods and footwear; E – production and distribution of electricity, gas and water.
Source: calculated by the author according to the Federal State Statistics Service.
Investment processes in the economy determine the prospects for changing its sectoral structure, which will later significantly affect the features of the sectoral distribution of capital investment [17]. The transformations observed in the economy of OIR NWFD which mostly demonstrate direct dependence of industrial production on the volume of investment, help distinguish 4 groups of industries with fundamentally different ratio of structural shifts in shipping and investment ( Fig. 5 ).
-
1. An increase in the share of the industry in the structure of capital investment and in the structure of shipped goods. The group includes mining, chemical and petrochemical industry. In the first case, a significant increase in the
-
2. An increase in the share of the industry in the structure of capital investment with a decrease in the structure of shipped goods. This group consists only of other manufacturing industries, which due to the specific features of the analyzed statistics in this study were supplemented with light industry branches. Thus, with a small increase in the share of investment (0.9 p.p.), the segment has slightly lost its share in the shipment structure (-0.3 p.p.). Of course, it would be a mistake to state
-
3. A decrease in the share of the industry in the structure of capital investment with an increase in the structure of shipped goods. The sectors of this group demonstrate slight downward shifts in the structure of investment, observed against the background of an increase in the share in the volume of shipped goods. Thus, the change in the share of food production in investment amounted to -1.2 p.p. while the increase in the shipment reached 2.9 p.p. The shift of machine building on the horizontal axis by -0.2 p.p. did not prevent the demonstration of progress on the vertical axis by 0.9 p.p. Finally, the structural shift of pulp and paper along both axes is almost in the zero zone – the change was [-0.1; 0.1].
-
4. A reduction in the share of the industry in the structure of capital investment and in the structure of shipped goods. The group consists of activities whose effectiveness directly depends on investment proposal. In particular, the decrease in the share of metallurgical production in the volume of industrial investment (-5.3 p.p.) led to a significant drop in the share of the industry in the structure of shipped goods (-11.8 p.p.). Transformation processes similar in strength and direction affected woodwork and production of other non-metal mineral products: the share of industries in the structure of investment decreased by -1.5 and -1.1 p.p. respectively, in the volume of shipment – by -0.4 and -0.7 p.p. Note that in general, the movement of processing industries along the horizontal axis (-4.4 p.p.) initiates almost two-fold movement of this type of activity along the vertical axis (-7.4 p.p.). The situation is repeated in the case of production and distribution of electricity,
share of investment (5.0 p.p.) activated an even greater increase in the share in the volume of shipment (8.8 p.p.). In chemical industry, on the contrary, the investment increase (4.1 p.p.) led to a three times smaller shift in the structure of shipped goods (1.8 p.p.).
the existence of such a contradictory correlation – the result could be due to a statistical error as well as a variety of organizational and economic factors.
gas and water: an insignificant decline in investment (-0.6 p.p.) contributed to a decrease in the share of production by -1.4 p.p.
Conclusion. The development of old industrial regions in the Northwestern Federal District in 2005–2017 was accompanied by significant structural transformations, which led to significant changes in the social and economic spheres of the society. They were manifested in the decline in investment activity of enterprises, accompanied by the degradation of certain manufacturing sectors, and the decline in the share of this activity in the structure of shipped goods.
These changes occurred against the strengthening of material profile of OIR NWFD – in all regions under review the share of mining increased in the structure of industrial production. The observed shift is in the range from 3.6 p.p. in the Republic of Karelia2 to 11.1 p.p. in the Komi Republic.
The example of economy of old industrial regions of the Northwestern Federal District shows that efficient investment policy in fuel and energy contributes to a steady increase in the volume of materials production, but at the same time significantly distracts investors from manufacturing and leads to a decrease in the volume of shipped goods. Such deformations have a negative impact on the prospects of modernization of the national economy; they cause an increase in its dependence on imports; prevent the implementation of the national policy on economic digitalization and the increase in the share of high-tech industries.
One of the ways to prevent such unfavorable prospects can be the implementation of a strictly targeted structural policy to redirect investment resources from excessive sectors to outsiders. Meeting investment needs in manufacturing will be a high-capacity factor in new industrialization in old industrial regions of the Northwestern Federal District and will ensure the formation of their modern high-tech image corresponding to the current requirements of the era of universal digitalization.
References Investment processes and structural changes in the economy of old industrial regions of the northwestern federal district
- Lukin E.V., Leonidova E.G. Economic growth in an old industrial region: problems and ways of intensification. Problemy razvitiya territorii=Problems of Territory's Development, 2017, no. 2, pp. 33-50. (In Russian).
- Lukin E.V., Uskova T.V. Mezhregional'noe ekonomicheskoe sotrudnichestvo: sostoyanie, problemy, perspektivy [Interregional Economic Cooperation: State, Problems, Prospects]. Vologda: ISERT RAN, 2016. 148 p.
- Birch K., Mackinnon D., Cumbers A. Old industrial regions in Europe: a comparative assessment of economic performance. Regional Studies, 2010, vol. 44, pp. 35-53.
- Henderson S.R. Transforming old industrial regions: constructing collaboration within the Black Country, England. Geoforum, 2015, vol. 60, pp. 95-106.
- Bakanov S.A. Urban demographic decline in the traditional industrial regions of the Urals (1959-2010). Quaestio Rossica, 2017, no. 1, pp. 74-85. (In Russian). DOI: 10.15826/qr.2017.1.211
- Strovskii V.E., Kubarev M.S. Ensuring ecological security in the conditions of mining monotowns. Izvestiya vysshikh uchebnykh zavedenii. Gornyi zhurnal=News of the Higher Institutions. Mining Journal, 2018, no. 6, pp. 99-108. (In Russian).
- DOI: 10.21440/0536-1028-2018-6-99-108
- Tarasova O.V., Rudneva V.A. Models of revitalization of old industrial territories: the South of Western Siberia. EKO. 2017, no. 7, pp. 53-71. (In Russian).
- Yakushkina T.A., Mokretsova A.I., Rushkova A.V. Strategic development management in old industrial regions and large cities. Izvestiya Yugo-Zapadnogo gosudarstvennogo universiteta. Seriya: Ekonomika. Sotsiologiya. Menedzhment=Proceeding of the Southwest State University. Economics, Sociology, Management, 2016, no. 2, pp. 66-74. (In Russian).
- Tatarkin A., Romanova O. The capacity and mechanism of neo-industrialization in old industrial regions. Ekonomist=Economist, 2013, no. 1, pp. 21-37. (In Russian).
- Sorokina N.Yu. Evaluation of development of the old industrial region in the context of ensuring its economic security. Federalizm=Federalism, 2018, no. 3, pp. 90-103. (In Russian).
- Makarova I.V., Korovin G.B. Economic trends of neo-industrialization of the old industrial regions. Regional'naya ekonomika: teoriya i praktika= Regional Economics: Theory and Practice, 2014, no. 31, pp. 2-13. (In Russian).
- Pavlov K.V. Features of modernization of old-industrial regions. Natsional'nye interesy: prioritety i bezopasnost'=National Interests: Priorities and Security, 2014, no. 28, pp. 11-24. (In Russian).
- Uskova T.V., Lukin E.V., Melnikov A.E., Leonidova E.G. Industrial development issues in the economy of the old industrial regions of Russia. Economic and Social Changes: Facts, Trends, Forecast, 2017, vol. 10, no. 4, pp. 62-77.
- DOI: 10.15838/esc.2017.4.52.3
- Hospers G.J., Benneworth P.S. Innovation in an old industrial region: the case of Twente. International Journal of Learning and Intellectual Capital, 2012, vol. 9 (1/2), pp. 6-21.
- DOI: 10.1504/IJLIC.2012.043978
- Myslyakova Yu.G. Influence of higher education institutions on acceleration of industrial development of the economy of an old industrial region. Zhurnal ekonomicheskoi teorii=Russian Journal of Economic Theory, 2018, no. 1, pp. 76-83. (In Russian).
- Tatarkin A.I., Makarova I.V., Petrov A.P., Averina L.M. Peculiarities of the spatial distribution of productive forces in the old-industrial area. Prostranstvennaya ekonomika=Spatial Economics, 2013, no. 4, pp. 28-43. (In Russian).
- Zamaraev V., Marshova T. Investment processes and the Russian economy restructuring. Voprosy ekonomiki=Issues of Economics, 2017, no. 12, pp. 40-62. (In Russian).
- Ilyin V.A., Uskova T.V. Methods of overcoming the spatial socio-economic differentiation. Federalizm=Federalizm, 2012, no. 3, pp. 7-18. (In Russian).
- T.V. Uskova et al. Sotsial'no-ekonomicheskie problemy lokal'nykh territorii [The Socio-economic Issues of Local Territories]. Vologda: ISERT RAN, 2013. 196 p.
- Yang Lu. Industry 4.0: A survey on technologies, applications and open research issues. Journal of Industrial Information Integration, 2017, vol. 6, pp. 1-10.
- DOI: 10.1016/j.jii.2017.04.005
- Mavrina L., Obukhova E. The thread pulse of economy. Ekspert=Expert, 2018, no. 3, pp. 20-25. (In Russian).
