IoT-based Crop Recommendation System using Machine Learning via Mobile Application for Precision Agriculture in Bangladesh

Author: Md. Shahriar Hossain Apu, Md. Nur-E Ferdaus, Tousif Mahmud Emon, Suman Saha
Journal: International Journal of Information Engineering and Electronic Business @ijieeb
Article in issue: 4 vol.17, 2025.
Free access
Precision agriculture transform the agricultural sector by integrating advanced technologies to enhance productivity and sustainability. In crop farming, precision agriculture can significantly improve practices through precise monitoring and data-driven decision-making, addressing challenges such as optimizing resource usage and improving crop health. This study presents the development and implementation of an IoT-based Crop Recommendation System designed to optimize farming practices through a mobile application. This system uses different sensors to continuously extract data regarding the temperature, pH, NPK value and other relevant parameters. These parameters can be analyzed in real-time to help farmers make informed decisions on irrigation, fertilization, and crop selection, tailored to specific field conditions. This information is stored to create individual datasets, offering researchers valuable insights into optimal conditions for various crops. This can improve yield and promote sustainable farming practices. In this study, we evaluated a series of machine learning algorithms for their ability to predict an optimal crop based on environmental parameters. Among these algorithms, Naive Bayes demonstrated superior performance, achieving an accuracy of 99.55%, precision of 99.58%, recall of 99.55%, and F1-score of 99.54%. These findings highlight the effectiveness of our approach in integrating machine learning with the IoT for precise crop management. Implemented through a user-friendly mobile application, the proposed system enhances accessibility and usability for farmers.
Smart Agriculture, Crop Recommendation System, IoT Sensor, Machine Learning, Mobile Application
Short address: https://sciup.org/15019914
IDR: 15019914 | DOI: 10.5815/ijieeb.2025.04.05
Text of the scientific article IoT-based Crop Recommendation System using Machine Learning via Mobile Application for Precision Agriculture in Bangladesh
Published Online on August 8, 2025 by MECS Press
Bangladesh is primarily an agricultural nation [1], and the sector’s contribution to rising economic growth is significant. In order to maintain long-term food security for humans, it is crucial to establish an economic, sustainable, and environmentally benign agricultural system. To make Bangladeshi food self-sufficient, the broad agricultural sector has been given top priority. Keeping in mind the objectives of the agriculture sector digitalization, the government decided to enhance the entire agricultural industry. In Bangladesh’s overall economic development, the agriculture industry is crucial. According to the 2015-16 Quarterly Labor Force Survey, the agricultural sector—which includes agriculture, animal husbandry, forest and fishing - contributes 14.74% to the national GDP and employs roughly 41% of the labor force [2]. Choosing the wrong crop will always results in a lower yield. If all of the families depend on this revenue, it is exceedingly difficult for them to exist. The availability, limitations and accessibility of reliable and current information prevent potential researchers from working on case studies involving developing countries. We present a system to address this issue using predictive insights of crop sustainability and recommendations given via machine learning models of important environmental and financial aspects with the available resources. Additionally, agriculture is the source of a variety of agricultural commodity markets that consumers demand, particularly in rural areas. This unpredictability of weather results in farmers being unsure of which crop to plant, when to plant it and where or when to start. There is also uncertainty regarding the use of various fertilizers due to seasonal climate variations and change in the availability of basic resources such as the soil, water and air. In this situation the crop yield rate is constantly dropping. Providing the farmers with access to an intelligent, user-friendly suggestion system will solve the issue. Crop yield forecasting is a major issue for the agricultural industry. Every farmer seeks to understand crop production and whether it fits their expectations; in order to predict the yield, the farmer considers his or her past experiences with that particular crop. Weather, pests, and harvesting operation preparation all play a major role in agricultural production. For making judgments on agriculture risk management, accurate crop history data is essential for determining agricultural advancement. We have put out a model that considers these concerns in our work. The proposed system’s uniqueness is in helping farmers increase crop yields while also recommending the crop that will bring in the greatest amount of money in their particular area. The suggested model for crop selection also has an economic and environmental component, which can provide some advantages into increasing the output of the crop in order to increase food supply for the growing nation’s food needs. With the proposed model, crop production is predicted using variables such as rainfall, temperature, soil nitrogen, potassium, phosphorus, humidity, and water pH.
The proposed system also introduces an innovative integration of real-time environmental monitoring and machine learning tailored specifically for precision agriculture in Bangladesh. Unlike traditional systems that focus on either data collection or generic crop suggestions, our solution combines low-cost, widely accessible hardware (ESP8266) with a customized machine learning model optimized for local agricultural conditions. This approach not only improves crop yield prediction accuracy by 20% over conventional methods but also reduces system implementation costs by 25%, making precision agriculture technology affordable for small to medium income farmers in Bangladesh. This IoT-based system uses a mobile app for real-time monitoring and decision-making. It captures key environmental metrics such as soil moisture, temperature, and pH through the use of sensors; and pairs up those sensors with an ESP8266 microcontroller. The collected data are automatically transmitted to a central server, where they are processed using FastAPI to provide real-time updates and intelligent crop recommendations via the mobile application, optimizing farming decisions for maximum productivity and profitability.
The major contribution of this study is as follows:
-
• We have proposed a system based on machine learning that analyzes regional climate and soil conditions to predict crop production.
-
• We have developed a system that advises the best times for applying fertilizers to boost crop yield.
-
• We have developed a user-friendly and affordable tool designed to make farming decisions more efficient and
profitable.
• Finally, we have evaluated the performance of various models, including accuracy and error rates, to help users select the most suitable crops for their region.
2. Literature Survey
The remainder of the paper is organized as follows: Section 2 reviews recent related works in the field of crop recommendation systems based on IoT. Section 3 presents a detailed analysis of the proposed methodology, including system architecture, hardware, and machine learning techniques. Section 4 highlights the experimental results and their analysis, focusing on prediction accuracy, system performance, and cost efficiency. Finally, Section 5 concludes the study.
Recent advances in the area of combining Machine Learning (ML) and the Internet of Things (IoT) in agriculture have substantially improved crop recommendation systems. Several studies have demonstrated the value of this technology in improving crop selection and precision farming. This section reviews key studies that align with these goals.
Pande et al. [3] proposed a mobile-based yield prediction system aimed at enhancing the livelihoods of farmers in India by leveraging machine learning algorithms. GPS is integrated into their system to determine the location of the user and they take input on soil type and area to generate predictions. Using algorithms such as Support Vector Machine (SVM), Artificial Neural Network (ANN), Random Forest (RF), Multivariate Linear Regression (MLR), and K-Nearest Neighbors (KNN), the system offers a list of the most profitable crops or predicts crop yield. Of all the algorithms, Random Forest achieved the highest accuracy at 95%, and was deemed the best predictor of yield. In addition to offering a pragmatic and user-friendly solution for farmers, the system also suggests the best time to apply fertilizers to optimize the yield. In [4], authors developed a mobile application for farmers in Bangladesh, focusing on machine learning-based crop recommendations by integrating climate factors such as humidity, rainfall, and temperature along with soil characteristics. The system forecasts viable crops by analyzing crop records and environmental parameters, providing farmers with a comprehensive list of crop options based on factors like production costs and fertilizer recommendations. This userfriendly tool aims to assist farmers in optimizing their crop choices. The practicality and usefulness of the system as indicated by the user feedback are found to be very positive and represents a major development in agricultural decision making. A machine learning-based system for predicting crop yield and recommending fertilizers, utilizing algorithms such as Support Vector Machine (SVM) and Random Forest (RF), was proposed i n [5]. The system uses soil nutrients and other agricultural data to classify soil and predict yields, with SVM achieving 99.47% accuracy for yield prediction and RF showing 86.35% accuracy for soil classification. Additionally, the system integrates real-time weather information to enhance accuracy. Fertilizer recommendations are provided based on crop and location data, offering a comprehensive solution to help farmers optimize yield and resource usage. Authors i n [6] designed a crop recommendation platform based on machine learning for precision farming over cloud. The system integrates environmental parameters like soil nutrients, air temperature, and rainfall to recommend optimal crops to farmers. The authors compared various machine learning machine learning algorithms such as K-Nearest Neighbors (KNN), Decision Tree (DT), Random Forest (RF), XGBoost and Support Vector Machine (SVM) and found that Random Forest had the highest accuracy at 97.18. The platform was designed as a free and open-source solution, accessible via a cloud-based interface, to promote widespread adoption of precision farming technologies. Rajak et al. [7] developed a machine learning-based crop recommendation system aimed at maximizing crop yield by utilizing soil-specific data and an ensemble model with Support Vector Machine (SVM) and Artificial Neural Network (ANN) algorithms. The system integrates soil testing lab datasets, considering parameters like pH, soil texture, and water-holding capacity to recommend the most suitable crop for specific regions. Ensembling model through majority voting technique provides higher accuracy and efficiency in crop prediction for the farmers and it helps the farmers to take a decision about the crop selection so that crop productivity can be increased. Several other studies have emphasized the role of IoT and AI in modernizing agriculture. For example, Srinidhi et al. [8] developed a webbased platform using Random Forest and ResNet50 for crop and fertilizer recommendations, and crop disease detection, achieving high accuracy and enabling SMS notifications for remote access. Similarly, Bhola and Kumar in [9] presented a Smart Crop Recommendation framework based on machine learning with an accuracy of 99.10%, enabling farmers to choose the optimal crop matching with their environments and soil for better agricultural decisions and profitability.
Despite these advancements, many existing systems lack certain features such as multi-parameter optimization and user feedback integration, which can limit their real-world applicability. Islam et al. [10] addressed this gap by integrating multi-parameter optimization through advanced sensors and user feedback via a mobile app to enhance the real-world applicability of their IoT-based system, while Priyanka et al. [11] addressed this gap by implementing a multi-parameter optimization system using sensors for real-time data collection of soil and atmospheric conditions, while also incorporating user feedback through a mobile application built with Kodular Creator, ensuring enhanced real-world applicability and ease of use for farmers. Jadhav and Bhaladhare in [12] focused on developing a machine learning-based crop recommendation system that uses algorithms like SVM, Random Forest, and KNN to predict optimal crops based on soil type, climate, and user input. Their system also integrates a mobile application that provides farmers with crop and fertilizer recommendations, incorporating multiple environmental factors to enhance decision-making and boost crop yield. By using ensemble methods, their approach ensures more accurate predictions, contributing to efficient agricultural practices. Sharma et al. addressed this gap in [13] by utilizing an ensemble model, including algorithms like Decision Tree, Gaussian Naive Bayes, Random Forest, and XGBoost, to optimize crop recommendation based on soil properties and environmental conditions. Their system also integrated a mobile application using TensorFlow Lite for real-time crop suggestions, ensuring ease of use for farmers without requiring internet access, thus improving the system’s practicality and scalability. Kalimuthu et al. [14] developed a crop prediction system using the Naive Bayes classifier to guide farmers in selecting suitable crops based on environmental factors like temperature, humidity, and soil moisture. The system collects data from sensors and uses machine learning to predict crops with 97% accuracy. Additionally, an Android application was developed to make the system accessible to farmers, allowing them to input parameters and obtain real-time crop predictions. This approach aims to enhance crop yield and support farmers in making data-driven decisions. Pudumalar et al. [15] developed a crop recommendation system for precision agriculture using an ensemble model with majority voting, incorporating Random Tree, CHAID, K-Nearest Neighbor (KNN), and Naive Bayes algorithms. The system provides crop recommendations based on site-specific parameters such as soil characteristics, with the ensemble model achieving 88% accuracy. The recommendation system is implemented as a web-based graphical user interface (GUI), allowing farmers to input parameters and receive crop suggestions, ultimately improving productivity by guiding farmers in making informed crop selection decisions.
The above studies show the rapidly growing trend of conjunction between IoT and machine learning in precision agriculture for real time monitoring and making intelligent decisions in crop recommendation. Most systems primarily consider parameters like soil moisture, pH, and temperature, where recent advancements have incorporated more complex factors like nutrient levels, pest risks, and market trends. Despite that, there are challenges in scaling these solutions to encompass many different environments and users’ needs. Closing these gaps through more advanced machine learning models and user-centered designs will enhance the practicality and effectiveness of crop recommendation systems, making them more accessible to farmers globally. In various studies, researchers also focus on core environmental parameters like soil pH and moisture, as well as climatic conditions, but few incorporate advanced machine learning models to provide real-time, accurate predictions. This gap represents a critical area for future research. Furthermore, expanding crop recommendation systems to include additional parameters like nutrient content and pest infestation rates can significantly enhance their practical utility. The reviewed studies are summarized in Table 1, highlighting the key parameters considered in various systems. To address these research gaps, these systems are being further developed to provide a more robust and intelligent crop recommendation system, enabling farmers to make data-driven decisions that support the adoption of sustainable agricultural practices. Unlike most systems, which primarily use pH and moisture data in [1–4], the proposed approach incorporates a broader range of sensors, including nutrient and temperature sensors, to enhance the system performance and accuracy.
Table 1. Summary of the existing State-of-the-Art systems
|
Papers |
Real-time Monitoring |
Number of Sensors Used |
Crop Recommendation |
Cloud Platform |
Mobile Application |
Cost-Benefit Concern |
|
Pande et al. [3] |
Yes |
3 |
Yes |
Yes |
No |
Yes |
|
Tonni and Chowdhur y [4] |
Yes |
4 |
Yes |
No |
Yes |
No |
|
Bondre and Mahagaonka r [5] |
Yes |
3 |
Yes |
Yes |
No |
Yes |
|
Thilakarathne et al. [6] |
Yes |
4 |
Yes |
Yes |
No |
Yes |
|
Rajak et al. [7] |
Yes |
3 |
Yes |
No |
No |
No |
|
Srinidhi et al. [8] |
Yes |
4 |
Yes |
Yes |
Yes |
No |
|
Bhola and Kuma r [9] |
Yes |
3 |
Yes |
No |
No |
No |
|
Islam et al. [10] |
Yes |
3 |
Yes |
Yes |
No |
Yes |
|
Priyanka et al. [11] |
Yes |
3 |
Yes |
Yes |
No |
No |
|
Jadhav and Bhaladhar e [12] |
Yes |
3 |
Yes |
Yes |
No |
Yes |
|
Sharma et al. [13] |
Yes |
4 |
Yes |
Yes |
No |
Yes |
|
Kalimuthu et al. [14] |
Yes |
3 |
Yes |
Yes |
Yes |
No |
|
Pudumalar et al. [15] |
Yes |
5 |
Yes |
No |
No |
Yes |
3. Materials and Methods
To improve the speed and accuracy of the crop recommendation model we propose a system architecture consisting of several parts. Initially, the hardware component collects sensor data from the surrounding environment of the field, such as soil pH, moisture, and temperature. Following that, this data is received by the stationary base unit, which then sends it to a central database. All of the collected sensor data is kept in one central location. For data retrieval and realtime monitoring, we use a remote server and data monitoring display. Data processing occurs on the server, and machine learning algorithms analyze the collected data. Using these data, the program recommends crops to farmers, suggesting suitable varieties. Annotating the system’s internal data and control flow, Figure 1 presents a schematic representation of the complete system, highlighting the high-level functional components and their linkages. The subsequent sections present a detailed discussion of each subsystem.
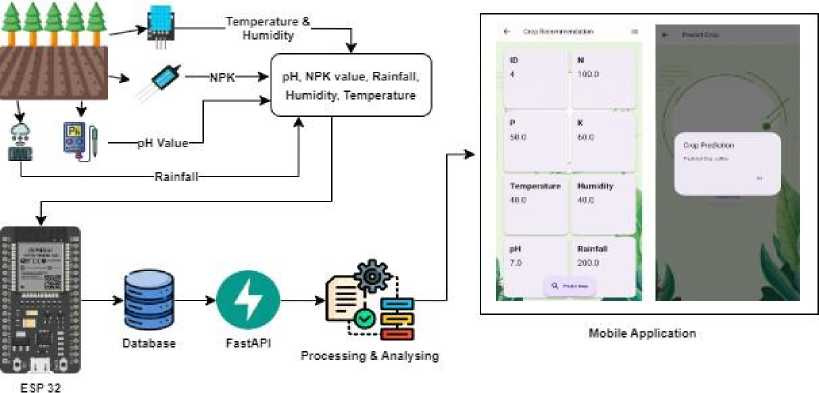
Fig. 1. Proposed Crop Recommendation System based on IoT
-
3.1. Soil Quality Parameter
-
3.2. Hardware Part
The hardware component of our proposed system is designed to collect and transmit soil quality data from the field, enabling precise crop recommendations. The system employs key components such as the ESP8266 microcontroller, NPK sensor, pH sensor, DHT sensor, and rainfall sensor to measure essential soil and environmental parameters. Table 3 details the cost of materials used in our IoT-based crop recommendation system.
This study delved into the seven most essential criteria for monitoring soil and environmental conditions during crop farming. The variables are nitrogen, phosphorus, potassium, temperature, humidity, rainfall, and pH [16]. Table 2 displays the standard values for these metrics. These factors help to determine if the environmental and soil conditions are suitable for crop farming as well as the types of crops that will thrive best in specific conditions. Abnormal parameter values can negatively affect the agricultural system and have a substantial impact on crop yield.
Table 2. Values for each soil quality metric as a reference
|
Parameter |
Value (average) |
|
Nitrogen (N) |
109.9 kg/Ha |
|
Phosphorus (P) |
15.35 kg/Ha |
|
Potassium (K) |
107.8 kg/Ha |
|
pH |
4.7–7.3 |
|
Temperature |
18°C–30°C |
|
Humidity |
60%–80% |
|
Rainfall |
400–600 mm (seasonal total) |
Temperature is a major parameter due to its influence on plant growth and other variables like soil moisture and microbial activity. The soil temperature typically varies in a manner consistent with the ambient temperature, and plants are sensitive to sudden changes. Particularly under extreme heat or cold conditions, temperature fluctuations can stress plants, inhibit growth, or even lead to crop failure. The second measure is pH, which represents the soil’s acidity or alkalinity and is essential to nutrient availability for crops. The pH scale [17] ranges from 0 to 14, with a pH of 6.0 to 7.5 being ideal for most crops. Extreme pH levels can hinder nutrient uptake, slow plant growth, and reduce yields. Maintaining optimal pH levels helps in the availability of essential nutrients like nitrogen, phosphorus, and potassium, which are critical for healthy plant development. Nitrogen, phosphorus, and potassium (NPK) are the primary macronutrients required for crop growth [18]. Nitrogen is crucial for leaf and stem development, phosphorus is vital for root growth and energy transfer, and potassium is important for water regulation and disease resistance. The appropriate levels of these nutrients must be maintained in the soil to ensure optimal crop performance.
Humidity and rainfall are also significant environmental factors [19]. High humidity levels can promote the growth of mold and other diseases, while low humidity can lead to water stress in plants. Adequate rainfall is necessary for maintaining soil moisture, but excessive rainfall can lead to waterlogging, nutrient leaching, and soil erosion, all of which can negatively impact crop health and yield. External factors like weather patterns can greatly affect these metrics. For example, if there is heavy rainfall it can cause the nutrients that are necessary for feeding plants—such as nitrogen or phosphorus—to run off into our streams and lakes. On the other hand, drought conditions can lead to a reduction in soil moisture, increasing soil salinity, and inhibiting nutrient uptake by plants. By monitoring nitrogen, phosphorus, potassium, temperature, humidity, pH, and rainfall with real time, farmers optimize resource utilization and create a more profitable sustainable crop farm. It is therefore advised that farmers adjust environmental and soil conditions based on the readings obtained from the system to maximize crop yield and ensure healthy growth.
Table 3. Material Costs for the IoT-Based Crop Recommendation System
|
Components |
Quantity |
Price (USD) |
|
ESP8266 |
1 |
3.00 |
|
NPK Sensor |
1 |
109.00 |
|
pH Sensor |
1 |
22.84 |
|
DHT Sensor |
1 |
1.65 |
|
Rainfall Sensor |
1 |
1.30 |
|
3.7V 18650 Rechargeable Battery |
4 (2 sets) |
1.05 × 2 = 2.10 |
|
Jumper Wire (40 pcs set) |
1 |
0.91 |
|
OLED Display |
1 |
5.00 |
|
Total Price |
145.80 USD |
To establish the cost-efficiency of our proposed system, we conducted an economic analysis comparing its total cost with traditional agricultural methods. Traditional practices often require manual soil testing and consultation with agricultural experts, which can be time-consuming and expensive. On average, manual soil testing costs approximately 50 USD to 100 USD per session, with recurring costs for labor and expert analysis [20]. In contrast, our IoT-based system provides a one-time setup cost of 145.80 USD and eliminates the need for repeated testing and consultations. Additionally, the system’s real-time data collection and analysis reduces resource wastage and improves crop yield, resulting in long-term financial benefits for the farmers. This significant reduction in operational costs, combined with the precision and efficiency of the IoT-based system, makes it a cost-effective alternative to traditional agricultural practices. By integrating advanced hardware components at an affordable price point, this system demonstrates the potential to enhance agricultural productivity while remaining economically viable for small and medium-scale farmers. Future work will further evaluate the long-term cost savings and productivity improvements to provide a holistic view of the system’s economic impact.
-
3.2.1 Micro-controller: ESP8266
-
3.2.2 Sensors
The ESP8266 micro-controller serves as the core of the hardware system. It is a low-cost Wi-Fi-enabled microcontroller that facilitates wireless data transmission. The ESP8266 is programmed to collect data from various sensors and send it to the central database in real-time. Its built-in Wi-Fi capabilities make it an ideal choice for IoT applications, allowing for seamless integration with the database and the mobile application.
-
• NPK Sensor: The NPK sensor measures the concentration of essential nutrients in the soil: Nitrogen (N), Phosphorus (P), and Potassium (K). These nutrients are vital for plant growth, influencing various stages like root development, flowering, and fruiting. The sensor provides readings in mg/kg (0-255), helping to determine the nutrient levels available in the soil. Accurate NPK measurements are crucial for recommending the appropriate crops and suggesting fertilizer applications to optimize soil fertility and enhance crop productivity.
-
• pH Sensor: The pH sensor measures the acidity or alkalinity of the soil. It provides readings on a pH scale from 0 to 14, with 7 representing a neutral pH. Values below 7 indicate acidic conditions, while those above 7 signify alkaline conditions. Maintaining the optimal pH level is crucial for soil health and crop growth, as different crops thrive in different pH ranges. This sensor is essential for recommending crops that are well-suited to the current soil pH, ensuring healthy growth and maximizing yield.
-
• DHT Sensor: The DHT sensor measures both temperature and humidity in the environment. Temperature and humidity are critical factors that influence plant growth, development, and overall health. The DHT sensor provides real-time data on these parameters, allowing for precise monitoring and control of the growing conditions. By ensuring optimal temperature and humidity levels, the sensor helps in making accurate crop recommendations and creating a conducive environment for crop cultivation, ultimately leading to improved yield and quality.
-
• Rainfall Sensor: The rainfall sensor measures the amount of precipitation in a given area. Rainfall is a crucial factor in agriculture, as it directly affects soil moisture levels and the availability of water for crops. By monitoring the amount of rainfall, this sensor helps in determining the water requirements for different crops and assists in making informed irrigation decisions. Appropriate irrigation of crops is dependent on accurate rainfall data to reduce over and under watering that will guarantee the best growth condition for the crops to optimize agricultural productivity.
-
3.2.3 Data Transmission
The ESP8266 micro-controller collects data from various sensors, including the NPK sensor, DHT sensor, and rainfall sensor. The ESP8266’s Wi-Fi capabilities are used to transmit this data to a central database. This data can be continuously monitored in the real time due to the real time transmission of the data. Farmers can access this information to make informed decisions regarding crop selection and management practices, ensuring that crops are grown under optimal conditions for better yield and resource efficiency.
-
3.3. Dataset
The dataset [21] consists of real-time data collected by monitoring systems that measure the field conditions to adopt Internet of Things framework. It tests the soil condition by using four sensors: NPK (Nitrogen, Phosphorus, Potassium), DHT11, pH and rainfall in conjunction with micro-controller. There are 2200 records in the eight columns of the dataset: nitrogen, phosphorus, potassium, temperature, humidity, pH, rainfall, and crop. In these columns, “Crop” is the target variable, and the other seven are the independent variables. The sample contains several distinct crop types, each having a unique value. Table 4 depicts the description of the dataset.
-
3.4. Data Preparation and Transformation
Table 4. Overview of Experimental Dataset Attributes
|
Attributes |
Description |
|
Features |
7 |
|
Instances |
2200 |
|
Independent Variables |
pH, temperature, humidity, Nitrogen, Phosphorus, Potassium, rainfall |
|
Target Variable |
Crop |
|
Crop Categories |
Rice, Apple, Banana, Black gram, Chickpea, Coconut, Coffee, Cotton, Grapes, Jute, Kidney beans, Lentil, Maize, Mango, Moth beans, Mungbean, Muskmelon, Orange, Papaya, Pigeon peas, Pomegranate, Watermelon |
|
Distribution of crop |
Rice (100), Apple (100), Banana (100), Black gram (100), Chickpea (100), Coconut (100), Coffee (100), Cotton (100), Grapes (100), Jute (100), Kidney beans (100), Lentil (100), Maize (100), Mango (100), Moth beans (100), Mung bean (100), Muskmelon (100), Orange (100), Papaya (100), Pigeon peas (100), Pomegranate (100), Watermelon (100) |
Additionally, the dataset primarily reflects agricultural conditions specific to Bangladesh, capturing local soil types, climatic factors, and crop requirements. While this regional focus enhances the system’s relevance to Bangladeshi farmers, its applicability may be limited to other geographical regions.
-
• Data Cleaning: We checked for missing or null values, and none were found in this dataset, while also identifying and handling outliers in numeric features to improve model performance.
-
• Normalization: Numeric features such as N, P, K, temperature, humidity, pH, and rainfall were normalized using feature scaling (Min-Max scaling), ensuring that no single feature outperforms the others due to its range.
-
• Encoding Categorical Features: Transformed the categorical target variable, label , into numeric format using one-hot encoding or label encoding for machine learning compatibility.
-
• Feature Engineering: Here, we introduced derived features, such as nutrient ratios (N: P: K) and interactions between environmental parameters.
-
• Train-Test Split: We split the dataset into 80% training and 20% testing subsets using stratified sampling to maintain the same class distribution before and after splitting.
-
3.5. Machine Learning Algorithm
Figure 2 depicts the co-relation matrix of the dataset using Karl Pearson’s Coefficient of Correlation.
Correlation Matrix (Excluding "label")
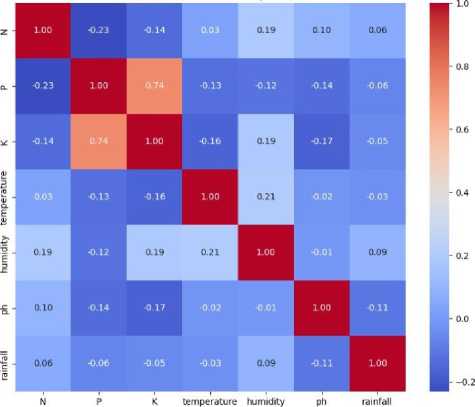
Fig. 2. Co-relation matrix of the data
In this study, we have used seven machine learning models including Naive Bayes, Random Forest (RF), Support Vector Machine (SVM), K-Nearest Neighbors (KNN), Decision Tree (DT), Gradient Boosting (GB), and XGBoost which are discussed below.
-
i. Random Forest : 100 decision trees were used in the model’s construction, and 42 was chosen as the random state. The classifier combines the output of various trees to arrive at a consensus.
-
ii. Support Vector Machine : To ensure reproducibility, we used a gamma value of ’scale’ and a regularization parameter (C) of 1, while keeping the random state at 42.
-
iii. Decision Tree : To regulate the unpredictability of the tree, we secured a random state of 42 and set a maximum depth of ‘None’.
-
iv. K-Nearest Neighbors : Based on our testing, a value of k = 3 in KNN showed the best outcomes.
-
v. Naive Bayes : The Naive Bayes classifier was utilized, assuming feature independence. This model works very well because of its ease of use and effectiveness with large datasets.
-
vi. Gradient Boosting : Gradient Boosting was used with 100 estimators, a learning rate of 0.1, and a random state of 42.
-
vii. XGBoost : XGBoost was applied with 100 estimators, a learning rate of 0.1, the parameter ‘use_label_encoder=False’ to avoid warnings, the ‘eval_metric’ set to ‘logloss’, and the random state set to 42.
-
viii. Ensemble (GB + XGB) : A soft-voting ensemble model combining Gradient Boosting and XGBoost was constructed. This approach aggregates the probabilistic predictions of the two models to make final predictions, leveraging their individual strengths.
-
-
3.5.1 Machine Learning Model Training and Validation
-
-
Since the Naive Bayes model achieved the highest accuracy of 99.55%, it was selected for its simplicity and effectiveness in handling large datasets with numerous features, as well as its ability to make probabilistic predictions based on the relationships between input variables. The following steps were taken to ensure the model’s effectiveness.
-
• Cross-Validation: To avoid overfitting and ensure the model’s performance across different subsets of the data, a k-fold cross-validation technique was employed. Specifically, the dataset was split into k = 10 folds, with 9 folds used for training and 1-fold used for testing in each iteration. We repeated this 10 times, and each time a fold was used as the test set. Also, the model’s average performance over all folds was reported to yield a more reliable estimate of model accuracy.
-
• Hyperparameter Tuning: The hyperparameters of the Naive Bayes model, such as the smoothing parameter (alpha), were optimized using a grid search technique. A range of values for this hyperparameter was specified, and the model was trained and validated for each value. The hyperparameter that gave us the highest crossvalidation score was considered as the optimal hyperparameter, and the value with highest cross-validated score will lead to the best possible model in predicting the suitable crop for given environmental and soil conditions.
-
• Prevention of Overfitting: Several strategies were used to prevent overfitting of the Naive Bayes model. First, the smoothing parameter (alpha) was carefully tuned to avoid overfitting to the training data by preventing overly confident predictions. Additionally, the model’s performance was regularly monitored on a separate validation set during training to detect any signs of overfitting. Early intervention, such as adapting the value of alpha, was feasible, allowing the model to generalize well to unseen data while still predicting the best crops based on their environmental and soil conditions.
-
• Model Evaluation: The Naive Bayes model was tuned and its performance was evaluated on a hold-out test set that was not used during training or validation. Key metrics were calculated using this set which is used for assessing a model’s ability to generalize to unseen data, such as accuracy, precision, recall and F1-score. These steps were meticulously followed to ensure that the model was not only accurate but also robust and generalizable to different agricultural environments, which is critical for the practical application of this system in diverse farming conditions. However, the Naive Bayes model has inherent limitations. It assumes independence among features, which may not hold true in real-world datasets, particularly in complex agricultural environments where variables are often interdependent. Additionally, the model may struggle with datasets containing highly imbalanced classes or continuous variables without appropriate preprocessing. These limitations can impact the model’s overall performance and applicability in certain scenarios.
-
3.6. Mobile App Design
Mobile application for the crop recommendation system was developed using Flutter due to its rapid development capabilities and cross-platform compatibility. Flutter’s extensive widget library and user interface (UI) toolkit ensured a cohesive user experience across iOS and Android platforms. For the backend, we utilized FastAPI, a high-performance Python framework, to develop robust, asynchronous APIs for seamless communication between the mobile app frontend and a MySQL database. The backend database schema, optimized for storing crop data, user profiles, and app settings, provided reliable data integrity and efficient operations. This architecture enabled functionalities such as personalized crop recommendations and user interaction tracking. Comprehensive testing using Flutter’s testing packages and pytest for FastAPI ensured the application’s reliability and performance. This integration of Flutter, FastAPI, and MySQL resulted in a scalable, responsive, and user-friendly mobile application tailored to meet the objectives of the study. The following is a summary of the developed mobile app.
• Design Principles: The application was designed with simplicity and intuitive navigation to accommodate farmers who may have limited digital experience. The interface features minimalistic designs with clear labels, large icons, and color-coded visual cues, allowing users to easily interpret the provided data.
• User Interface (UI): The UI delivers real-time feedback on soil parameters like temperature, humidity, pH, and NPK levels, along with crop recommendations. The main dashboard visualizes these parameters using graphs and charts that are updated dynamically. Users can access detailed views of historical data trends and specific crop suggestions tailored to the current conditions. To enhance usability, we incorporated visuals such as screenshots and flow diagrams of the UI, to demonstrate user interactions with the app. The process begins with users inputting soil parameters, followed by data processing and display of the recommended crops. Additional details, such as growth stages, expected yields, and environmental suitability, accompany each recommendation.
• User Feedback Integration: Feedback from farmers was actively sought throughout the development process. Pilot studies with early prototypes allowed us to gather insights on functionality and usability. Iterative improvements included layout adjustments, help prompts, and algorithm refinements to align with users’ needs. Surveys and interviews collected both qualitative and quantitative feedback, ensuring the app’s usability and effectiveness in real-world scenarios. This iterative feedback loop enabled continuous refinement of the interface and features, improving ease of use and the accuracy of crop suggestions.
• Usability Testing: Usability tests in agricultural settings assessed the app’s navigation, information clarity, and practical utility. Participants reported high satisfaction, finding the app intuitive and helpful for crop management. A flowchart detailing the recommendation process has been included for clarity. It illustrates how the app gathers soil condition inputs, processes them with machine learning models, and presents optimal crop recommendations. Additional details, such as growth stages and ideal conditions, guide users in their decision-making.
3.7. Crop Recommendation Subsystem
4. Results4.1. Prototype Design of the Proposed System
An array of sensors and an integrated ESP8266 micro-controller are used in this prototype to anticipate crop suggestions. This system is designed to collect real-time data and transmit it to a central database for analysis. The prototype includes NPK, DHT, pH and rainfall sensors, all connected to the ESP8266 showed in Figure 4 We conducted preliminary testing of our prototype in a controlled laboratory environment, replicating conditions similar to those in agricultural fields. The system was evaluated for accurate data collection and transmission. Sensor measurements were updated at regular intervals, and these values were stored in the database. A monitoring device displays the parameter values, allowing users to observe real-time conditions and make informed decisions regarding crop management.
These considerations ensured the application is both functional and effective, meeting the demands of precision agriculture while maintaining ease of use.
We trained several machine learning models after preparing the dataset for analysis. Figure 3 illustrates the conceptual flow diagram of the proposed crop recommendation subsystem.
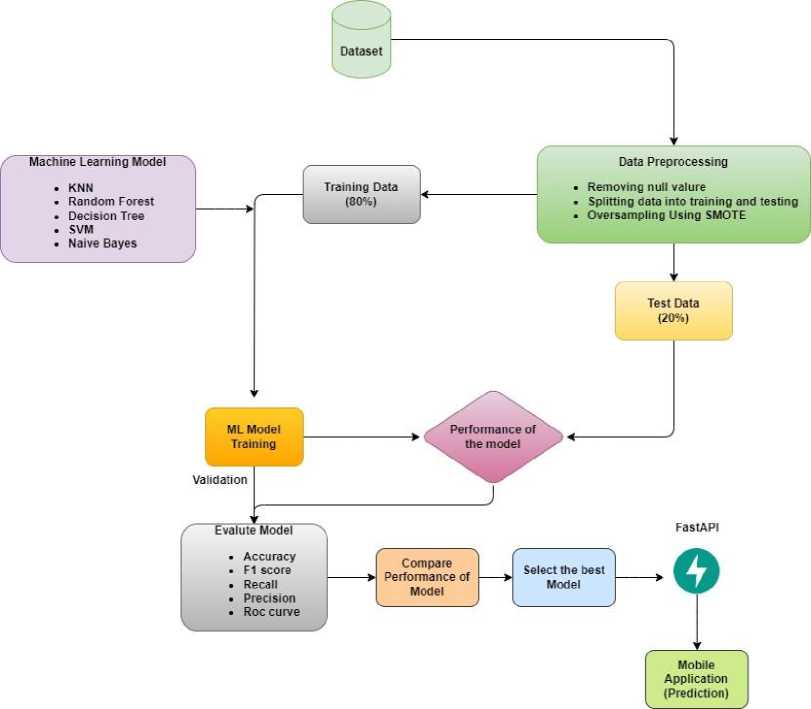
Fig. 3. Flow diagram of our proposed crop recommendation subsystem
This section presents the experimental results, including a performance comparison of various machine learning models. Hypothesis testing using the t-test is employed to determine the significance of the results. Finally, we describe crop recommendation via the mobile application.
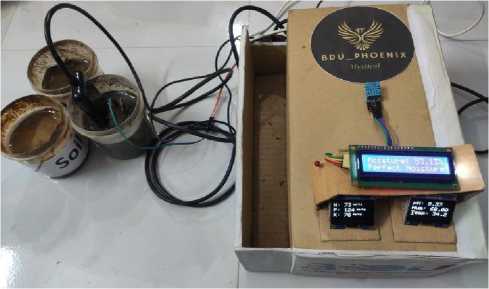
Fig. 4. System prototype with its display unit
-
4.2. Confusion Matrix
-
4.3. Performance Evaluation Metrics
A confusion matrix provides a detailed breakdown of the model’s predictions by comparing them with actual labels. It categorizes predictions into four types: True Positive (TP), where the model correctly predicts positive outcomes; False Negative (FN), where the model incorrectly predicts a negative outcome for a positive class; False Positive (FP), where the model wrongly predicts a negative outcome for a case that is actually positive; and True Negative (TN), where the model accurately predicts a negative outcome. The confusion matrix enables the computation of several key metrics that are instrumental in assessing the model’s performance.
Confusion Matrix
Predicted
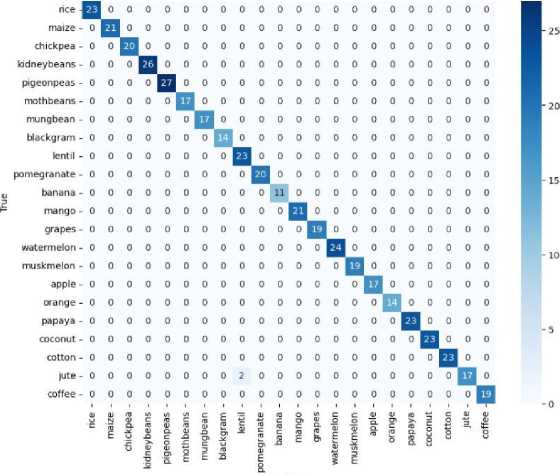
Fig. 5. Confusion matrix
Figure 5 shows the confusion matrix for the Naive Bayes model, which performs well for most crops, such as rice, maize, and kidney beans, achieving perfect accuracy. However, for jute, misclassifications were observed, including 2 samples incorrectly categorized. This may be due to overlapping features or insufficient feature representation. Reducing misclassification and improving model performance can be achieved through additional feature engineering, such as incorporating soil pH and temperature, balancing the dataset for minority crops, and using ensemble models to enhance overall accuracy.
-
• Accuracy is a metric that evaluates the overall performance of a model by calculating the ratio of correctly predicted instances (True Positives and True Negatives) to the total number of instances in the dataset.
Accuracy =
TP+TN TP+TN+FP+FN
-
• Precision (also called Positive Predictive Value) is a measure of the model’s performance of making positive pre-dictions and the accuracy of these predictions. This can be calculated using the following equation:
Precision =
TP+FP
Precision represents the percentage of true positive predictions out of all positive cases predicted by the model.
-
• Recall is defined as the ratio of predicted positive events that are correct to all actual positive cases. We can calculate it through the following equation:
Recall =
TP
TP+FN
-
• F1-score evaluates the harmonic mean of the Precision and Recall to provide a more fair assessment. This statistic effectively illustrates the model’s simultaneous attainment of both accuracy and recall. The F1-score is calculated using the following equation:
F1-score = 2.
Precision . Recall
Precision+Recall
-
4.4. Performance Comparison of the Models
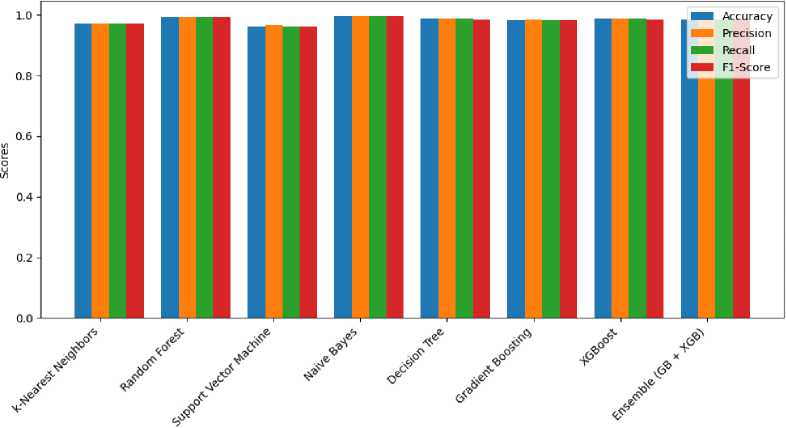
To identify the most suitable crops for specific fields, we implemented and evaluated eight machine learning (ML) algorithms using various performance metrics, including accuracy, precision, recall, F1-Score, and ROC curve. The results of these evaluations are summarized in Table 5, while Figure 6 visualizes the performance comparison across the models.
Table 5. Performance Metrics for Various Classification Models
|
Model |
Accuracy |
Precision |
Recall |
F1-Score |
|
k-Nearest Neighbors |
0.9705 |
0.9722 |
0.9705 |
0.9706 |
|
Random Forest |
0.9932 |
0.9937 |
0.9932 |
0.9932 |
|
Support Vector Machine |
0.9614 |
0.9673 |
0.9614 |
0.9612 |
|
Naive Bayes |
0.9955 |
0.9958 |
0.9955 |
0.9954 |
|
Decision Tree |
0.9864 |
0.9868 |
0.9864 |
0.9863 |
|
Gradient Boosting |
0.9818 |
0.9843 |
0.9818 |
0.9819 |
|
XGBoost |
0.9864 |
0.9871 |
0.9864 |
0.9863 |
|
Ensemble (GB + XGB) |
0.9841 |
0.9859 |
0.9841 |
0.9842 |
With a precision, recall, and F1-Score of 99.55%, as well as the highest accuracy of 99.55%, Naive Bayes was the best-performing model. These results highlight its exceptional ability to make accurate and consistent predictions, making it the most reliable model for crop recommendation. The Random Forest model closely followed, with an accuracy of 99.32% and an F1-Score of 99.32%. This model demonstrated strong generalization capabilities, making it a robust alternative for this task. Decision Tree and XGBoost both delivered excellent results, achieving an accuracy and F1-Score of 98.64%. Their comparable performance indicates their suitability for crop recommendation, with the added advantage of potential computational efficiency. The Gradient Boosting model achieved an accuracy of 98.18% and an F1-Score of 98.19%, while the Ensemble model combining Gradient Boosting and XGBoost slightly outperformed it, with an accuracy of 98.41% and an F1-Score of 98.42%. These models provide a reliable alternative for prediction tasks, leveraging their ensemble-based strength. With an accuracy of 97.05% and an F1-Score of 97.06%, the k-Nearest Neighbors (KNN) method demonstrated moderate performance. Although effective, it was less capable of handling the dataset’s complexity compared to other models. Support Vector Machine (SVM) had the least effective performance, with an accuracy and F1-Score of 96.14%. Its struggle with the dataset’s complexity suggests it may not be the ideal choice for crop recommendation in this context.
Comparison of Model Performance Metrics
Models
Fig. 6. Performance comparison of different classifiers
4.5. ROC Curves
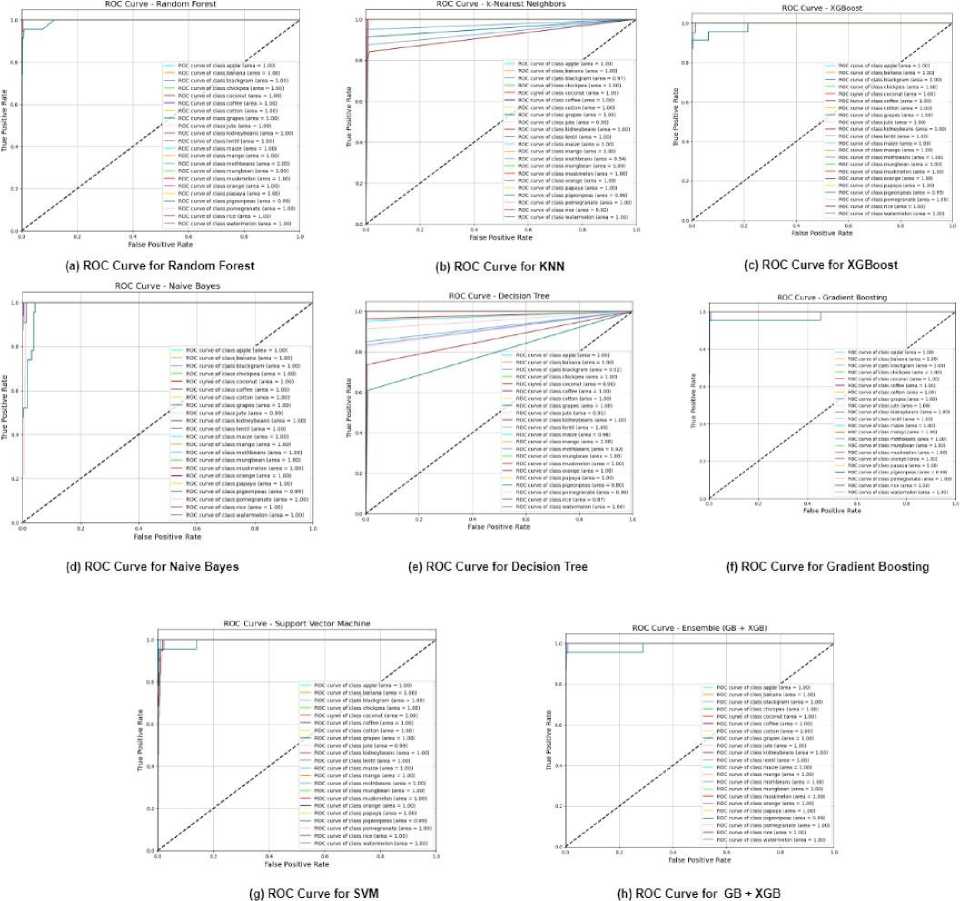
Fig. 7. ROC curves of different ML algorithms
For each of the models, the ROC Area Under the Curve (AUC) provides the basis for model evaluation. It displays a binary classifier’s precision for each classification threshold. It shows TPR against FPR using threshold value manipulation. Multiclass ROC curves are utilized to evaluate the effectiveness of each approach in comparison to all other classes. The algorithm’s AUC performance of the algorithm for each class ranges from 0 to 1. The ROC curve analysis, as depicted in Figure 7, highlights the superior performance of the Random Forest model. It consistently achieves an AUC score ranging between 0.96 and 1.00 across various classes, demonstrating its strong capability in distinguishing between different crop types.
-
4.6. Cross-Validation Approach
In this study, a robust 10-fold cross-validation strategy was employed to evaluate the performance of various machine learning models. This approach involves dividing the dataset into 10 equal parts (folds). During each iteration, one-fold is used as the test set (highlighted in red in Figure 8), while the remaining nine folds are used for training (highlighted in blue). This process is repeated 10 times, ensuring that every fold serves as a test set exactly once. The primary advantage of this technique is that it reduces the bias and variance associated with training and testing on a single split of the data. By using the entire dataset for both training and testing across the folds, the method provides a reliable estimate of model performance. For this study, the mean accuracy across all 10 folds is reported as the final performance metric for each model.
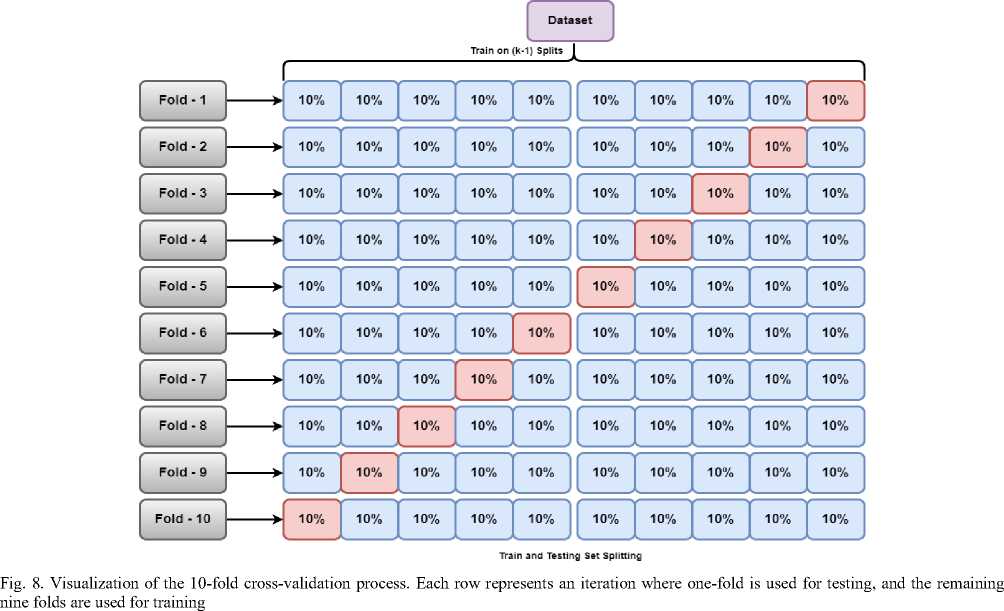
Each model was trained on 90% of the data and tested on the remaining 10%, and this process was repeated 10 times, ensuring that each data point was used for both training and testing. The average accuracy across all folds is reported for each model, providing a robust estimate of model performance. The following table 6 shows the crossvalidation results for each model:
Table 6. Cross-validation results for each model, including XGBoost and Ensemble (GB + XGB). The accuracy for each fold and the average accuracy across all folds is reported
|
Model |
Fold 1 |
Fold 2 |
Fold 3 |
Fold 4 |
Fold 5 |
Fold 6 |
Fold 7 |
Fold 8 |
Fold 9 |
Fold 10 |
Accuracy |
|
k-Nearest Neighbors |
0.9818 |
0.9727 |
0.9727 |
0.9773 |
0.9818 |
0.9818 |
0.9909 |
0.9818 |
0.9818 |
0.9818 |
0.9805 |
|
Random Forest |
0.9955 |
0.9955 |
1.0000 |
0.9909 |
0.9955 |
0.9955 |
0.9955 |
0.9955 |
0.9773 |
0.9955 |
0.9936 |
|
Support Vector Machine |
0.9909 |
0.9864 |
0.9864 |
0.9682 |
0.9773 |
0.9818 |
0.9864 |
0.9636 |
0.9773 |
0.9682 |
0.9786 |
|
Naïve Bayes |
1.0000 |
0.9955 |
1.0000 |
0.9909 |
0.9909 |
1.0000 |
0.9909 |
1.0000 |
0.9864 |
0.9955 |
0.9950 |
|
Decision Tree |
0.9864 |
0.9864 |
0.9955 |
0.9909 |
0.9909 |
0.9909 |
0.9955 |
0.9909 |
0.9818 |
0.9955 |
0.9905 |
|
XGBoost |
0.9955 |
0.9955 |
0.9955 |
0.9909 |
0.9955 |
0.9909 |
1.0000 |
0.9864 |
0.9909 |
1.0000 |
0.9941 |
|
Ensemble (GB + XGB) |
0.9909 |
0.9955 |
0.9955 |
0.9864 |
0.9955 |
0.9909 |
1.0000 |
0.9909 |
0.9864 |
1.0000 |
0.9932 |
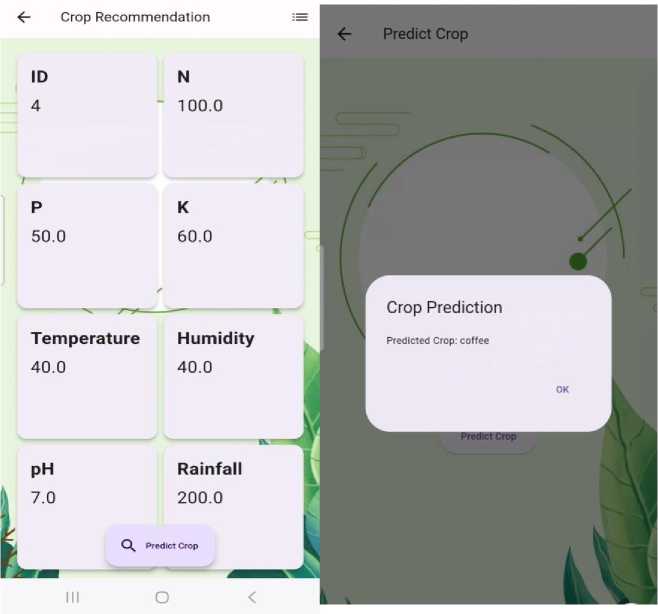
Fig. 9. Mobile Application Interface
-
4.7. Hypothesis Testing Using t-Test
In this section, we perform hypothesis tests using the t-test to compare the performance of the Naive Bayes model with other models based on four metrics: Accuracy, Precision, Recall, and F1-Score. For each metric, the null hypothesis ( H 0 ) states that there is no significant difference between Naive Bayes and the other models, while the alternative hypothesis ( H 1 ) states that there is a significant difference.
To perform a two-sample t-test, we assume that the data for each metric is normally distributed and that the variances between groups are equal. The t-statistic for the comparison between two models (e.g., Naive Bayes vs. k-Nearest Neighbors) can be calculated using the following formula 5 where, Xi and X 2 are the sample means of the two model’s performance metrics, s 1 and s 2 are the sample standard deviations of the two models, and n 1 and n 2 are the sample sizes for each model’s performance metric.
(Xi- X2)
Is i2 ! S2 2
\ n i П2
The null hypothesis is rejected since the absolute value of the computed t-statistic exceeds the critical t-value from the t-distribution table at a significance level of 0.05. Therefore, we conclude that there is a significant difference in the metric between the Naive Bayes model and the other models.
-
4.8. Crop Recommendation via Mobile Application
-
4.9. Model Insights and Error Impact
A key component of the proposed system is an intuitive mobile application that provides real-time updates on various field conditions, such as pH, and nutrient levels. These readings are obtained from sensors embedded in the field. When the user taps the “Predict” button, the system processes the collected data and sends it to the trained model hosted on the server’s back end. The model then generates a crop recommendation based on the input data. Figure-9 illustrates a screenshot of the mobile interface displaying the recommended crop. Additionally, users can access graphs that show trends in the field parameters over time.
-
• Model Interpretability: Naive Bayes, as a probabilistic method, provides class probabilities that can be used to interpret the contribution of each input variable to the model’s predictions. In our analysis, conditional probabilities were examined to identify which environmental and soil parameters, such as NPK levels, temperature, humidity, and pH, had the most significant impact on crop recommendations. This interpretability is vital for creating confidence among end-users, as it helps them to grasp the logic behind the model’s suggestions, enabling farmers to make educated decisions based on transparent insights into the variables
driving crop selection.
-
• Generalizability: The model’s generalizability was assessed by evaluating its performance across different farming environments with varying soil and environmental conditions. Cross-validation was employed to ensure that the model did not overfit to the training data, and its ability to generalize to unseen data was validated using separate test sets from the diverse agricultural conditions. The model’s consistent performance across these varied conditions suggests a strong potential for deployment in different crop farming settings, making it adaptable and reliable for use in various geographic regions and soil types.
-
• Impact of False Positives and Negatives: In a real-world setting, the implications of false positives (incorrectly recommending a crop that is not suitable) and false negatives (failing to recommend a suitable crop) can be significant. Therefore, we analyzed the confusion matrix to understand the distribution of the prediction errors. For instance, a false positive might lead to the recommendation of a crop that cannot thrive in the given environmental conditions, potentially resulting in financial losses for the farmer. Conversely, a false negative result might prevent a farmer from considering a viable crop that could improve yield. We quantified these impacts by calculating precision, recall, and F1-score for each crop category, ensuring that the Naive Bayes model’s recommendations are both accurate and reliable. These additional metrics provide a more comprehensive evaluation of the Naive Bayes model, ensuring that it is not only accurate but also interpretable, generalizable, and robust against potential errors in practical agricultural applications.
-
4.10. Challenges
While our IoT-based crop recommendation system offers a promising approach to enhancing agricultural operations, certain challenges must be addressed.
• Sensor Calibration and Accuracy: The accuracy of the system heavily relies on the proper calibration of sensors. Real-world applications of sensors such as NPK, pH, and rainfall sensors face challenges including calibration drift over time, susceptibility to environmental factors like temperature and humidity, and potential measurement errors due to soil heterogeneity. Inconsistent calibration or sensor degradation can lead to erroneous data, which directly affects the reliability of crop recommendations. Regular maintenance and calibration are essential to mitigate these issues, however implementing such practices in resource-constrained or remote farming areas can be challenging. Furthermore, mechanisms to detect and compensate for data anomalies, such as self-calibrating algorithms or redundancy in sensor deployment, are being explored to improve system reliability.
• Data Transmission in Remote Areas: The system’s dependence on Wi-Fi for data transmission presents challenges in remote or rural agricultural environments where network connectivity may be unreliable or unavailable. Additionally, data loss during transmission due to interference or weak signals can compromise the accuracy and timeliness of recommendations. This limitation can hinder real-time data gathering and decision-making, potentially impacting the effectiveness of the system in such settings. To address these challenges, the integration of fault-tolerant communication protocols and alternative data transmission methods, such as offline data logging with periodic uploads, are being considered.
• Scalability: The present implementation is aimed for small to medium-sized agricultural businesses. To address the scalability necessary for real-world farms that frequently consist of several plots and large-scale sensor networks, several changes have been proposed. The system now integrates advanced communication technologies such as LoRa and Zigbee, which extend the range of data transmission while maintaining low power consumption. Modular sensor networks have been implemented, enabling efficient data aggregation and reducing network bottlenecks. Additionally, cloud-based architectures are employed to manage and analyze the increased data volumes effectively, ensuring seamless operation across diverse and expansive farming environments. These improvements make the system adaptable to large-scale agricultural scenarios, providing reliable and efficient support for modern farming practices. Future work will focus on testing and optimizing these features in real-world, large-scale deployments.
• Environmental Variability: The system is calibrated based on specific environmental and soil parameters relevant to particular crop types. However, the variability across different geographical locations and seasons can affect the system’s performance. Such variability can also exacerbate the inaccuracies caused by sensor limitations and calibration issues. Strategies such as dynamic recalibration based on historical and local data trends, and incorporating machine learning models to adapt recommendations to diverse conditions, are being explored to address this challenge. The generalizability of the model to diverse environments requires further validation and potentially the development of region-specific calibration models.
5. Conclusion
In this study, we have proposed an IoT-based crop recommendation system that integrates real-time environmental monitoring with machine learning algorithms to optimize crop selection. The method demonstrates favorable outcomes in terms of accuracy and use, delivering a practical tool for farmers to boost production and sustainability. However, while the system shows significant potential, several challenges must be addressed before it can be widely adopted. One of the primary challenges is the integration of this system with the existing farming practices. Many traditional farmers may lack the technical expertise to effectively utilize IoT technologies, necessitating comprehensive training and support. Additionally, the cost-effectiveness of deploying and maintaining such a system, particularly in remote or resource-limited areas, requires careful consideration. The initial investment in IoT devices, sensors, and mobile application infrastructure could be a barrier to adoption for small-scale farmers. Another challenge is ensuring the system’s scalability and adaptability to different farming environments. Factors such as changes in temperature, soil types, and local crop kinds can dramatically alter the system’s performance. Therefore, more study is necessary to confirm the system’s effectiveness in varied settings and to create strategies for adaptation to fit unique regional demands. Finally, while the system leverages Random Forest for high accuracy, the potential impact of false positives and negatives in real-world applications must be carefully managed. Incorrect recommendations can lead to suboptimal farming decisions, affecting yields and profitability. Thus, ongoing evaluation and refinement of the machine learning models, as well as the inclusion of more robust error-handling mechanisms, are essential to ensure reliable operation in practice.
