Iron enriched domestic glassy carbon composite as powerful tool for the phenol sensing

Author: Zherebtsov D.A., Tolstoguzov D.S., Shtin S.V., Smolyakova K.R., Matveev K.V., Stankovic D.M.
Journal: Вестник Южно-Уральского государственного университета. Серия: Химия @vestnik-susu-chemistry
Section: Физическая химия
Article in issue: 4 т.17, 2025.
Free access
The paper describes a new method for obtaining glassy carbon nanocomposite materials con-taining metals. New method for composite electrode production offers excellent mechanical and galvanic contact of active nanoparticles and glassy carbon matrix. Both glassy carbon, iron and magnetite nanopar-ticles were formed simultaneously upon calcination of phenol-formaldehyde resin and iron carboxylate so-lution in N,N-dimethylformamide. According to transmission electron microscopy, scanning electron mi-croscopy and powder x-ray diffractometry, iron forms particles of 10 … 30 nm in size, uniformly distri-buted in the glassy carbon matrix and the main phases of iron are Fe and Fe3O4. The electrochemical beha-vior of the material in the presence of phenol was examined in detail and a square wave voltammetry me-thod was developed for the detection of phenol, which enabled precise and accurate detection in the concen-tration range from 3 to 150 μm. During the work, conditions for the most accurate determination of phenol in aqueous solutions were found. The detection limit and the limit of quantitative determination of phenol in aqueous solutions on selected electrodes were determined. Finally, the method was successfully applied to control the concentration of phenol in the water of the Miass River, where it showed very little influence of pollutants and sensitivity to phenol.
Glassy carbon composite, Fe3O4 nanoparticles, square wave voltammetry, phenol detection
Short address: https://sciup.org/147252526
IDR: 147252526 | UDC: 544+546+54.05 | DOI: 10.14529/chem250414
Обогащённый железом стеклоуглеродный композит как мощный инструмент для датчиков фенола
В статье описывается новый метод получения стеклоуглеродных нанокомпозитных материалов, содержащих металлы. Новый метод получения композитных электродов обеспечивает отличный механический и гальванический контакт активных наночастиц и стеклоуглеродной матрицы. При прокаливании фенолформальдегидной смолы и раствора карбоксилата железа в N,N-диметилформамиде одновременно образуются наночастицы стеклоуглерода, железа и магнетита. По данным просвечивающей электронной микроскопии, сканирующей электронной микроскопии и порошковой рентгеновской дифрактометрии, железо образует частицы размером 10…30 нм, равномерно распределенные в стеклоуглеродной матрице, а основными фазами железа являются Fe и Fe3O4. Детально исследовано электрохимическое поведение материала в присутствии фенола и разработан метод квадратно-волновой вольтамперометрии для определения фенола, что позволило проводить точное и надежное детектирование в диапазоне концентраций от 3 до 150 мкм. В ходе работы найдены условия для наиболее точного определения фенола в водных растворах. Определены предел обнаружения и предел количественного определения фенола в водных растворах на выбранных электродах. Метод успешно применён для контроля концентрации фенола в воде реки Миасс, где он показал крайне малое влияние загрязняющих веществ и чувствительность к фенолу.
Text of the scientific article Iron enriched domestic glassy carbon composite as powerful tool for the phenol sensing
Due to the increase in the anthropogenic load on the environment, every year rises an accumulation and concentration of pollutants in the water sources, in living organisms themselves [1–3], in plants [1, 3–5] and, as a result, in food [1–5]. The tightening of regulatory requirements for the quality of the environment, food and the standard of living of people requires the development of new methods and materials for the determination in liquid media (for example, water, blood, urine, wine) [6– 8] of the residual content of harmful and hazardous organic compounds, for example such as antibacterial, antifungal and antiviral agents [3, 9]. Thus, phenolic compounds are part of the disinfectants widely used in the context of the COVID-19 pandemic. Therefore, the analytical determination of phenols and their derivatives is of great interest in the field of environmental protection, preservation of human health, and sustainable development of future generations.
In determining the content of organic compounds electrochemistry is a powerful and versatile tool, which is able to detect low analyte concentrations [3]. One of the main advantages of electrochemical methods is the direct analysis of the complex mixtures without the tedious and time-consuming steps of sample preparation. Electrochemical methods based on the use of improved electrodes [10, 11] make it possible to determine trace amounts of organic substances in various media with a high degree of accuracy and minimal cost. Voltammetric sensing of phenolic compounds after HPLC column increases sensitivity by orders of magnitude comparing to standard UV sensing [5]. Electroanalytical methods are well suited for the determination of phenolic compounds in industrial, environmental [11–15], or food samples [5, 8].
Carbon paste electrodes for the analysis of phenolic solutions, excludes additional processing of electrodes between studies, for example, laborious polishing [7]. The carbon paste electrode for phenols sensing may contain a single-walled carbon nanotube composite [15], multi-walled carbon nanotubes modified with cobalt phthalocyanine [16], natural calcium phosphate [17], modified glassy carbon with single-walled carbon nanotubes [18], glassy carbon electrode coated with a graphene/polymer film [19]. Recent review presents technologies for manufacturing electrochemical sensors for detection of phenolic compounds using carbon nanomaterials such as graphene and its derivatives, carbon nanotubes, carbon nitride, carbon dots, carbon nanofibers, carbon nanospheres, and mesoporous carbon [20].
The sensitivity and selectivity of the sensors may be improved by adding metal oxides to the carbon filler. Iron oxides are known as one of the very electrochemically active species. Magnetite nanoparticles were added into carbon paste electrode to be used as electrochemical sensor for sinapic acid, sy-ringic acid and rutin [8]. Determination of these phenolic compounds in real red and white wine samples showed superior sensitivity, selectivity, reproducibility, stability, and low cost compared to magnetite-free screen-printed gold electrodes. The nanocomposite Fe2O3/reduced graphene oxide was fabricated for the electrochemical detection of acetaminophen [21]. A highly sensitive amperometric glucose biosensor was developed using maghemite (γ-Fe 2 O 3 ) nanoparticles ~20 nm in size [22]. Review [23] describes iron oxide nanoparticles usage in electrochemical nanobiosensors, including immuno-, enzymatic, DNA-, and aptamer types.
Phenol was also detected using electrodes modified with other metals. Platinum nanoparticles deposited on graphite-like carbon nitride [24], platinum electrode with poly(3-methylthiophene) film [25], bismuth nanoparticles and tyrosinase [26], reduced graphene oxide (rGO) with zinc oxide [27]. The ternary oxide (Sr, Ni, Zn)O was used for detection of hydroquinone [28].
Resuming, the catalytic effect of metal oxides on the detection of phenolic substances is a fastgrowing topic, and obtaining an electrode material with a wide detection range and a low sensitivity limit is still an urgent task. The mixing of catalytic nanoparticles and the glassy carbon powder in the paste electrode results in a point contact between the particles and to a significant galvanic resistance between them. In this work, we propose a new method for the synthesis of glassy carbon composites containing iron oxide, and validated the sensitivity and dynamic range of the electrochemical determination of phenol in water.
Materials and methods
Preparation of Fe3O4/C composites. All chemicals were of analytical grade and were used as supplied from Vekton (Sankt-Peterburg, Russia) without further purification. Synthesis of iron-carbon nanocomposite was carried out by the original method. As a source of iron, its organic salts were used. Anthranilic, phthalic or benzoic acids in a little excess were added to 10% NaOH to form solutions of its sodium salts. These solutions were mixed with an equivalent amount of 10% FeCl3 solution. The precipitated iron salts were filtered off, washed and dried in air. Novolac phenol-formaldehyde resin was used as a source of glassy carbon. N,N-dimethylformamide has been used as a common solvent for iron salts and phenolic resin. As a reference sample, pure glassy carbon was prepared according to the same scheme, without any iron salts. The labeling of the obtained composites corresponds to the iron carboxylate used for the synthesis: Anthr, Phthal, and Benz, respectively, for iron anthranilate, phthalate, and benzoate, as well as GC for the glassy carbon material.
To the 3 g of phenol-formaldehyde resin the proper amount of Fe carboxylate was added, so that 5% metal per 95% carbon to be obtained in the Phthal and Benz composites, and 0.5% metal per 99.5% carbon in the Anthr composite (Fig. 1). To these mixtures 7 ml of N,N-dimethylformamide was added as a common solvent. After that, the flasks were closed and kept for 2 days at 100°C. After cooling, the flasks with the obtained polymer gels were placed in a stainless steel container filled with charcoal, preventing oxidation of samples. The container was heated to 600°C for 24 hours, then from 600 to 900°C for 2 hours.
The resulting composite nanomaterials were studied by powder X-ray diffraction, transmission and scanning electron microscopy, and X-ray fluorescence spectroscopy. The metal content in the composite was refined by the combustion method. Additionally, the value of benzene vapor absorption on the ground composite was determined.
Carbon composites were grinded and passed through a 50 μm sieve, after which a paste for the electrode was prepared using vacuum oil with 80:10 powder to oil ratio. The homogeneous paste was pressed into a 3 mm bore diameter polypropylene tube electrode.
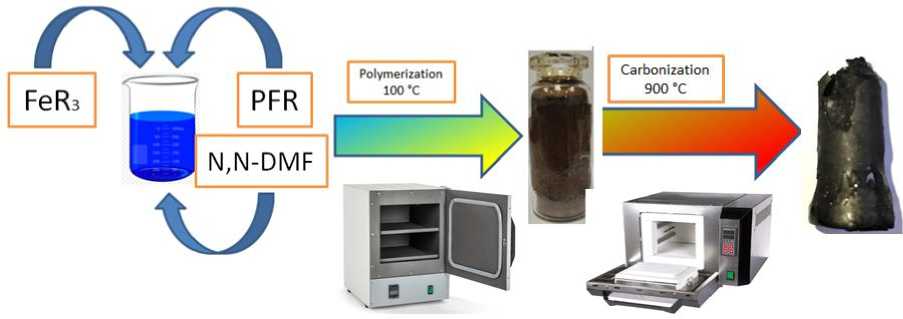
Fig. 1. Scheme for the synthesis of carbon composite materials
Chemicals and Apparatus. All chemicals were of analytical grade and were used as supplied without any further purification. Boric acid, acetic acid, phosphoric acid, sodium hydroxide, potassium chloride (KCl), potassium ferricyanide (K 3 [Fe(CN) 6 ]), potassium ferrocyanide (K 4 [Fe(CN) 6 ]) and phenol were supplied by Vekton (Sankt-Peterburg, Russia).
For the electrochemical study, a VoltMetrika R-150X potentiostat-galvanostat (Russia) and a Corrtest CS2350 bipotentiostat-bigalvanostat (China) were used. In the three-electrode cell the glassy carbon cup was used as a counter electrode and the reference was a silver chloride electrode.
To evaluate the catalytic properties of the composites, cyclic voltammetry was performed in an aqueous solution with 0.1 M KCl, 0.005 M K 3 [Fe(CN) 6 ], 0.005 M K 4 [Fe(CN) 6 ]. The study took place in the potential range from –0.3 to +0.6 V at a scanning rate of 10 to 150 mV/s. The same solution was used for EIS measurements using potential of 0 V and frequency range from 0.01 to 105 Ω at amplitude 20 mV.
After working with a solution of Fe+2/+3, the influence of pH on phenol oxidation in buffer solutions with pH from 2 to 12 was studied. Experiments were carried out on the same electrodes (1 mM phenol, potential range –0.1…+1.5 V, scan rate 50 mV/s). Supporting electrolytes (Britton-Robinson buffers) were prepared with a mixture of acids (0.04 M CH 3 COOH, 0.04 M H 3 PO 4 , 0.04 M H 3 BO 3 ). The solution 1 M NaOH was used to adopt desired pH.
Then, at the optimal pH, a series of CVs were carried out with an increase in the phenol concentration from 1 μM to 1 mM. Prior each new cycle, the surface of the paste electrode was cleaned by cutting off a 0.1 mm thick layer of paste.
Next, a series of voltammograms was made on a bipotentiostat-bigalvanostat using square wave ( SW ) and differential pulse ( DP ) voltammetry methods with increasing phenol concentration from 0.1 μM to 1 mM. The operating characteristics of the methods were optimized: for SW – wave frequency 40 Hz, wave amplitude 50 mV, scanning speed 50 mV/s, for DP – wave amplitude 80 mV and wave time 40 ms, total pulse time 200 ms, scanning speed 50 mV/s.
Results and discussion
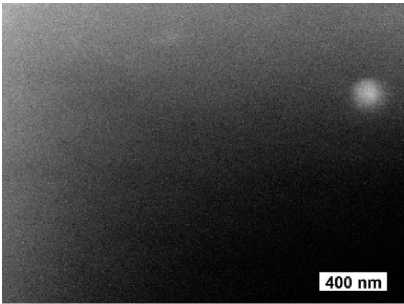
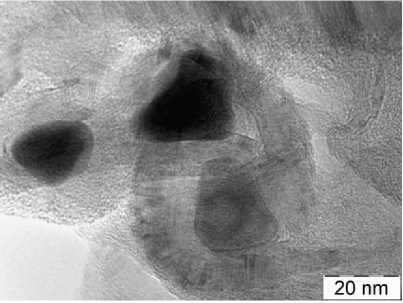
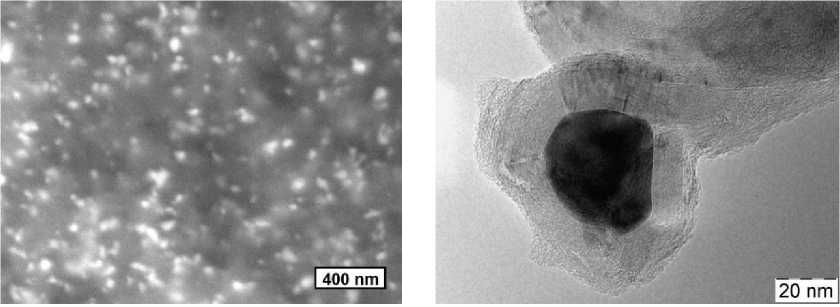
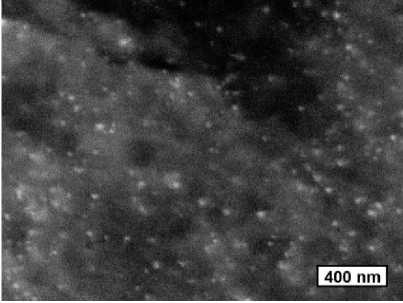
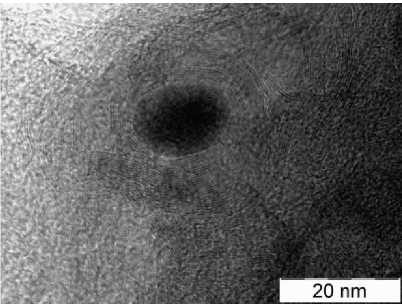
Morphology and structure of the Materials. According to scanning electron microscopy, it can be concluded that particles of crystalline phases form agglomerates ranging in size from 20 to 200 nm (Fig. 2). Transmission electron microscopy reveals iron containing particles of 10 … 30 nm in size, and often these particles are surrounded by a multilayer “blanket” of graphite, 5 … 10 nm thick. Benzene vapor adsorption was measured at partial pressure 0.7 P 0 of saturated benzene vapor above grinded composites. Per 100 g of Anthr, Phthal and Benz composites it was absorbed 7.2, 15.9 and 14.1 g of benzene. These values are proportional to microporosity and surface area of the material.
X-ray phase analysis allows to conclude that all three composites contain graphite, magnetite Fe3O4 and cementite Fe 3 C (Fig. 3). The sizes of crystalline particles determined from reflection broadening are in the range of 2 … 20 nm (Table 1). The Rietveld analysis of diffraction patterns made it possible to estimate the ratio of these phases, and combustion at 700 °C – the total content of iron (Table 2).
Table 1
The sizes of crystalline particles
|
Composite |
Size according to powder X-ray diffraction (nm) |
Particle size according to TEM/SEM data (nm) |
|
Anthr |
Graphite: 3 |
20 … 30 / 30 … 200 |
|
Fe 3 O 4 : 20 |
||
|
Fe 3 C: 15 |
||
|
Fe: 4 |
||
|
Phthal |
Graphite: 4 |
20 … 30 / 30 … 60 |
|
Fe 3 O 4 : 12 |
||
|
Fe 3 C: 2 |
||
|
Fe: 5 |
||
|
Benz |
Graphite: 4 |
10 … 25 / 20 … 30 |
|
Fe 3 O 4 : 6 |
||
|
Fe 3 C: 2 |
||
|
Fe: 8 |
a)
b)
c) d)
e)
Fig. 2. Morphology of Anthr (a, b), Phthal (c, d), Benz (e, f) composites according to scanning (a, c, e) and transmission (b, d, f) electron microscopy
f)
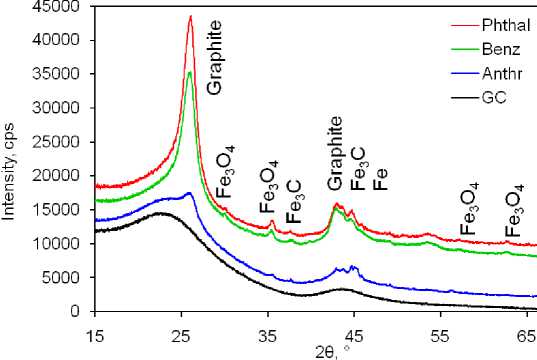
Fig. 3. X-ray diffraction patterns of composites. Reflections are labeled by corresponding phase
Table 2
Composition of samples
|
Composite |
Phase composition (wt. %) |
Total Fe content (wt. %) |
|
GC |
GC: ~100 |
0 |
|
Anthr |
Graphite: ~10 |
0.40 |
|
Fe 3 O 4 : 0.03 |
||
|
Fe 3 C: 0.07 |
||
|
Fe: 0.30 |
||
|
GC: ~90 |
||
|
Phthal |
Graphite: ~85 |
5.3 |
|
Fe 3 O 4 : 0.66 |
||
|
Fe 3 C: 0.04 |
||
|
Fe: 4.6 |
||
|
GC: ~10 |
||
|
Benz |
Graphite: ~85 |
5.7 |
|
Fe 3 O 4 : 0.59 |
||
|
Fe 3 C: 0.01 |
||
|
Fe: 5.1 |
||
|
GC: ~10 |
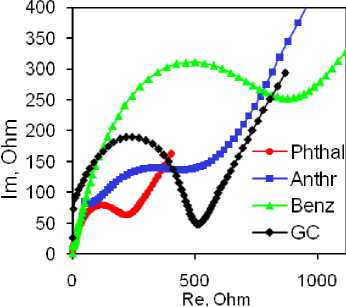
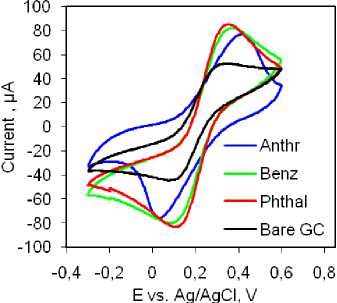
Electrochemical Characterization of the Electrodes. EIS and CV measurements were utilized in the analysis of electrochemical properties of the prepared materials within the field of electroanalytical chemistry. The examination of the samples using the [Fe(CN) 6 ]3–/4– redox probe revealed that the Phthal composite exhibited the lowest resistance (Fig. 4a). The Rct value for the Phthal electrode was calculated to be around 300 Ω, while the other electrodes displayed higher values: bare GC electrode 510 Ω, Anthr electrode 900 Ω, and Benz modified electrode 1200 Ω. Similarly, cyclic voltammetry provided comparable results.
a)
b)
c)
Fig. 4. 0.1 M KCl, 0.005 M K 3 [Fe(CN) 6 ], 0.005 M K 4 [Fe(CN) 6 ] solution: Nyquist plots (a),
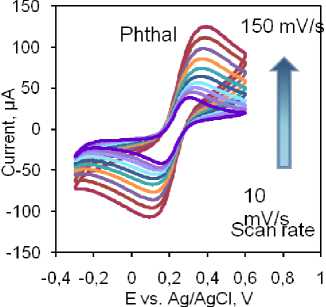
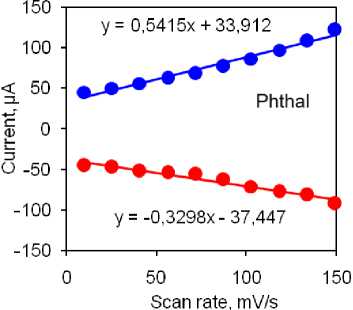
CV at 50 mV/s (b), CV at 10-150 mV/s for Phthal (c) and dependence of peak current on scanning rate for Phthal (d)
d)
The highest currents for reduction and oxidation peaks were observed with the same electrode. The Benz electrode exhibited a similar current response, while the Anthr and bare GC electrodes demonstrated lower currents (Fig. 4b). Additionally, the Phthal electrode displayed the smallest peak-to-peak separation, indicating excellent diffusion capabilities and low resistance at the electrode-testing solution interface. Considering these findings, we recommend further analysis using the Phthal electrode. To further investigate the electrocatalytic properties of this electrode, we examined the effect of scanning speed on the catalytic response in the same solution. The results are summarized in Figs. 4c and 4d. Increasing the scanning speed from 10 to 150 mV/s resulted in a linear increase in the peak currents for both redox processes. This linearity is demonstrated by the corresponding linear equations given in Figure 4d. The linear relationship between peak currents and scanning rates suggests that the processes at the electrode surface are adsorption-controlled. This assumption is further supported by a slight, yet noticeable, shift in the peak potentials – oxidation towards more positive values and reduction towards more negative values, indicating adsorption-controlled reactions.
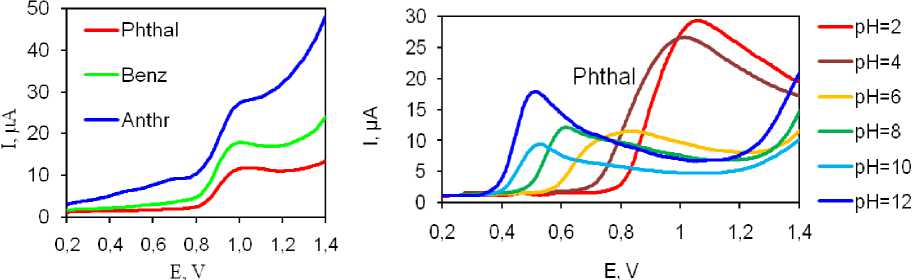
Optimization of Experimental Parameters. Phenol oxidation using all three prepared electrodes showed oxidation peaks at around 1 V Fig. 5a. Comparing current values the highest current was obtained using Phthal modified electrode. It is worth mentioning that current differences were not significantly big, and that other two electrodes showed around 15 … 20 % lower currents. In addition, background current for Phthal electrode was lowest promising best analytical parameters after optimization.
a)
ш
1,2
1,0
0,8
0,6
0,4
0,2
0,0
b)
d)
-0,050х+ 1,193 . R2= 0,85

у = -0,031х + 0,848 R2 = 0,8371
2 3 4 5 6 7 8 9 101112
pH
c)
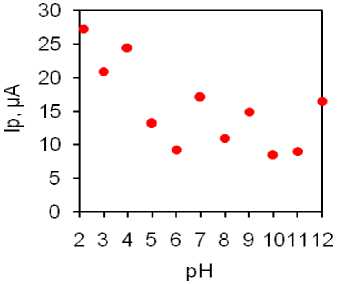
Fig. 5. Phenol oxidation: peaks on three electrodes (a), phenol CV on Phthal electrode in buffer solutions, С=1 mM (b), dependence of the peak potential on pH on Phthal electrode (c), dependence of current in relation to pH on Phthal electrode (d)
In accordance with this study and with electrochemical characterization of the electrodes, Phthal modified electrode was used for all further investigations. The synthesized composite was used for phenol detection. Firstly, to determine the conditions under which the obtained composites exhibit the greatest sensitivity, a CV was carried out in buffer solutions with pH from 2 to 12 (Fig. 5b … d). Considering the phenol oxidation peak current over whole tested range, the pH = 2 was found to provide most pronounced, well defined and shaped peak (Fig. 5b). Thus, this pH was selected for all further studies. Fig. 5c illustrates the dependence of the peak potential on pH. In acidic environments from pH 2 to pH 7, we can observe a linear relationship expressed by the inserted equation. The slope of this curve is 50 mV, which is close to the value of 59 mV for processes involving equal numbers of protons and electrons. This behavior is expected for analytes with phenolic groups where 2 protons and 2 electrons are involved in an electrochemical oxidation reaction with a quinone structure as the end product of the reaction. The dependence of current in relation to pH, shown in Figure 5d, indicates that the highest current was achieved at pH 2, so this pH was used for all further research and development of the detection method.
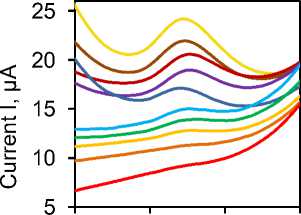
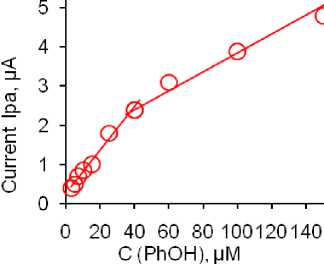
Development of analytical procedure. SW voltammetry is of great importance in electrochemical analysis as it allows for quick and sensitive detection of redox reactions. It enables the measurement of low concentrations of analytes and provides valuable information about their electrochemical behavior. Because of this, we selected SWV to develop an electroanalytical method for the detection of phenol using our developed method. Fig. 6a shows the voltammograms obtained by successively adding a standard solution of phenol in the range of concentrations from 3 to 150 μm, while Fig. 6b depicts the linear dependence of the peak current intensity depending on the concentration. As can be seen, the linear curve is divided into two parts and the first part is in the concentration range from 3 to 40 μm while the second is in the concentration range from 40 to 150 μm. This behavior and the existence of 2 slopes through the linearity range can be related to the adsorption of the analyte on the electrode surface. At lower concentrations, the contribution of adsorption is smaller and there is a more significant participation of the diffusion process, while at higher concentrations the electrode reaction is controlled exclusively by adsorption. Limit of detection (LOD) and limit of quantification (LOQ) were determined based on formulas, respectively. The values of LOD = 1.9 µm and LOQ = 4.9 µm were obtained. The reproducibility, repeatability and stability of the sensors were also investigated. By recording 5 voltammograms for a concentration of 30 μm phenol using the same electrode, under optimized conditions a difference in current was obtained which was 4.5%. At the same time, this concentration was tested with 5 different electrodes. In this study, the difference in current initiation was 4.1%. The response of this phenol concentration was monitored with the same sensor for a month, and measurements were taken every other day. Current differences during this study were up to 5%. All these values show that the developed sensor shows a stable response over time as well as decisive parameters of the reproducible method, so based on these results it can be concluded that the precision and accuracy of the method are at a satisfactory level and that it can be used for application in real samples.
150 μM
b)
^^^^^^^^м 100 μM
^^^^» 60 μM
^^^^^^^^^40 μM
^^^^^^^^^ 25 μM
^^^^^^^^15 μM
^^^^^^^^^ 10 μM
^^^^^B7 μM
0,7 0,9 1,1 1,3 ^^^^^^^M5 μM
E vs. Ag/AgCl, V ^^^^^^^^B3 μM
a)
Fig. 6. SWV curves of phenol oxidation (a) and peak current versus concentration at SWV (b). Equations refer to diffusion part of dependence
Interferences Studies. Investigation of the effect of interfering ions was done using common cations and anions found in water. This was done in accordance with the idea to investigate the use of the proposed sensor for the detection of phenol in surface water. The tested cations and anions (Na, K, Mg, Ca, Cu, Co, Cl, NO3, SO4) showed no significant change in the peak current for 40 µm phenol, since the change was less than 10% of the initial value. All tested ions were at a concentration 10 times higher than the analyte. Based on this, we can conclude that the proposed method is sufficiently selective and that there is a possibility of its use for monitoring the concentration of phenol in water.
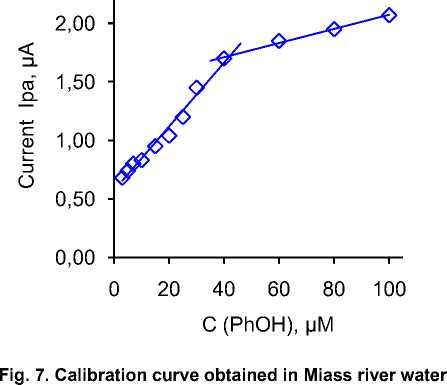
Application of the method in natural water. The practical use of the method was tested in surface water obtained from the Miass River in the city of Chelyabinsk. Since the initial tests showed that there is no detectable concentration of phenol in this water, we tried to spike the sample with different concentrations of phenol covering the entire linear range as in the case of the development of the detection method. It is important to note that the basic electrolyte was prepared using 10 ml of BRBS buffer and 40 ml of river water. Fig. 7 shows the linear curve of SWV voltammogram current dependence on phenol concentration. As can be seen, the appearance of this curve is identical to the case of method development, so it can be concluded that there is no significant matrix effect of natural waters on the determination of phenol using our sensor. Slightly lower values of the current can be attributed to the conductivity (due to dilution), while the only influence of the matrix can be seen in a slightly higher value of the background current, but this is an expected effect.
Conclusions
Nanocomposites of glassy carbon matrix with Fe 3 O 4 , Fe 3 C, and Fe nanoparticles have been successfully prepared by “one pot” route. Introduction of iron salts into phenolic resin solution made it possible to obtain after calcination a reliable mechanical and galvanic contact of nanoparticles with a glassy carbon matrix.
The resulting composite with content of about 5 wt. % iron are sensitive for phenol oxidation with a linear range of 3 … 150 μM. This approach enables the domestic production of all components of electrochemical sensors, which can be significant for the development of a sustainable, environmentally friendly analytical method.
