Исследование эксплуатационных характеристик фотоэлектрического воздухосборника с ребрами из пеноалюминия

Автор: Элмнифи М., Дуюн Т.А.
Журнал: Инженерные технологии и системы @vestnik-mrsu
Рубрика: Электротехнологии и электрооборудование
Статья в выпуске: 3, 2025 года.
Бесплатный доступ
Введение. Фотоэлектрические тепловые коллекторы являются перспективной технологией, способной генерировать электроэнергию и рекуперировать тепловую энергию. Однако, как правило, рабочие температуры фотоэлектрических элементов слишком высоки для эффективной работы. Одним из способов решения этой проблемы является использование фазовых материалов и проводящих структур для улучшения терморегулирования и повышения эффективности. Цель исследования. Целью данной работы является оценка использования ребер из пеноалюминия и фазных материалов для улучшения характеристик фотоэлектрического коллектора с воздушным охлаждением и, что более важно, влияния этих материалов на выход тепла и электричества. Для отвода тепла изготовлен каркас из пеноалюминия, который был размещен на задней части солнечной панели. Материалы и методы. Испытания проводились как в летних, так и в зимних условиях эксплуатации. Также были проверены рабочие параметры и проведено сравнение с уже имеющимися данными исследований. Результаты исследования. Результаты показали, что общая производительность фотоэлектрического теплового коллектора варьировалась от 43,07 до 50,35 % летом и от 47,94 до 51,53 % зимой. Эти результаты демонстрируют, что использование ребер из пеноалюминия оказывает значительное влияние на управление температурой и эффективность преобразования энергии по сравнению с обычными фотоэлектрическими тепловыми системами. Обсуждение и заключение. Данное исследование показывает, что фотоэлектрические тепловоздушные коллекторы с фазированными материалами представляют собой практичный и эффективный подход к использованию возобновляемых источников энергии, обеспечивающий повышенную стабильность работы и увеличение выработки энергии. Исследование также демонстрирует потенциал гибридных фотоэлектрических тепловых систем как платформы для устойчивого развития энергетики.
Фотоэлектрический тепловой коллектор, разнообразный климат, энергоэффективность, возобновляемые источники энергии
Короткий адрес: https://sciup.org/147251936
IDR: 147251936 | УДК: 621.3 | DOI: 10.15507/2658-4123.035.202503.573-588
Performance Studies of Photovoltaic Air Collector with Aluminum Foam Fins
Introduction. Photovoltaic thermal collectors are a promising technology capable of generating electricity and recovering heat energy. However, the operating temperatures of photovoltaic cells are typically too high for efficient operation. One way to mitigate this problem is to use phase materials and conductive structures as an approach to improving thermal regulation and overall efficiency. Aim of the Study. This paper aims to evaluate the suitability of aluminum foam fins and phase materials in improving the performance of an air-cooled photovoltaic collector and, more importantly, the impact of these materials on thermal and electrical yields. An aluminum foam frame was fabricated and placed on the back of a solar panel to serve as a heat dissipation medium. Materials and Methods. To ensure consistency in experimental tests, experimental tests were conducted under both summer and winter operating conditions, and performance parameters were tested and compared with available studies to determine reliability.br /> Results. The results revealed that the overall performance of the photovoltaic thermal collector ranged from 43.07 to 50.35% in summer and from 47.94 to 51.53% in winter. These results demonstrate that the incorporation of aluminum foam fins has a significant impact on thermal management and energy conversion efficiency compared to conventional photovoltaic thermal systems. Discussion and Conclusion. In summary, this study demonstrates that photovoltaic thermal air collectors with phased materials represent a practical and effective approach to renewable energy practices, offering improved operational stability and increased energy production. The study also demonstrates the potential of hybrid photovoltaic thermal systems as a platform for sustainable energy development.
Текст научной статьи Исследование эксплуатационных характеристик фотоэлектрического воздухосборника с ребрами из пеноалюминия
ENGINEERING TECHNOLOGIES AND SYSTEMS
EDN:
Solar modules can be cooled using passive heat transfer via phase exchange materials (PCM). By PCM is included in the back floor of the solar module, it absorbs excess heat from the photovoltaic (PV) in the shape of latent heat, helping to maintain the favored surface temperature for a certain period. The heat of the PV is transferred to the PCM by conduction, and this manner can be advanced and highly regulated by using radial designs. To deal with the problem of low thermal of PCM, the use of composite PCM is a superb method. In addition, a new approach to the usage of two types of PCM at the same time can be implemented to enhance thermal regulation, resulting in better overall performance in the year [1].
PV technology has played a pivotal role in the global transition to renewable energy, driven by rapid developments in PV technology. However, high operating temperatures, and the resulting reduced conversion efficiency and long-term performance, are among the most significant limitations on solar module performance. The electrical efficiency of a PV module can decrease by 0.4–0.5°C for every degree Celsius increase in its surface temperature. Therefore, appropriate cooling mechanisms are essential to improve the overall efficiency and sustainability of PV systems.
PCM have proven to be an interesting option among passive cooling methods. PCM absorb thermal energy as latent heat when incorporated on the backside of PV modules during their phase transition. This absorption helps maintain the module surface temperature at the desired level for a relatively long period, enhancing energy production. Heat transfer between photovoltaic modules and PCM relies on conduction. This process can be improved through specific structural designs, such as radial geometries or fins, which increase the effective heat transfer area. However, one of the main drawbacks of conventional PCM is their low thermal conductivity, which limits their cooling capacity. To overcome this problem, researchers have proposed the use of composite PCMs, in which additives such as graphite, metal foams, or nanoparticles are added to enhance thermal conductivity and accelerate the material's charge/discharge cycles. Furthermore, a more advanced approach involves the simultaneous use of two PCM with different melting points [2]. This will enable good thermal control across different seasons, ensuring better results year-round by extending the PV module's operating temperature. Overall, incorporating PCM, particularly in composite or dual- PCM designs, provides an economical and sustainable way to improve the performance of photovoltaic systems. This approach improves electrical performance and is part of thermal energy recovery, which increases energy consumption in photovoltaic thermal (PVT) systems.
LITERATURE REVIEW
Many scientists have explored ways to reduce the temperature of PV modules to enhance their electrical efficiency and overall functionality. Passive cooling methods, particularly PCM, have received extensive research due to their ability
^® ИНЖЕНЕРНЫЕ ТЕХНОЛОГИИ И СИСТЕМЫ Том 35, № 3. 2025 to absorb excess heat as latent heat during the melting process. However, the main weakness of conventional PCM is their poor thermal conductivity, which slows down heat transfer. To overcome this obstacle, several studies have proposed adding composite PCM to additional materials such as graphite, nanoparticles, or metal foams to enhance thermal conductivity and provide effective cooling. Furthermore, researchers have also investigated the application of aluminum foam structures and fin geometries within the PCM layer, providing superior thermal dissipation and consistent temperature regulation behind PV panels. Other researchers have recommended the use of dual or cascaded PCM with varying melting points to maintain the cooling effect for a longer period and across seasons. These developments have proven to improve the thermal and electrical efficiency of PV systems, particularly in air-cooled collectors. Overall, studies show that PCM-based cooling, especially when used with conductive materials and comprehensive designs, is effective in maintaining PV temperature and performance, enabling the integration of PVT systems into renewable energy systems.
Scientists [3] looked at the impact on the thermal management of the PCM system with fins with different spacing from 0.4 to 33 mm. The fins created better convection circulation within the PCM (RT27), and as the number of fins increased, the time to melt the PCM fully was reduced. Maximum reduction of temperature by 10°C in the PV panel occurred with 4 mm of fin spacing because of better interaction between the metal surface and PCM.
In the study [4], there was investigated the performance of system in an experimental process in Al-Ain. In novel days, the reference PV panel was orientated at a temperature of 58°C, whereas the finned PCM version achieved only 47°C at the maximum. The highest temperature differences found were those on the sunny days, 11°C, and on cloudy days, 5°C. In the study1 employing capric-palmitic acid (PCM1) and CaCl2.6H2O (PCM2), there was also studied the thermal performance of modules incorporating internally finned PCM where the climatic parameters of Dublin and Vehari were taken into consideration. In Dublin, the maximum decrease of PV temperature was attained with PCM1 to 43°C and PCM2 to 40°C. The temperatures in Vehari were reduced from 63°C to 51°C and 42°C, respectively. The outcomes of the evaluations showed that the share of cost of material and setup for PCM systems.
The paper describes [5] the performance comparison of PCM incorporated right into the vertical fins in the backside of the panel in a test in Al-Ain. During the daytime, the PCM was decreasing the temperature by 22.6°C, increasing the power 7.2% with the help of its latent heat. The fins solved the problem of the thermo physical parameter of the acetum, in particular, the low conductivity of PCM. While comparing PCM systems in both the cooler climate of Dublin and the warm climate of Vehari.
Scientists [6] have explained a similar study. To enhance thermal storage for these PCM, they employed plasmatic acid (PCM1) and CaCl2.6H2O (PCM2) with
Vol. 35, no. 3. 2025 ENGINEERING TECHNOLOGIES AND SYSTEMS .^Ts incorporated fins. PCM2 was shown to give better cooling to PV than PCM1 because of its better thermo physical properties. In Dublin, the power savings achieved were 4% and 11.3% for PCM1 and PCM2, respectively, while in Vehari the power savings included 5.1% for PCM1 and 13% for PCM2.
The authors of the study [7] demonstrated the effectiveness of fins within PCM in power output and efficiency by testing four different configurations of PV: Part of it was bare, and part of it had 3, 6, and 12 fins. The maximum temperature reduction achieved in the present study is 15°C in the PCM system with 12 fins, resulting in enhancing the PV efficiency by 5.39%. This was because of increased interaction between the PCM and the metal surface, which increased the rate at which the PCM melts.
The authors [8] assessed the performance of a Nan fluid concentrating PV thermal (CPV-T) system with PCM heat sinks. Cooling methods were investigated for a warm climate: different configurations of PCM with water and/or Nan fluid circulation with or without the integration of PCM. Based on the results, the highest cooling capability was identified for PCM utilizing Nan fluid circulation and PCM. The same configuration enabled an improvement of the electrical efficiency to 17.02% and thermal efficiency to 61.25%. Furthermore, it lowered the temperature of the PV module to about 26.6°C below that of typical CPV systems. The average size of the system output power was 20.18 W with a difference of nearly 4 W from the single CPV systems.
In the study [10] there was used copper metal foam fins incorporated in a passive cooling technique to improve the performance PV panels under experimental research. This study was conducted in Baghdad city, Iraq, in 2019. Three PV panels were tested: one of the assemblies was modified to incorporate the cooling technique described in this thesis, and two were left intact for comparative analysis. The study focused on four configurations of longitudinal fins: 4, 6, 8, and 10 fins. The findings thus showed that increasing the number of longitudinal by ten led to a drop of the average temperature about 8.4% while the power output rose by of 4.9%. The metal foam ensured air was let in to flow through the fins, thus increasing heat elimination from the PV panel.
The authors [11] conducted an experimental study on the thermal characteristics of a single solar air collector integrated with high porosity metal foams. This work was aimed at examining the influence of putting into operation the multi-flow system (MF) on the performance air collectors under the climatic of Al Ramadi, Iraq. The experiments also show that the configuration with the angle of incidence of MF at 45 degrees 45° yields the highest value of thermal efficiency of 94.8%. Subsequent to it was the MF configuration at 0° inclination (62.6%) and then the PV configuration (33.8%). Moreover, for the 45° layout, enhanced turbulent intensity increases the velocity gradients to mix cold and hot air and thus creates a bigger contrast in air temperature compared to other layouts. Hence, this study has illustrated the practicality of the ability to use high-porosity metal foams in an improvement of the solar collector performance.
The research approach combines experimental laboratory work with MATLAB modeling to improve PVT panels uniquely using aluminum foam fins. This study combines the extended heat transfer surfaces with the advantages of the foam’s porous structure, creating an integrated thermal solution that previous studies have not considered together. However, this study presents a dual-use hybrid system that meets the thermal and electrical requirements of industrial applications. The use of aluminum fins is superior to copper fins, despite the better thermal performance of copper (400 W/m.K) compared to aluminum (210 W/m.K), for three main reasons: practical, engineering, and economic limitations. Switching to aluminum over copper offers a more economical choice that allows industries to increase the adoption of the system without economic limitations [12; 13]. Aluminum provides better structural efficiency due to its lower density, despite its lower price than copper. This makes it ideal for thermal systems, as it does not require additional structural loads. The advantage of aluminum foam is its excellent strength and corrosion resistance, as it can withstand the effects of the external environment, especially in oil facilities. The porous structure of aluminum foam creates large surfaces that increase the availability of convective heat exchange, despite its lower thermal conductivity compared to copper.
MATERIALS AND METHODS
Photovoltaic thermal air collector for space heating
A schematic representation of the PVT collector is shown in Figure 1. It is made up of identical mono crystalline PV modules. The modules are thermally connected in series and electrically in parallel. A solar energy is transformed into thermal and electrical energy when it strikes the solar PV cell within the module. The battery stores the electrical energy, and the air blower beneath the PV module extracts the thermal energy that is present at its back surface. PV modules heat up because of the thermal energy, which has an impact on electrical efficiency. The PV panel’s heat must be removed to achieve optimum electrical efficiency. The photovoltaic thermal air collector has input design parameters are given [14].

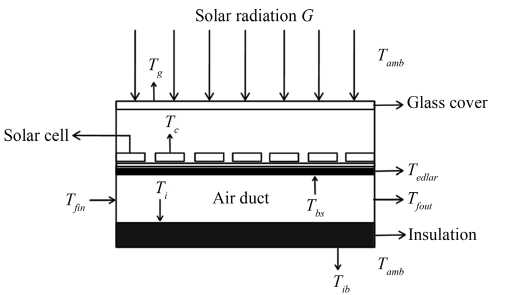
F i g. 1. Schematic cross-sectional diagram of photovoltaic thermal air collector [14]
Source: hereinafter in this article the diagrams are compiled by the authors of the article.
Mathematical model
Since we want to keep this section relatively short, we have not included the mathematical formulas for the thermal and electrical assessment of the PVT collector. Please look at the references for more information2 [14; 15]:
Thermal efficiency:
Electrical efficiency:
Overall thermal efficiency:
Q n - —; th GA
VI mp mp ^ ele j ;
A m G
П all =П th +y ee , Cf
where Qu – the useful energy rate; G – solar radiation; A – area of the collector; V mp – voltage; I mp – current; C f – plant conversion factor, taken as 0.36 [16; 17].
Computer simulation
In PVT, air collectors, thermal and electrical parameters are interdependent, requiring initial temperature guesses to calculate heat transfer coefficients and electrical efficiency accurately. Consequently, an iterative method is used to determine thermal performance parameters such as overall heat loss coefficient, efficiency factor, flow factor, and heat removal factor. The five parameters of the electrical model are determined using implicit equations, as outlined in the Electrical Model section. To input the PVT air collector’s design parameters and operating settings, a computer program was created
^® ИНЖЕНЕРНЫЕ ТЕХНОЛОГИИ И СИСТЕМЫ Том 35, № 3. 2025 in MATLAB (2020) [18]. These operating conditions include the time of day, inlet air temperature, hourly solar irradiance, relative humidity, dew point temperature, velocity of air inside the duct, and wind velocity over the glass surface.
Experimental design
The design was performed on the roof of the location in AL-Marj, Libya. Field activities were carried out under the climatic factors of AL-Marj, which is at approximately 32.45° North latitude and 20.80° East longitudinal coordinates in March 2024. Three PV modules were utilized: two were fitted with continuously extending Dimensions foam fins (5×5×10 mm) for cooling while the third was left naked to evaluate the impact comparatively of cooling. The parameters of each panel were width, 67 centimeters; length, 54 centimeters; maximum output power, 50W. More details concerning specifications for the modules are provided below in the Figure 2.
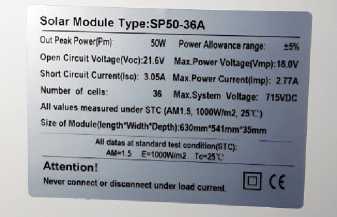
F i g. 2. Specifications for the modules
The aluminum-mounting framework was used to install the two PV panels, and as a result, the system could tilt from 0 degrees to 90 degrees. The track was turned towards the south at an angle based on what worked for AL-Marj, Libya, during a particular month, to take advantage of solar energy. The optimal values for the tilt of the axis work out to 45° for February 35° for March, and 25° for April. Each PV panel was installed so that it would receive the most sunlight.
The PV panels were fitted with 5 cm high open-cell aluminum foam fins with a porosity of 0.9. When these fins were fixed for back of the panels, air gaps between them were eliminated. Because of the thermal grease, there was efficient heat transfer between the panels and the fins. You can see an open-cell metal foam in Figure 3.
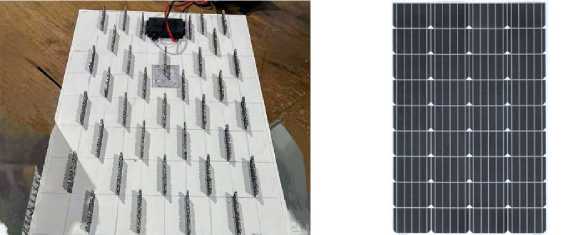
F i g. 3. Photovoltaic panels and aluminum foam fins
Several variations were included in the experiments, such as back and front surface temperatures of the PV panels, solar radiation, maximum power, current, voltage, ambient temperature, and wind speed. The data was collected every hour. Nearly 15 cm above the PV panels, a measuring instrument showed the speed of the wind. Eight K-type thermocouples were connected and used to measure the temperature in the panel. There were six TCs on the back for panel and other TCs on its surface. Another thermocouple was attached 15 cm beneath for panel to note the temperature under shaded conditions. The switches made it possible to connect the thermocouples to the Pico data logger, which has eight channels to receive this data. The data saved by the data logger was sent to a PC by connecting the computer. A Solar Survey record radiation intensity and set the ideal position for the PV panels by providing its tilt and direction using the instrument’s meter and compass. The meter for solar irradiance was placed horizontally next for the PV modules. Additionally, the results for I sc , V oc , and Pm were found by using the Solar Module Analyzer PV200 in conjunction with the created I–V curves. The following Figure 4 explains and shows the instruments that work with PV panels.
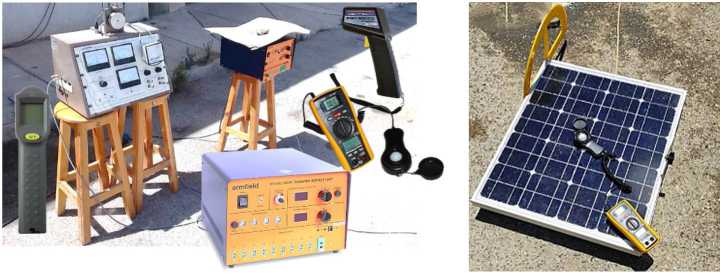
F i g. 4. Experimental equipment and devices
RESULTS
The impact of aluminum foam fins on the efficiency and operational temperature of photovoltaic panels was investigated by the present experimental analysis. The panel with no fins on the backside, reference board, and test board with fins on the backside. Figure 5 also shows the average back surface temperature difference between Panels. The temperature reductions achieved with the configuration with ten fins were 4.20°C to 2.4°C. In this analysis, it is agreed that an improvement of fins results in an increase in the decrease of panel temperature. Namely, the increase in density of the fins encourages the required velocity of airflow below the PV panel. In addition, the fin structure enables air to be drawn from beneath the PV panel in a number of directions rather than via solid fins, as observed from other research. Therefore, heat transfer through natural convection is significantly enhanced from the PV panel. Furthermore, it is important for all cases that the omnibus test of the power difference between Panels is shown in Figure 6. The highest power difference was measured for the ten-fin arrangement, estimated to be 3.99%. This results in an increase in power, and the increase is related
^® ИНЖЕНЕРНЫЕ ТЕХНОЛОГИИ И СИСТЕМЫ Том 35, № 3. 2025 to a fins. It further shows that incorporating aluminum foam fins yields a vast increase in the dissipation of heat and electrical efficiency of PV panels.
Figure 5 shows the power voltage (P–V) characteristic of a solar power system under various levels of solar radiation intensity. This graph illustrates the dependency of power output (vertical axis) on voltage (horizontal axis) with variable solar radiation measured (400 to 1 200 W/m²). The curves depict the level of solar radiation impacts on their system capacity. It was noted that both the radiation factors heightened with increasing radiation and the power output increased with the increasing radiation. This effect indicates that solar radiation is the central determinant in the performance of solar power systems.
Figure 6 shows I–V characteristics of the solar power system, which illustrates the effect of solar irradiation varying between (400 to 1 200 W/m²). an findings demonstrate that as the voltage increases, the current is reduced, which in solar cells is an anticipated attribute; the maximum current density of the cell is lighter at a higher irradiation intensity level. This emphasizes the need to enhance engineering designs for the systems to improve the efficiency of the power produced from the systems, as revealed by the curves of the solar irradiance. This paper establishes that knowing how these solar systems behave when installed can help improve their efficiency and effectiveness as renewable energy sources.
Figure 7 shows the result in temperature variation for the with and without cooling conditions over 10 hours. This data indicates that the temperature increases, but the rates are moderate in the case with cooling as compared to the one without cooling; the temperature cases in the latter reach over 55°C. These observations are an indication of the ability of the cooling system to keep the temperature at a low level, which was applicable by underpinning the need to apply cooling techniques to enhance performance in several applications.
Figure 8 compares the wind speed with the cooling efficiency, where it can be seen that the cooling efficiency increases as the wind speeds increase. The cooling efficiency ranges between 5% at 0.5 m/s and 25% at 3 m/s. All these outcomes show the correlation between the wind speed and the efficiency of the cooling systems, thus suggesting the appropriate wind conditions can ramp up the performance of cooling solutions.
Figure 9 shows the results expressed in percent are presented in an inverse correlation between temperature difference and electrical energy efficiency, with the efficiency decreasing from about 12.5% at a temperature 10°C to about 10% at a temperature 60°C. The obtained data show that the efficiency of electrical systems decreases with rising temperatures, and thus it is essential to conform to temperature differences to improve performance.
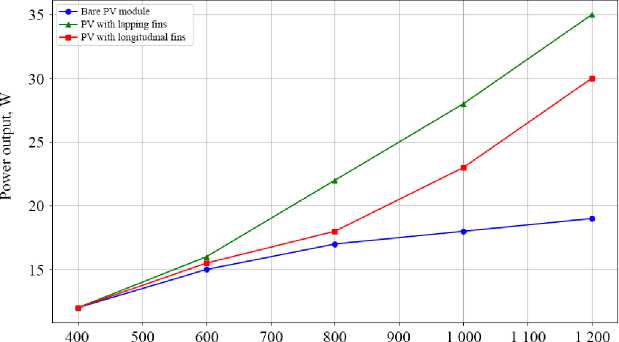
Figure 10 shows a comparison of the power output of solar modules under various cooling technologies. The standard module (blue) can generate approximately 15 W at 400 W/m² and 30 W at 1 200 W/m². The module with overlap blades (green) generates 20 W at 400 W/m² and 35 W at 1 200 W/m². The longitudinal blades (red) produce 18 W and 34 W at 1 200 W/m² respectively. These results suggest that cooling technologies improve the practicability of power generation utilizing solar irradiance, especially at higher intensities.
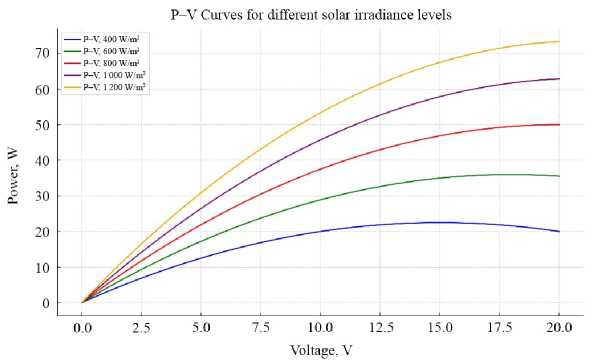
F i g. 5. Shows the power voltage (P–V)
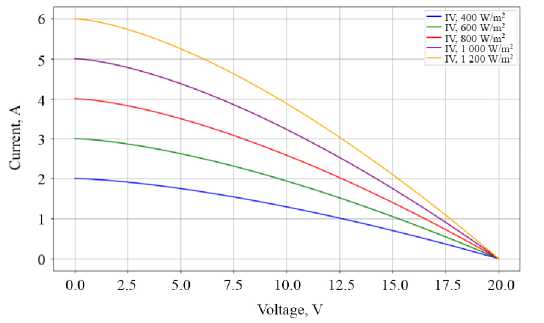
F i g. 6. Shows I–V characteristics of the solar power system
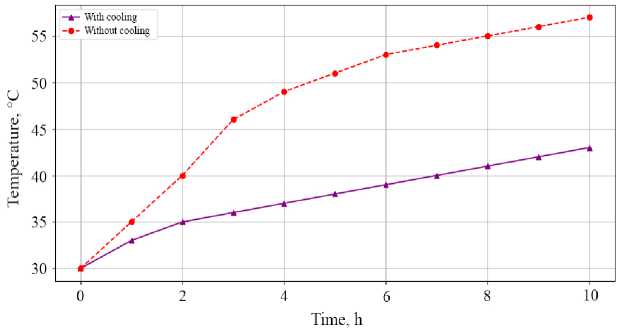
F i g. 7. Shows the result in temperature variation for the with and without cooling
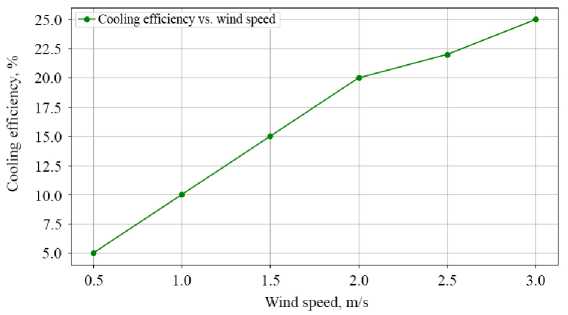
F i g. 8. Compares the wind speed with the cooling efficiency
F i g. 9. Temperature difference and electrical energy efficiency
Soar irradiance, W/in2
F i g. 10. Shows a comparison of the power output of solar modules under various cooling technologies
Figure 11 shows the thermal performance of using aluminum foam fins, where the temperature difference has been plotted time. This established that as the number of fins in the panel increases, the temperature difference also increases. It takes 14 hours to record temperature. The four-fins set with yellow color has a temperature increase of about 0.5 to 1.5°C as compared with the initial temperature. The six-fins set with orange color reach a maximum of 1.5°C. The 10-fins set with pink color has a temperature difference of more than 2.5°C the results show that the maximum number of fins improves the cooling effect of the system.
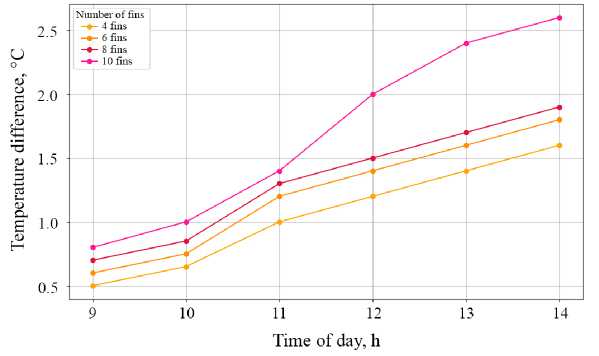
F i g. 11. Shows the thermal performance of using number of fins
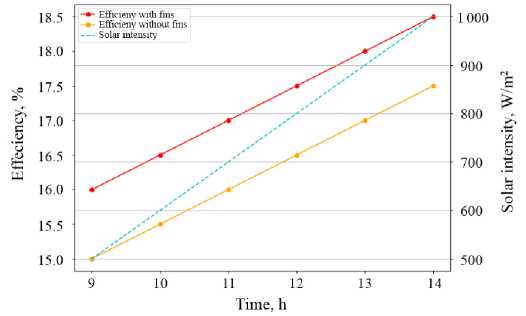
Solar insolation, electrical efficiency drops slightly, ranging from 10.24 to 11.71%. The overall efficiency is below 50%. However, in winter, PVT collector show good efficiency thermal, which reaches a maximum of 22.46%, and stable electrical efficiency of around 11.40%. The overall efficiency of PVT collector ranges from 31.93 to 54.10%.
The PVT air collector’s overall efficiency, which ranges from 39.27 to 47.87%, is lowered during summer months since its thermal electrical efficiency ranges from 10.22 to 11.92%. However, the temperature differential between the input and outlet is low in the winter. Good overall efficiency is found in the range of 44.80 to 51.09%, with thermal efficiency ranging from 10.17 to 17.60% and higher electrical efficiency spanning from 11.86 to 12.46%.
Figure 12 shows represents the changes in Open circuit current on panels with and without cooling fins from 9:00 AM and 2:00 PM. Data indicates that the current is gradually rising in both cells because the solar intensity increases during the day. For the upcoming hour, the current was found to be 2.5 amps for the finned panel and 2.3 amps for the finless panel. When the time 2:00 PM, 3.0 amps of current were passing through the finned panel, whereas 2.8 amps passed through the finless panel. Because the current kept going down from panel to panel, we can conclude that cooling fins make heat dissipate better, cool down the panel, and improve its performance while using electricity. Therefore, the use of cooling adds 7–9% more power from the PV cell in the afternoon compared to an uncooled panel.
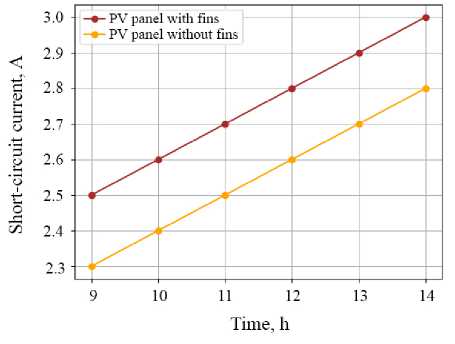
F i g. 12. Shows Open circuit current
DISCUSSION AND CONCLUSION
In the experiment, aluminum foam was added to photovoltaic panels to improve their cooling and efficiency. The aluminum foam layer acted as the cooler and glued the photovoltaic module to the other components using an adhesive designed for heat transfer. The layer was added to lower the temperature on the panels as warm air could cause solar cell efficiencies to drop. During the experiment, four types of fins were tested to see how they affected the temperature and electricity output of the panel. Since the fins are found where air is plentiful, they can quickly transmit heat into the air. Using 10 fins on the backside of the panel resulted in a drop in temperature of 9%, compared to the control group. By reducing the temperature, the semiconductor will function better and solar cells will lose less heat, resulting in a higher open-circuit voltage. When airflows were medium to strong, the technique made use of this to increase the rate at which fins were cooled by convection.
