Исследование методом главных компонент влияния геометрии нейтрального токового слоя гелиосферы и солнечной активности на модуляцию галактических космических лучей

Автор: Гололобов П.Ю., Кривошапкин П.А., Крымский Г.Ф., Герасимова С.К.
Журнал: Солнечно-земная физика @solnechno-zemnaya-fizika
Статья в выпуске: 1 т.6, 2020 года.
Бесплатный доступ
Исследуется совокупное модулирующее воздействие геометрии нейтральной поверхности межпланетного магнитного поля и солнечной активности на распространение галактических космических лучей в гелиосфере. При помощи метода главных компонент произведена оценка роли каждого фактора в модуляции космических лучей. Применение метода к экспериментальным данным по уровню солнечной активности, углу раствора нейтральной поверхности и интенсивности космических лучей за длительный период времени с 1980 по 2018 г. позволило выявить временную динамику роли каждого фактора в модуляции. Показано, что характер модуляции сильно зависит от полярности общего магнитного поля Солнца. Результаты исследования подтверждают существующие теоретические представления о гелиосферной модуляции, а также отражают ее особенности почти за четыре полных цикла солнечной активности.
Модуляция космических лучей, межпланетное магнитное поле, нейтральный токовый слой, солнечная активность
Короткий адрес: https://sciup.org/142224286
IDR: 142224286 | УДК: 524.1, | DOI: 10.12737/szf-61202002
Investigating the influence of geometry of the heliospheric neutral current sheet and solar activity on modulation of galactic cosmic rays with a method of main components
The work studies the cumulative modulating effect of the geometry of the interplanetary magnetic field's neutral current sheet and solar activity on propagation of galactic cosmic rays in the heliosphere. The role of each factor on the modulation of cosmic rays is estimated using a method of main components. The application of the method to experimental data on solar activity, to the tilt angle of the neutral sheet, and cosmic ray intensity for a long period from 1980 to 2018 allows us to reveal the temporal dynamics of roles of these factors in the modulation. The modulation character is shown to strongly depend on the polarity of the Sun’s general magnetic field. Results of the study confirm the existing theoretical concepts of the heliospheric modulation of cosmic rays and reflect its peculiarities for almost four full cycles of solar activity.
Текст научной статьи Исследование методом главных компонент влияния геометрии нейтрального токового слоя гелиосферы и солнечной активности на модуляцию галактических космических лучей
Galactic cosmic rays (CRs) recorded by ground-based detectors reflect the large-scale oscillation of the heliosphere. Long-term observations of CRs have shown that their intensity experiences 11-year oscillations, which negatively correlate with solar activity (SA). Moreover, the behavior of these oscillations depends on the polarity of the general magnetic field of the Sun (GMFS) and is different in even and odd SA cycles.
For a long time, it was thought that SA had the main modulating effect on CR propagation in the heliosphere. In recent decades, it has, however, been found that along with SA CRs are modulated by the large-scale geometry of the neutral current sheet (NCS) of the interplanetary magnetic field (IMF). This most likely occurs due to the CR drift along the current sheet. Indeed, the existing theoretical models of CR drift in the heliosphere [Kota, Jokipii, 1983; Burger, 2012] suggest the existence of a relationship between the CR intensity and the NCS geometry, namely: for the negative polarity of GMFS ( qA <0), the relationship between the CR intensity and the NCS tilt angle should be significantly closer than that for the positive polarity ( qA >0). A qualitative comparison between a theoretical model and experimental data also confirms the above assumption [see, e.g. Potgieter, Moraal, 1985; Smith, Thomas, 1986; Reinecke et al., 1990] . The effect of the relationship between the NCS geometry and the SA level on the CR modulation level can significantly vary from cycle to cycle. Monitoring of this relationship is of particular interest for the study of the temporal dynamics of the heliospheric CR modulation. At present, the existing sufficiently long series of experimental data on heliospheric and CR parameters provides such an opportunity.
One way to study the relationship between the observed CR intensity and various solar and heliospheric parameters is a correlation analysis. The method allows us to determine the role of each parameter in CR modulation; and in the case of cross-correlation analysis, to also take into account the delay or advance of CR response. For example, Usoskin et al. [1998] have examined the CR intensity dependence on the SA level; and El-Borie, Hamdy [2018] , on the NCS tilt angle. Paouris et al. [2012] have studied the CR intensity dependence on SA indices and heliospheric parameters and have obtained an empirical model consisting of a combination of different heliospheric and solar parameters and capable of describing the observed intensity fairly accurately. In particular, it has been found that the best agreement between the model and the experiment is achieved with the following parameters: sunspot number, index of coronal mass ejections [Mavromichalaki et al., 2007] , IMF strength, and NCS tilt angle. According to the results obtained in the above mentioned and other works (e.g., [Krainev, 2012; Gupta et al., 2006] ), the key global heliospheric parameter modulating galactic CRs, along with SA, is the NCS geometry.
In this paper, we investigate the period from solar cycle 21 to 24. Characteristics of SA temporal development during this period are briefly described in [Ishkov, 2018, 2013] . The author indicates that in general the last four SA cycles have the following features: solar cycles 21and 22 are characterized by increased SA; in solar cycles 22 and 23, the Gnevyshev-Ohl rule was violated: SA in cycle 22 became higher than in cycle 23; solar cycle 23 was the longest and lowest in the last century; solar cycle 24 appeared to be even lower than cycle 23 — it is considered to be the beginning of the epoch of
This is an open access article under the CC BY-NC-ND license
low SA [Ishkov, 2018]. The above facts indicate the global transition period of SA, which should be reflected in GCR modulation in the heliosphere.
The situation is somewhat different for the NCS geometry. According to estimates made at the Wilcox Solar Observatory [], the NCS tilt angle in solar cycles 21–24 does not vary much from one cycle to another in contrast to the sunspot number. In particular, the NCS tilt angle is minimum during solar minima (~5°) and maximum during solar maxima (~75°). It should, however, be noted that unlike previous cycles in cycle 23 the decrease in the NCS tilt angle lasted for a longer time.
Krymsky et al. [2001a, 2001b] , using the method of main components, have demonstrated the role of the NCS geometry in the heliospheric CR modulation recorded at the neutron monitor stations in Rome, McMur-do, and Tokyo in 1982–1988 ( qA <0) and 1992–1998 ( qA >0). It has been found that the CR dependence on the NCS tilt angle increases when qA <0 (1982–1988) and decreases when qA >0 (1992–1998). This behavior is confirmed by theoretical calculations [Krainev, Kalinin, 2013] . Nevertheless, despite the uniqueness of the picture, it is worth noting that at that time only solar cycles 21 and 22 were studied, and today the series of experimental data has been supplemented with data on cycles 23 and 24. Given the fact that the last cycles were truly anomalous, of great interest is the application of the approach used in [Krymsky et al., 2001a, b, c] to them.
METHOD OF ANALYZING
THE DEPENDENCE OF COSMIC RAY MODULATION
ON SOLAR ACTIVITY LEVEL AND NEUTRAL CURRENT SHEET DEFORMATION
The difference between this work and the majority of works is in the use of the method of main (principal) components, which can exclude mutual correlations of the parameters under study. Considering that almost all solar and heliospheric parameters in some way depend on each other, their mutual correlation complicates the identification of the dominant factor in GCR modulation.
In this paper, we suppose that the major global heliospheric factors are the SA level and the NCS form. As the experimental data on the SA level we have used data on the sunspot number W provided by the World Data Center SILSO [ m_ ], and have determined the NCS geometry from its tilt angle χ, using calculations made with the classical model at the Wilcox Solar Observatory (for more detail, see [ ]). We assume that all other factors have a smaller effect and therefore can be neglected.
The GCR intensity I has been obtained from data from the neutron monitor at the Oulu station (65.05° N, 25.47° E, Rc~0.8 GV, the data is available at the website []) over the period from January 1982 to December 2018. This data (Figure 1) covers the last four SA cycles and two solar magnetic cycles.
Let us explain the principle of the method of main components, which takes into account the proportionality coefficient k = tanα relating both the factors by the relation χ = kW . To exclude the mutual dependence of χ and W , we go over to new variables:
χ′=cosα – W sinα, (1)
W ′ = χsinα – W cosα, (2) which do not correlate. Then, establishing a relation between Ix = в ' х ' and 4 = в ’ X ' , find
I (χ, W ) = β 1 χ + β 2 W + const , (3)
Pj = e ’ cosa + в ’ sin a, в2 = - в ’ sin a + в ’ cos a, (4)
where β 1 and β 2 are proportionality coefficients [Krymsky et al., 2001 a, b]. The recovered intensity I (χ, W ) represents the CR intensity arising from CR modulation by χ and W . The narrower the spread of points between the recovered and observed CR intensities, the more confidently we can say that only these two parameters are fundamental in the heliospheric CR modulation. The correlation coefficients R x and R W between the recovered intensity I (χ, W ) and the parameters χ and W respectively are useful as a measure of modulation efficiency of SA level and NCS form.
For the successful application of the method, we have to exclude GMFS polarity reversal periods from processing because at these moments owing to strong fluctuations on the Sun we cannot correctly estimate the contribution of the modulating factors. Furthermore, to trace the dynamics of the aggregate effect of the analyzed parameters χ and W on the CR intensity from cycle to cycle, we have separately examined periods of SA decrease and increase. As a result of this separation, we have considered four periods of SA decrease and three periods of SA increase for 1982–2018, which are listed in Table. It can be seen that the length of each period is
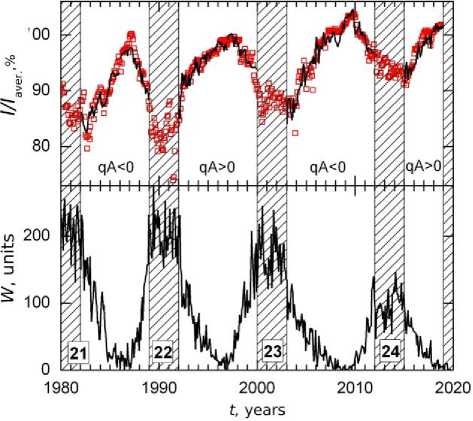
Figure 1. GCR intensity recorded at the Oulu station I/Iaver for 1982–2018 (top panel, red squares); CR intensity I(χ, W) restored from Equation (3) (top panel, solid black curve). Sunspot number derived from data available at [ ] (bottom panel). Numbers of SA cycles and GMFS polarity are shown at the bottom of each panel. Periods of polarity reversal are marked with shaded areas
3–5 years. The choice of such short periods is dictated by the purpose of the work — to study the role of the above factors in different SA phases. It should be understood that in this case the accuracy of the results inevitably decreases. Nevertheless, we believe that the application of the method with the decreased accuracy of the results still allows us to achieve the purpose.
RESULTS AND CONCLUSIONS
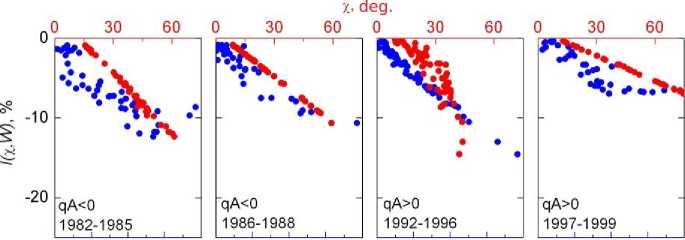
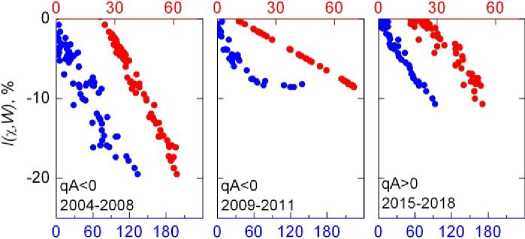
Figure 2 shows the relationship of the CR intensity I(χ, W), restored from Equation (3), with the NCS tilt angle χ and sunspot number W during the descending and ascending phases of SA in cycles 21–24. Table presents the correlation coefficients Rx and RW and the proportionality coefficients I (%, W)]% and I (%, W)[W calculated for the above periods. Figure 2 and Table suggest that during the four SA cycles the relationship between I(χ, W) and both the parameters χ and W is fairly close: linear correlation coefficients Rx and RW have quite high values from 0.87 to almost a strictly linear dependence. We can see in this case that the relationship between Rx and RW changes in a certain way depending on GMFS polarity and SA phase. Firstly, in all the three periods of SA increase Rx> RW. Secondly, during periods of SA decrease the relation between these coefficients is ambiguous: at qA<0 Rx>RW, whereas at qA>0, on the contrary, Rx
Table
GMFS polarity, correlation coefficients R x and R W , and percent of recovered CR intensity I (χ, W ) (%) relative to the sunspot number W and NCS tilt angle χ for descending and ascending phases of SA for 1982–2018
|
No. |
Period, year |
GMFS polarity |
R x |
R W |
, %/deg |
, %/u |
|
1 |
1982–1985 |
qA <0 |
–0.997±0.011 |
–0.866±0.072 |
–0.25 |
–0.05 |
|
2 |
1986–1988 |
–0.999±0.003 |
–0.933±0.060 |
–0.19 |
–0.05 |
|
|
3 |
1992–1996 |
qA >0 |
–0.868±0.064 |
–0.990±0.018 |
–0.30 |
–0.06 |
|
4 |
1997–1999 |
–0.999±0.004 |
–0.873±0.081 |
–0.10 |
–0.04 |
|
|
5 |
2004–2008 |
qA <0 |
–0.965±0.034 |
–0.904±0.055 |
–0.45 |
–0.13 |
|
6 |
2009–2011 |
–0.999±0.003 |
–0.874±0.081 |
–0.14 |
–0.06 |
|
|
7 |
2015–2018 |
qA >0 |
–0.936±0.051 |
–0.986±0.024 |
–0.26 |
–0.12 |
W, units
X. deg
W, units
Figure 2. Recovered CR intensity I (χ, W ) versus sunspot number W (blue circles) and neutral surface tilt χ (red circles) during periods of SA decrease and increase for 1982–2018
We can conclude that the results of calculations we have obtained are in general agreement with concepts of the CR drift motion in the heliosphere except for the period of SA increase in 1997–1999, where, contrary to expectations, R x > R W . This is likely due to the following circumstances: firstly, the selected period is short enough; secondly, in this work we ignore the known fact of delay of CR response to variations in heliospheric parameters (see, e.g., [Usoskin et al., 1998; Tomassetti et al., 2017, Mavromichalaki et al., 2007, Iskra et al., 2019] ). It is, however, impossible to choose a longer period since its extension toward SA maximum would enhance the distorting effect of sporadic solar wind streams. As for the impact of the delay, the preliminary calculations we have made under the assumption that the delay time is about one year did not significantly change the overall picture. On the other hand, among the periods considered this period is the only period of SA decrease when qA >0. To give an unambiguous answer to this question, it is necessary to wait for the next similar period — the beginning of solar cycle 25.
The proportionality coefficients I ( x , W)/ x and I ( x, W)/W listed in Table reflect the relationships of the recovered CR intensity with the NCS form and the SA level respectively. These coefficients are seen to exhibit the following behavior: I ( x, W)/x has different values during different SA phases — its value during SA decrease is always higher than during its increase and varies within 0.1-0.45 %/deg.; I ( x, W ) /W has an average value close to 0.05 %/u, but during some periods it sharply increases 2–3 times. Table shows that the last two SA cycles feature increased coefficients as opposed to the previous ones.
The SA minimum between cycles 23 and 24 is the period of unusually long weakening of the heliospheric CR modulation during which the CR intensity reached maximum values over the entire period of ground-based observations [Zhao et al., 2014; Gushchina et al., 2014] . We can assume that the overestimated proportionality coefficients obtained in the last two SA cycle are associated with the filling of the modulating volume of the heliosphere by galactic CR in conditions of prolonged low SA. Such filling occurs by inertia, and hence the longer the low SA level the higher the CR intensity.
CONCLUSION
Using the method of main components, we have studied the aggregate effect of the SA level and the IMF neutral surface tilt on GCR modulation in the heliosphere in certain periods of the last four solar cycles. We have shown that when qA <0 the CR modulation is predominantly determined by the current sheet geometry; and when qA >0, by the SA level. These results confirm the current theoretical concepts of the CR drift motion in the heliosphere. We have obtained a result that is not consistent with the theory — during the ascending phase of SA when qA >0 the CR modulation occurred mainly due to changes in the NCS geometry. This fact requires further study.
The work was performed within the framework of budgetary theme AAAA A17-117021450058-6. We thank researchers of the Wilcox Solar Observatory [], the World Data Center SILSO [ txt], CR station of the University of Oulu and Sodankyla Geophysical Observatory [] for providing the data.
Список литературы Исследование методом главных компонент влияния геометрии нейтрального токового слоя гелиосферы и солнечной активности на модуляцию галактических космических лучей
- Ишков В.Н. Периоды пониженной и повышенной солнечной активности: наблюдательные особенности и ключевые факты // Всероссийская ежегодная конференция по физике Солнца "Солнечная и солнечно-земная физика - 2013": Труды. Санкт-Петербург, 2013. С. 111-114.
- Ишков В.Н. Космическая погода и особенности развития текущего 24-го цикла солнечной активности // Геомагнетизм и аэрономия. 2018. Т. 58, № 6. С. 785-800. DOI: 10.1134/S0016794018060056
- Крайнев М.Б. О характеристиках гелиосферы, важных для галактических космических лучей, в фазе минимума солнечной активности // Краткие сообщения по физике ФИАН. 2012. № 6. С. 13-20.
- Крайнев М.Б., Калинин М.С. О структуре интенсивности галактических космических лучей при ее долговременных вариациях // Изв. РАН. Сер. физ. 2013. Т. 77, № 5. С. 574-576.
- Крымский Г.Ф., Кривошапкин П.А., Герасимова С.К. и др. Модуляция космических лучей гелиосферным нейтральным слоем // Геомагнетизм и аэрономия. 2001а. Т. 41, № 4. С. 444-449.
- Крымский Г.Ф., Кривошапкин П.А., Герасимова С.К. и др. Нейтральный слой и дрейф частиц в долгопериодных вариациях космических лучей // Изв. РАН. Сер. физ. 2001б. Т. 65, № 3. С.353-355.
- Burger R.A. Modeling drift along the heliospheric wavy neutral sheet // The Astrophys. J. 2012. V. 760, N 1. P. 1-5.
- DOI: 10.1088/0004-637X/760/1/60
- El-Borie M.A., Hamdy A. A correlative study between heliospheric current sheet tilts, cosmic ray intensities and solar activity parameters // Arab J. Nucl. Sci. Appl. 2018. V. 51, N 1. P. 152-167.
- Gupta M., Mishra V.K., Mishra A.P. Cosmic ray intensity associated with sunspot numbers and tilt angle // Indian J. Phys. 2006. V. 80, N 7. P. 697-701.
- Gushina R.T., Belov A.V., Eroshenko E.A., et al. Cosmic ray modulation during the solar activity growth phase of cycle 24 // Geomagnetism and Aeronomy. 2014. V. 54, N 4. P. 430-436.
- DOI: 10.1134/S0016793214040057
- Iskra K., Soluszyk M., Alania M., Wozniak W. Experimental investigation of the delay time in galactic cosmic ray flux in different epochs of solar magnetic cycles: 1959-2014 // Solar Phys. 2019. V. 294. Р. 115.
- DOI: 10.1007/s11207-019-1509-4
- Kota J., Jokipii J.R. Effects of drift on the transport of cosmic rays. VI. A three-dimentional model including diffusion // The Astrophys. J. 1983. V. 265. P. 573-581.
- Krymsky G.F., Krivoshapkin P.A., Gerasimova S.K., et al. Deformation of the heliospheric current sheet as a reason of long-term cosmic ray variations // Proc. 27th ICRC 2001. Hamburg. Germany. 2001. P. 3871-3873.
- Mavromichalaki H., Paouris E., Karalidi T. Cosmic ray modulation: an empirical relation with solar and heliospheric parameters // Solar Phys. 2007. V. 245. P. 369-390.
- DOI: 10.1007/s11207-007-9043-1
- Paouris E., Mavromichalaki H., Belov A., et al. Galactic cosmic ray modulation and the last solar minimum // Solar Phys. 2012. V. 280. P. 255-271.
- DOI: 10.1007/s11207-012-0051-4
- Potgieter M.S., Moraal H. A drift model for the modulation of galactic cosmic rays // The Astrophys. J. 1985. V. 294. P. 425-440.
- Reinecke L.J.P., Potgieter S.M., van Staden I.M. The neutral sheet tilt dependence of cosmic ray neutron monitor intensities at different cutoff rigidities // Proc. 21st ICRC. Adelaide. Australia. 1990. V. 6. P. 95-98.
- Smith E.J., Thomas B.T. Latitudinal extent of the heliospheric current sheet and modulation of galactic cosmic rays // J. Geophys. Res. 1986. V. 91, N A3. P. 2933-2942.
- DOI: 10.1029/JA091iA03p02933
- Usoskin I.G., Kananen H., Mursula K., et al. Correlative study of solar activity and cosmic ray intensity // J. Geophys. Res. 1998. V. 103, N 5. P. 9567-9574.
- DOI: 10.1029/97JA03782
- Tomassetti N., Orcinha M., Barão F., Bertucci B. Evidence for a time lag in solar modulation of galactic cosmic rays // The Astrophys. J. Lett. 2017. V. 849, N L32 (6 pp).
- DOI: 10.3847/2041-8213/aa9373
- Zhao L.-L., Qin G., Zang M., et al. Modulation of galactic cosmic ray during the unusual solar minimum between cycles 23 and 24 // J. Geophys. Res.: Space Phys. 2014. V. 119, iss. 3. P. 1493-1506.
- DOI: 10.1002/2013JA019550
- URL: http://wso.stanford.edu/gifs/Tilts.gif (дата обращения 11 ноября 2019 г.).
- URL: http://www.sidc.be/silso/DATA/SN_m_tot_V2.0.txt (дата обращения 11 ноября 2019 г.).
- URL: https://cosmicrays.oulu.fi (дата обращения 11 ноября 2019 г.).
