Исследование особенностей возвратно-наклонного зондирования ионосферы на базе ЛЧМ-ионозонда

Автор: Пономарчук С.Н., Куркин В.И., Пензин М.С.
Журнал: Солнечно-земная физика @solnechno-zemnaya-fizika
Статья в выпуске: 3 т.3, 2017 года.
Бесплатный доступ
В работе приводятся результаты исследований возвратно-наклонного зондирования ионосферы (ВНЗ) на базе многофункционального ЛЧМ-ионозонда, разработанного в ИСЗФ СО РАН. Анализировались экспериментальные данные ВНЗ, полученные в различные сезоны за период 2005-2009 гг. Накопленный массив данных позволяет исследовать особенности распространения сигналов ВНЗ в различных гелиогеофизических условиях. Для анализа и интерпретации сигналов ВНЗ на ионограммах привлекались результаты моделирования характеристик ЛЧМ-сигналов при возвратно-наклонном зондировании ионосферы в рамках волноводного подхода. Были выявлены наиболее характерные типы ионограмм и установлены условия появления того или иного типа в зависимости от времени суток, сезона, направления зондирования, состояния среды. Зимой, весной и осенью преобладают типы ионограмм с сигналами ВНЗ, соответствующими моде распространения посредством отражения от F-слоя ионосферы. В летние периоды регистрируются сигналы, отраженные слоями E или Es. При этом частоты принимаемых сигналов достаточно велики и возможны случаи, когда отражения от слоя F отсутствуют.
Ионосфера, ионограмма, распространение радиоволн, возвратно-наклонное зондирование ионосферы
Короткий адрес: https://sciup.org/142103653
IDR: 142103653 | УДК: 621.371.3, | DOI: 10.12737/szf-33201706
Features of backscatter ionospheric sounding as studied with a chirp ionosonde
We present the results of studies of backscatter ionospheric sounding (BS) on the basis of a multipurpose chirp ionosonde developed in ISTP SB RAS. We analyze BS experimental data obtained during different seasons from 2005 to 2009. The accumulated dataset allows us to investigate features of BS signal propagation in various heliogeophysical conditions. To analyze and interpret BS signals on ionograms, we use the results of modeling of characteristics for chirp signals in the backscatter and oblique ionospheric sounding under the waveguide approach. We have revealed the most characteristic types of ionograms and have established conditions of appearance of a given type depending on the time of day, season, sounding direction, and medium conditions. In winter, spring, and autumn, the prevailing types of ionograms are those with BS signals corresponding to the propagation mode through reflection from the F layer. Signals reflected by E or Es layers are recorded during summer periods. At the same time, frequencies of the received signals are sufficiently large, and sometimes there are no reflections from the F layer.
Текст научной статьи Исследование особенностей возвратно-наклонного зондирования ионосферы на базе ЛЧМ-ионозонда
The backscatter ionospheric sounding (BS) method has been adopted for ionospheric research along with vertical and oblique sounding methods. It has been used for predicting conditions of radio wave propagation in radio paths and over-horizon radar systems. As regards the transmitter power, we can distinguish radiotechnical systems of two extreme types, which operate in the backscatter sounding mode. The first type includes systems with a transmitter power exceeding 10 kW; the second type comprises systems with a power less than 1 kW. The quality of BS ionograms depends directly on the transmitter power: the higher is the transmitter power, the greater is the signal-to-noise ratio. This allows us to detect high-resolution scattered signals from long ranges and to improve the quality of ionogram processing and interpretation. However, a high transmitter power increases costs for maintenance of the system. Moreover, a problem arises of electromagnetic compatibility of the sounding system as a whole. To solve the problem of increasing the power potential of stations, while limiting the transmitter power, and to provide high time resolution, radars extensively use chirp signals (Varakin, 1970; Cook, Bernfeld, 1971; Sinnott, 1988; Wise, 2004; Earl, Ward, 1987]. In ionospheric studies, chirp signals are exploited to devise ionosondes operating in vertical, oblique, and backscatter sounding modes [Brynko et al., 1988; Ivanov et al., 2003; Podlesny et al., 2013]. Up-to-date chirp oblique sounding ionosondes detect signals over long paths, including round-the-world ones [Ivanov et al., 1997; Kurkin, 2000; Ivanov et al., 2003]. A new instrument — a chirp ionosonderadio- direction finder — has been developed, which can simultaneously measure the key characteristics of the ionospheric channel (distance-frequency, amplitude-frequency, and angular-frequency characteristics) in the entire frequency range of HF radio signal propagation. This instrument was used in experimental studies of radio wave propagation along paths of various lengths and directions in the natural and artificially disturbed ionosphere. The ionosonderadiodirection finder can be applied to the over-horizon short-wave radar of Earth’s ionosphere on the planetary scale [Valov et al., 2012; Vertogradov et al., 2013; Uryadov et al., 2013]. In the backscatter ionospheric sounding mode, the chirp ionosonde can detect signals scattered by Earth’s surface at large distances from a transmitter under relatively low transmitter powers with the use of a signal frequency compression technology [Philipp et al., 1991; Ilyin et al., 1996; Ivanov et al., 2003]. The multi-year research on BS sounding with the chirp ionosonde, developed at ISTP SB RAS, has revealed that such systems can be applied to diagnosing the propagation medium within the maximum range of one hop (~3000–4000 km) [Altyntseva et al., 1990; Ponomarchuk et al., 2009]. This paper reports results of a study of features of the backscatter ionospheric sounding in northeastern Russia. This study relies on experimental data obtained under various heliogeophysical conditions in 2005–2009. To interpret BS signals on ionograms, we have used results of the modeling of characteristics of chirp signals in the backscatter ionospheric sounding under the waveguide approach with the IRI model [Ponomarchuk et al., 2009; Bilitza, Reinisch, 2008; Ponomarchuk et al., 2014].
EXPERIMENTAND DATA PROCESSING
We analyze experimental BS data acquired with the ISTP SB RAS chirp ionosonde in different seasons in 2005–2009. A transmitter was in the town of Usolye Sibirskoye (52.8° N, 103.3° E); a receiver, in the village of Tory, the Republic of Buryatia (51.8° N, 103° E). The transmitter was a log-periodic antenna array with the azimuth rotary mechanism. The receiver was a BS-2 system of antennas with their pattern maximums directed at 55°, 121°, 235°, and 301° azimuths. The transmitter power was less than 1 kW, therefore we could detect scattered signals largely within the maximum range of one hop (~ 3000–4000 km). The BS studies were mainly carried out during the minimum of solar activity between solar cycles 23 and 24. During the experiments, geomagnetic conditions were quiet.
The secondary processing of ionograms had been made to remove noise components from the image and to extract points with significant amplitude corresponding to arrival times of a signal along the leading edge of the BS signal or to the maximum in the amplitude relief [Grozov et al., 2012; Grozov et al., 2013]. To eliminate noise from the image and to restore signal samples, we employ a median filter capable of smoothing noises, reducing the blurring of track boundaries, and restoring values in track breaks. To separate single artifacts, partially restore data, and identify the primary track on an ionogram, we use a cellular automaton mechanism. Signals extracted on ionograms during secondary processing are interpreted based on the results of modeling of BS signal characteristics. Experimental studies and modeling of propagation characteristics have established that the main contribution to BS signal formation is made by regions of scattering by Earth’s surface located near the boundary of the illuminated zone (transition from the silent zone to the reception zone for oblique sounding signals) for individual hops, [Chernov, 1971; Altyntseva et al., 1990]. The position of the boundary of the illuminated zone is found using the distance-frequency characteristic (DFC) of BS signals along the leading edge because the maximum in the amplitude relief of a BS signal is close in the group path to the leading edge boundary [Dyson, 1991; Ponomar-chuk et al., 2009]. Therefore, BS ionograms can be interpreted by calculating the frequency dependence of the minimum group path Pm(f) corresponding to the closing point of the upper and lower rays for oblique sounding signals. The operating frequency f for the respective range Dm(f) is the maximum usable frequency (MUF) of radiocommunication. For BS DFC on ionograms to be automatically interpreted and restored, a method has been worked out which is based on the adiabatic dependence of the minimum group path of a signal scattered by Earth's surface in the relative frequency grid v=f/fm when ionospheric parameters change [Kurkin et al., 1993; Ponomarchuk et al., 2016]. For predictive ionospheric parameters on the frequency grid, we compute DFC of BS signals along the leading edge. The predictive DFC of BS signal Pm(f) is recalculated into the relative frequency grid v. As the initial frequency fm we take MUF for the maximum signal range. After the secondary processing of the experimental BS ionogram, there is a matrix of experimental points, which corresponds to a two-dimensional array of the group path Pi on the frequency grid fj for points with significant amplitude. The experimental points are also transferred to the relative frequency grid v. The algorithm for automatically identifying propagation modes on BS ionograms involves determining the maximum of the histogram of experimental points falling into the model mask constructed from the long-term forecast, with fm changing at the relative frequency grid v=f/fm. By multiplying v by the computed value of the real fm, the predictive DFC values are transferred to the frequency scale. Thus we restore and identify DFC of BS signals for missing sounding frequencies.
Figure 1 shows a BS ionogram obtained on January 22, 2007 at 06:31 UT. The main trace of a BS signal reflected from the F2 layer is a continuation of the height-frequency characteristic of the second-order mode under quasi-vertical signal propagation from the transmitter to the receiver, beginning from the critical frequency of the F2 layer. On the ionogram, there are multiple signals of quasi-vertical sounding in the frequency range 4–7 MHz. Solid lines in the Figure indicate the results of calculation of DFC of BS signals along the leading edge P m( f ) for one-hop, two-hop, and three-hop propagation modes 1F2, 2F2 and 3F2 respectively. P m( f ) has been simulated under the waveguide approach with the IRI model [Ponomarchuk et al., 2009; Ponomarchuk et al., 2014; Bilitza, Reinisch, 2008]. The P m ( f ) simulation results for 1F2 enables reliable identification of respective BS signals on the ionogram. There are BS signals corresponding to 2F2 and 3F2 on the ionogram, but they have low amplitude, therefore they are not extracted in the secondary data processing. Figure 2 presents the results of the secondary processing and interpretation of the 1F2 mode.
Then, we analyze the experimental data using the simulation results and automatic processing and interpretation of BS ionograms
ANALYSIS OF EXPERIMENTAL DATA
The analysis of the ionospheric sounding results by the BS method for a long time has revealed the most characteristic types of ionograms depending on the time of day, season, direction of sounding, and propagation medium conditions. BS ionograms can conventionally be divided into eight main types [Kabanov, Osetrov, 1965; Chernov, 1971; Altyntseva et al., 1990].
Type 1. Ionograms of the first type feature a small scattering of radio waves reflected by the F layer along the entire path of their propagation, except for scattering by Earth’s surface. Ionospheric conditions characterized by DFC of this type allow for selection and correction of operating frequencies. As a rule, we can obtain qualitative ionograms for distances up to 3000–4000 km.
Figure 3 shows the BS ionogram obtained on November 12, 2009 at 01:40 UT. The central azimuth of sounding and receiving sector corresponds to 55°. Dots
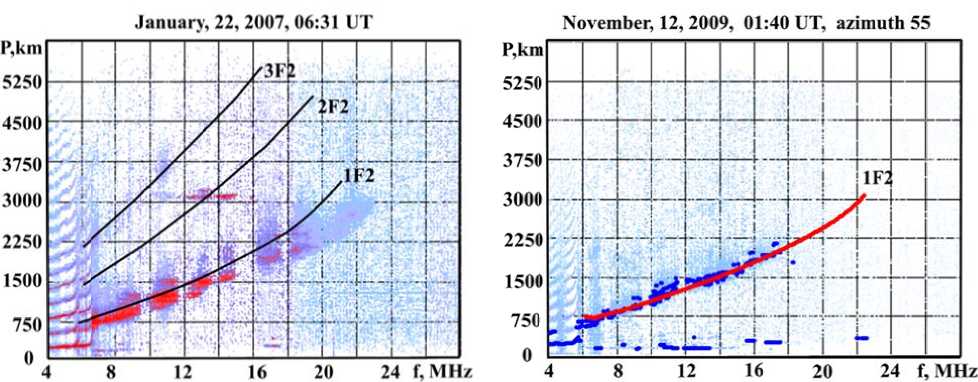
Figure 1. BS ionogram and simulation results P m ( f ) : Jan-
uary 22, 2007, 06:31 UT
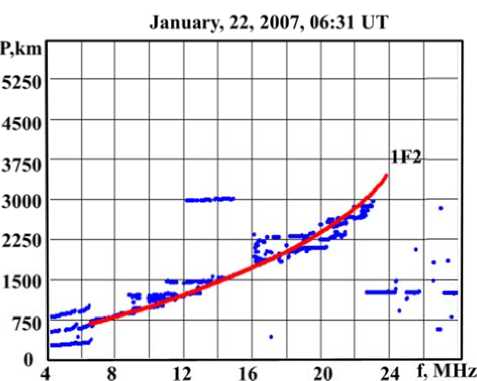
Figure 2 . BS ionogram; processing a nd interpretati o n results: January 22, 2007, 06:31 UT
on the ionogram indicate BS signa l s with signi f icant amplitude, which were found in the s e condary proc e ssing of experi m ental data. The results of i n terpretation o f the 1F2 mode (solid line in Figure 3) i d entify with c onfidence respective BS signals on the i o nogram. Fi g ure 4 presents t h e BS ionogram obtaine d on Februar y 07, 2007 at 0 2 :43 UT. It demonstrates t hat the proc e ssing and interpretation results also cor r ectly identif y the basic BS signal characteristics for 1F2 . Isolatin g BS signal trac k s on the ionogram allo w s us to sele c t and adjust o p erating radiocommunic a tion frequ e ncies [Ponomarchuk et al., 2016].
Type 2. Ionograms of this type o c cur when fre q uencies reflec t ed by the E or E s layers ar e sufficiently high; in this cas e there may be no reflectio n s from the F l ayer.
Ionogr a ms of this type allow u s to judge th e sun lighting o f Earth’s surface at distances not exce e ding 1500–2000 km.
Figure 5 shows the BS ionogram obtained i n the summer of 2005: June 15, 2005, 05:30 UT. The solid line in th e Figure indicates the si m ulation resul t s for DFC of B S signal along the leading e d ge P m ( f ) of t h e 1E mode, acquired at an azimuth of 55°. T here are no r eflections from t he F layer on the BS ionogr a m at the give n
Figure 3. The s a me as in Figu r e 2 for November 12, 2009,
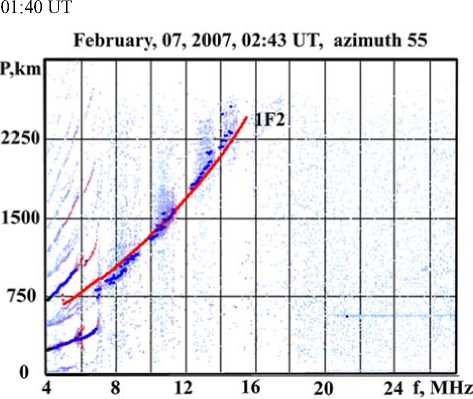
Figure 4. The same as in Figure 2 for February 07, 2007, 02:43 UT time because of the strong absorption of the signal field in the distributed E and Es layers in the sounding sector.The presence of the sporadic Es layer in this period is confirmed by the experimental data of oblique sounding over the Magadan–Tory path, as well as by vertical sounding data. The results of BS signal DFC simulation along the leading edge of the propagation mode 1E differ significantly from the experimental data. This is associated with the error in predicting critical frequencies of the E layer in the IRI model. Figure 6 shows the results of the secondary processing and interpretation of signals corresponding to the propagation mode 1E. Figure 7 exemplifies an experimental BS ionogram for the case when signals scattered by Earth’s surface and reflected from the E and Es layers arrive at the receiving point. The results of data processing and interpretation are presented in Figure 8. Before the operating sounding frequency of 20 MHz, scattered signals are reflected by the E layer; after 20 MHz, by the Es layer.
Type 3. A sig n al arrives at t he receiving point along two-hop or even three-hop tr aj ectories, bei n g reflected by the F layer an d Earth’s surf a ce. Combine d modes can also be involved i n BS signal f ormation. With a certain choice of transmi t ter paramete r s (rate of fre q uency
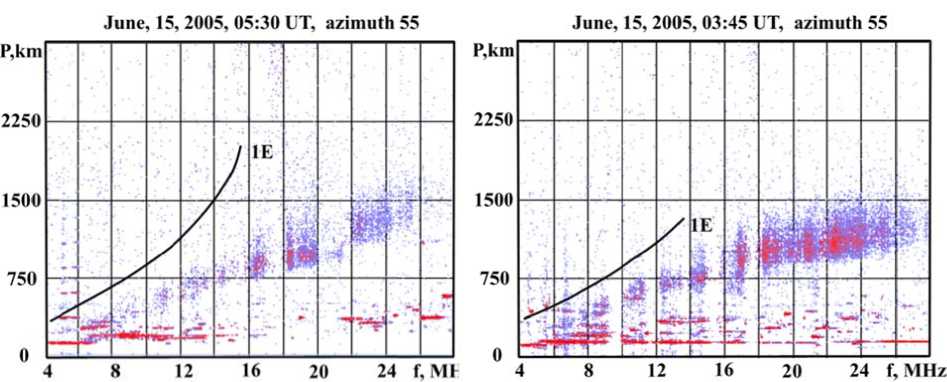
Figure 5 . BS ionogram and simulatio n results P m ( f ): June 15, 2005, 05:30 UT
June, 15, 2005, 05:30 UT, azimuth 55
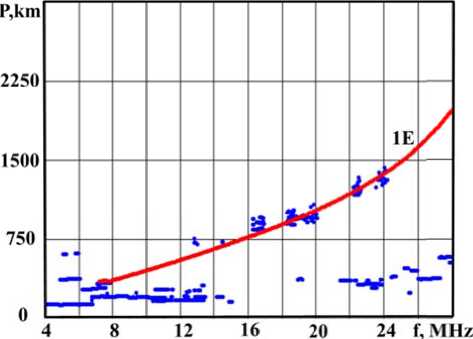
Figure 6 . BS ionogram; processing a nd interpretati o n results: June 15, 2005, 05:30 UT
Figure 7. BS io n ogram and si m ulation result s P m ( f ): June
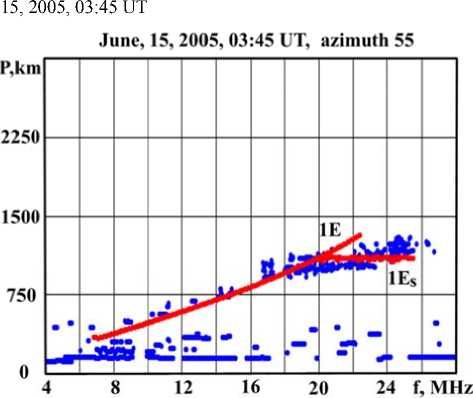
Figure 8. BS i o nogram; proc e ssing and inte r pretation results : June 15, 2005, 03:45 UT
change, transmitter power), DFC of BS signals c a n be formed by scattering areas located at a distance up to 10 000 km [A l tyntseva et al., 1990].
Type 4. This type includes BS ionograms suc h that in additio n to signals coming from t he main rad i ation direction there are signals coming fro m other direc t ions.
Type 5. Ionograms of this type ex h ibit atypical t races of reflections having a weak freque n cy depende n ce of the group p ath, which cannot be int e rpreted as t y pical BS signals. The appearance of such s ignals may b e associated with the reflection from str o ng reflectors such as mountai n ridges or land–sea boundary.
As an i llustration of type 3, 4, an d 5 BS ionog r ams, we present the experimental data acq u ired with the ISTP SB RAS c h irp ionosonde on January 22, 2007. Th e purpose of t h e experiment was to stu d y features o f formation of scattered BS signals coming from dif f erent azimuth directions. The BS signals w ere receive d with the BS-2 a ntenna array, with sequ e ntial switchi n g of azimuths of the main receiving dire c tion every 1 5 min within an hour: 55°, 121°, 235°, and 3 01°. Figures 9–13 show the e xperimental BS ionogram s and the res u lts of simulation of BS DFC along the lead i ng edge P m ( f ) . The ionogram obtained for the 05:01 UT sounding sess i on
(Figure 9) is a ty p e 4 BS iono g ram such tha t in addition to signals coming from the mai n radiation di r ection there are s ignals comin g from other directions. T h e results of the BS DFC sim u lation for th e propagatio n mode 1F2 with the IRI mo d el, which w e re obtained for the 55° azi m uth, are pres e nted in Figu r e 9 (solid lin e ). This Figure also shows t h e results o f the simulati o n of P m( f ) (dashed line) obt a ined for the 2 35° azimuth opposite to the m ain receivin g direction o f the BS-2 antenna array. The comparison b etween the si mulation results and the experimental dat a leads to the conclusion t h at the separation of BS sig n al DFC for th is session i s due to the detection of the s c attered sign al s by the bac k directional lobe of the recei v ing antenna. T he slope of DFC of BS sign a ls coming from the north direction is g reater than that of DFC of si g nals coming f rom the sout h direction.
The effect of separation o f the BS signal DFC is mor e pronounce d during the transient h o urs of day alon g the sounding direction a n d becomes s t ronger with incr e asing transm i tter power [ A ltyntseva et a l., 1990]. A similar, less pronounced, sepa r ation of BS DFC is observ e d for the 05 : 46 UT sessi o n in the sou n ding sector with an azimuth of 301°. Figur e 12 shows th e BS
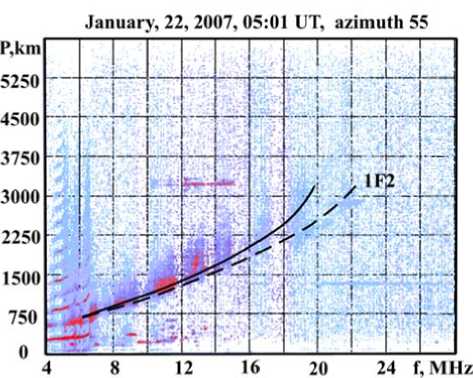
Figure 9. BS ionogram and simulation results P m ( f ) : January 22, 2007, 05:01 UT
January, 22, 2007,05:16 UT, azimuth 121
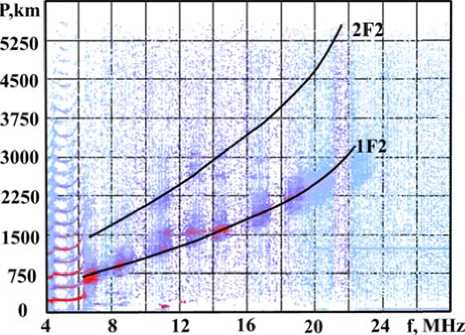
Figure 10. The same as in Figure 9 fo r 05:16 UT
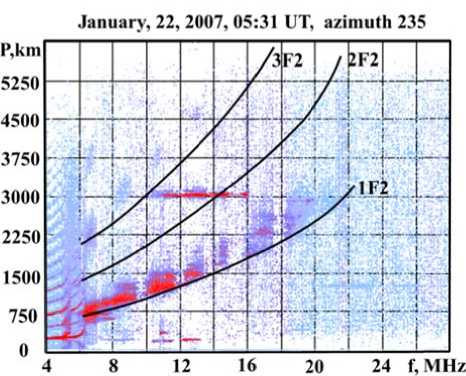
Figure 11. The same as in Figure 9 for 05:31 UT ionogram obtained on January 22, 2007 at 05:46 UT, and the results of BS DFC simulation along the leading edge. Solid lines are the results of the Pm(f) simulation in the BS sector with an azimuth of 301°; dashed lines, with an azimuth of 121°.
In this c ase, the BS signal has hig h er amplitude and a wider frequency interval than the direct signal.
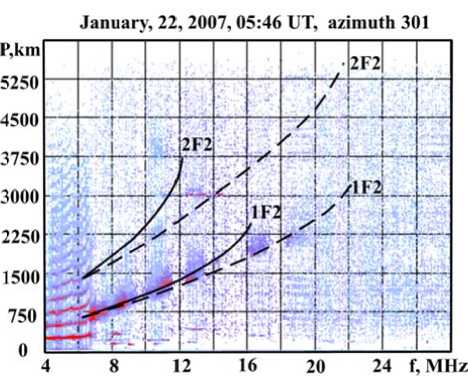
Figure 12. The s ame as in Fig u re 9 for 05:46 U T
In addition to the BS sig n als correspo n ding to the 1F2 mode, the io n ograms sho w n in Figure 10–12 have sign a ls arriving a t the receiv i ng point alo n g two-hop and even three-h o p trajectorie s through ref l ection from the F layer and E arth’s surfac e . Therefore, these ionograms fall into t y pe 3 too. Th e two-hop a n d three-hop BS s ignals are w ell identifie d from the results of BS DFC simulation based on the n ormal-wave m ethod with the use of the IR I model, wit h out adapting ionospheric para m eters.
The BS ionog r am shown i n Figures 9 and 11 can also be assigned t o the type of ionograms w ith atypical traces of reflecti o ns having a w eak freque n cy dependenc e of the grou p path, which cannot be i n terpreted as typi c al BS signals. The appea r ance of suc h signals on the ionograms fo r sounding se s sions at 05:01 and 05:31 UT may be related to the r e flection fro m mountain ridg e s in the sout h of Central A sia – the Pa m ir mountain syst e m located at a distance of ~ 3000 km fr o m the transmission point in th e direction wi t h an azimuth o f 235°.
Type 6. The r a dio wave pr o pagation co n ditions vary con s iderably alon g the soundin g direction, th u s hindering sele c tion of oper a ting frequen c ies. Figure 1 3 shows the BS i onogram obt a ined in the s u mmer of 20 0 5: June 15, 2005, 13:15 UT. T he solid line i ndicates the r esults of the BS DFC simulati o n in the lead i ng edge P m ( f ) of the 1F2 mode for the sou n ding directio n with an azi m uth of 55°; the d ashed line, f o r the reverse d irection wit h an azimuth of 235°. Reflectio n s from the F layer on the B S ionogram at the given time a re present u p to 14 MHz f or the direct sign a l and up to 1 8 MHz for t h e reverse sig n al. For freque n cies over 18 M Hz there ar e no signals c o rresponding to t h e 1F2 mode on the ionogra m , as evidenc e d by the results of the BS D F C simulatio n in the leadi n g edge with the IRI model. Th e presence of t he sporadic E s layer in the sounding sector a l lows us to d e tect BS signals reflected fro m the E s layer. Figure 14 sh o ws the result s of the second a ry processing and interpret a tion of BS s i gnals corresponding to the pr o pagation mo d es 1F2 and 1 E s . The solid line indicates the results of in t erpretation o f BS signals arriving at the receiving point f rom the 55° a zimuth; the dashed line, the results of inter pr etation of si g nals coming fro m the reverse d i rection with t h e 235° azimu t h.
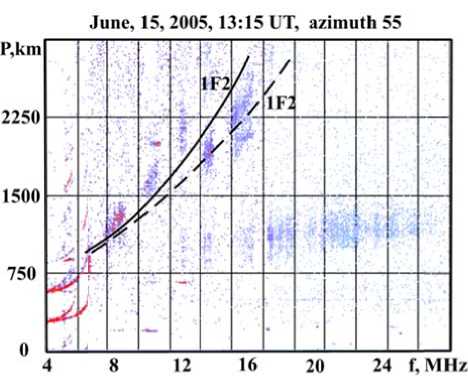
Figure 1 3. BS ionogram and simul a tion results P m ( f ) : June 15, 2005, 13:15 UT
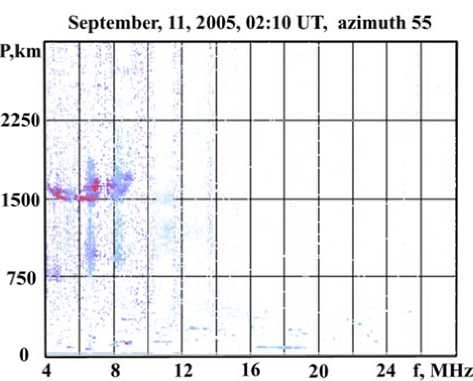
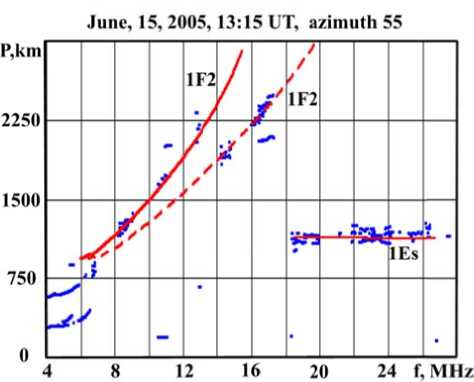
Figure 1 4. BS ionogram; processing a nd interpretat i on results: June 15, 2005, 13:15 UT
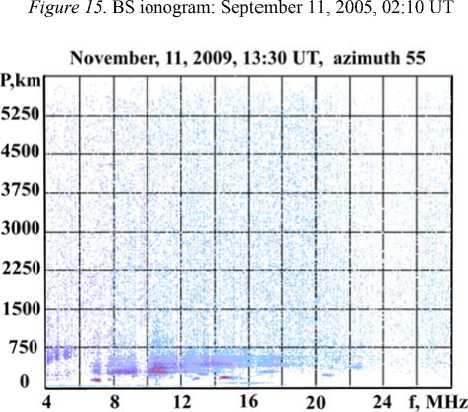
Figure 16. BS i o nogram: Nov e mber 11, 2009, 13:30 UT
CONCLUSION
Type 7. In the ionosphere there ar e no conditio n s for regular si g nal reflection and there a r e considera b le irregularities. On ionograms there are o nly backscat t ering signals fr o m ionospheric irregularities. This gen e rally occurs during strong ionospheric disturbances. Fig u re 15 presents t h e BS ionogram obtained on Septemb e r 11, 2005 at 02:10 UT during the strong magnetic sto r m of September 11–16, 2005. Ionograms o f this type f e ature disturbanc e s of the radio wave propagation m e dium during ge o magnetic storms. BS data cannot be u s ed to forecast ra d iocommunication conditi o ns.
Type 8. Type 8 ionograms featur e signals for w hich boundaries of reflections are indepe n dent of the s o unding frequ e ncy and are approximately equal t o 100 km.Simila r reflected signals are detected in the cas e of a complete screening of the upper ionospheric lay e rs by the E s lay e r. A sign of ionograms o f this type i s the presence o f signals coming from ran g es of one hu n dred to several h undred kilometers. As an e xample, Fig u re 16 shows the BS ionogram received on N ovember 11, 2009 at 13:30 UT. Ionograms of this type a lso preclude u sing sounding data to control radiocommunications.
The accumulated dataset enables us to examine features of BS signal propagation under various heliogeo- physical conditions. We have identified the most characteristic types of ionograms and have determined conditions for a particular type depending on the time ofday, season, direction of sounding, and propagation medium conditions. In winter, spring, and autumn, the prevailing types of ionograms are those with BS signals corresponding to the one-hop mode of propagation through reflection from the F layer. Ionospheric conditions characterized by ionograms of this type create the most favorable conditions for selecting and adjusting operating oblique sounding frequencies. It is generally possible to obtain qualitative ionograms for distances up to 3000– 4000 km. During transient hours of day, along with the main signals there are signals arriving from directions opposite to the sounding azimuth. In summer, there are signals reflected by E or Es layers. At the same time, frequencies of received signals are high enough, and there may be cases in which there are no reflections from the F layer. Ionograms of this type allow us to judge the sun lighting of Earth’s surface at distances not exceeding 1500–2000 km. We have also obtained iono- grams with atypical reflection tracks having a weak frequency dependence of the group path, which cannot be interpreted as typical BS signals.
The work was supported by Program for Fundamental Research of the Russian Academies of Sciences No. II.12.2.2 and by RFBR grant No. 16-32-00788. Experimental data have been acquired with the chirp ionosonde of ISTP SB RAS.
Список литературы Исследование особенностей возвратно-наклонного зондирования ионосферы на базе ЛЧМ-ионозонда
- Алтынцева В.Н., Брынько И.Г., Галкин И.А. и др. Возвратно-наклонное зондирование ионосферы сигналом с линейной частотной модуляцией//Исследования по геомагнетизму, аэрономии и физике Солнца. М.: Наука, 1990. Вып. 92. С. 106.
- Валов В.А., Вертоградов Г.Г., Вертоградов В.Г. и др. ЛЧМ-ионозонд-радиопеленгатор и его применение в ионосферных исследованиях//Физические основы приборостроения. 2012. Т. 1, № 4(5). С. 24-43.
- Варакин Л.Е. Теория сложных сигналов. М.: Сов. радио, 1970. 376 с.
- Вертоградов Г.Г., Урядов В.П., Вертоградов В.Г. и др. Ионозонд-радиопеленгатор с линейной частотной модуляцией сигнала -новый инструмент для исследования ионосферы и распространения радиоволн//Известия вузов. Радиофизика. 2013. Т. 56, № 5. С. 287-306.
- Грозов В.П., Киселев А.М., Котович Г.В. и др. Программное обеспечение обработки и интерпретации ионограмм зондирования на базе цифрового ЛЧМ-ионозонда//Гелиогеофизические исследования. 2013. Вып. 4. С. 75-85.
- Иванов В.А., Куркин В.И., Носов В.Е. и др. ЛЧМ-ионозонд и его применение в ионосферных исследованиях//Известия вузов. Радиофизика. 2003. Т. 46, № 11. С. 919-952.
- Кабанов Н.И., Осетров Б.И. Возвратно-наклонное зондирование ионосферы. М.: Советское радио, 1965. 112 с.
- Кук Ч., Бернфельд М. Радиолокационные сигналы. Теория и применение. М.: Советское радио, 1971. 567 с.
- Куркин В.И., Носов В.Е., Пономарчук С.Н. и др. Метод оперативной диагностики КВ-радиоканала//Исследования по геомагнетизму, аэрономии и физике Солнца. Новосибирск, 1993. Вып. 100. С. 168-188.
- Куркин В.И., Носов В.Е., Матюшонок С.М. и др. Особенности распространения кругосветных сигналов на трассах российской сети ЛЧМ-ионозондов в годы низкой и средней солнечной активности//Изв. вузов. Радиофизика. 2000. Т. 43, № 10. С. 843-854.
- Подлесный А.В., Брынько И.Г., Куркин В.И. и др. Многофункциональный ЛЧМ-ионозонд для мониторинга ионосферы//Гелиогеофизические исследования. 2013. Вып. 4. С. 24-31.
- Пономарчук С.Н., Ильин Н.В., Пензин М.С. Модель распространения радиоволн в диапазоне частот 1-10 МГц на основе метода нормальных волн//Солнечно-земная физика. 2014. Вып. 25. С. 33-39.
- Урядов В.П., Вертоградов Г.Г., Вертоградова Е.Г. Радарные наблюдения F-рассеяния в среднеширотной ионосфере с помощью ионозонда-радиопеленгатора//Известия вузов. Радиофизика. 2013. Т. 56, № 1. С. 1-11.
- Филипп Н.Д., Блаунштейн Н.Ш., Ерухимов Л.М. и др. Современные методы исследования динамических процессов в ионосфере. Кишинев: Штиинца, 1991. 288 с.
- Чернов Ю.А. Возвратно-наклонное зондирование ионосферы. М.: Связь, 1971. 204 с.
- Bilitza D., Reinisch B.W. International Reference Ionosphere 2007: improvements and new parameters//Adv. Space Res. 2008. V. 42. P. 599-609.
- Brynko I.G., Galkin I.A., Grosov V.P., et al. An automatically controlled data gathering and processing system using an FMCW ionosonde//Adv. Space Res. 1988. V. 8, N 4. P. 121-124.
- Dyson P.L. A simple method of backscatter ionogram analysis//J. Atmos. Terr. Phys. 1991. V. 53, N 1. P. 75-88.
- Earl G.F., Ward B.D. The frequency management system of the Jindalee over-the-horizon backscatter HF radar//Radio Sci. 1987. V. 22, N 2. P. 275-291.
- Grozov V.P., Ilyin N.V., Kotovich G.V., Ponomarchuk S.N. Software system for automatic interpretation of ionosphere sounding data//Pattern Recognition and Image Analysis. 2012. V. 22, N 3. P. 458-463.
- Ilyin N.V., Khakhinov V.V., Kurkin V.I., et al. The theory of chirp-signal ionospheric sounding//Proc. ISAP’96. Chiba, Japan, 1996. P. 689-692.
- Ivanov V. A., Ryabova N.A., Shumaev V.V., Uryadov V.P. Forecasting and updating HF channel parameters on the basis of oblique chirp sounding//Radio Sci. 1997. V. 32, N 3. P. 983-988.
- Ponomarchuk S.N., Kurkin V.I., Oinats A.V. The diagnostics of ionosphere and earth ground surface by backscatter sounding data//PIERS 2009 Moscow Proc. 2009. P. 1307-1310.
- Ponomarchuk S.N., Grozov V.P., Kotovich G.V., et al. Automatic processing and interpretation of backscatter ionosphere sounding ionograms//Proc. SPIE. 2016. V. 10035, 100351E DOI: 10.1117/12.2248765
- Sinnott D.H. The Development of Over-the-Horizon Radar in Australia. Defence Science & Technology Organisation, 1988. 39 p.
- Wise J.C. Summary of recent australian radar developments//IEEE Aerospace and Electronic Systems Magazine. 2004. P. 8-10.
