Issues of improving inter-budget relations between the region and the federal centre

Author: Pechenskaya Mariya Aleksandrovna
Journal: Economic and Social Changes: Facts, Trends, Forecast @volnc-esc-en
Section: Public finance
Article in issue: 6 (24) т.5, 2012.
Free access
The article studies the problems of inter-budgetary relations of the subjects of federation and the federal centre. The analysis of financial interaction between the regions of the North-Western Federal District and the federal centre has been carried out on the basis of general scientific methods. The article identifies the positive and negative sides of the development of inter-budget interaction between these regions and directions of its improvement. The results obtained can be used by the federal and regional state power bodies when forming the budget policy in the sphere of inter-budget relations.
Federal budget, regional budget, inter-budget relations, budgets' own revenues, transfers, delegated expenses
Short address: https://sciup.org/147223407
IDR: 147223407 | UDC: 336.14(470.2)
Text of the scientific article Issues of improving inter-budget relations between the region and the federal centre
* Calculated on the basis of the accounting report on the execution of budgets of the RF subjects and local budgets. Available at:
Table 5. The ratio of revenues transferred to the federal budget by the NWFD regions to the volume of inter-budget transfers and loans received by them from the federal budget (2006 – 2011)*
|
NWFD Subject |
Transferred to the federal budget, billion rub. |
Received from the federal budget, billion rub. |
Ratio of the finances allocated to the finances received, fold |
|
Republic of Karelia |
7.8 |
42.5 |
0.18 |
|
Republic of Komi |
244.7 |
36.5 |
6.70 |
|
Arkhangelsk Oblast |
25.4 |
100.9 |
0.25 |
|
Vologda Oblast |
47.5 |
46.8 |
1.01 |
|
Kaliningrad Oblast |
113 |
77.5 |
1.46 |
|
Leningrad Oblast |
180.9 |
45 |
4.02 |
|
Murmansk Oblast |
36.8 |
64.9 |
0.57 |
|
Novgorod Oblast |
15.3 |
32.2 |
0.48 |
|
Pskov Oblast |
9.5 |
44.2 |
0.21 |
|
Saint Petersburg |
586.5 |
161.1 |
3.64 |
|
* Calculated on the basis of the RF Treasury accounting report on the execution of budgets of the RF subjects and local budgets. and also on the basis of the Rosstat data. |
|||
Currently, the RF subjects have transferred 4659 federal powers 4 , including branch-wise powers. Organizing the efficient implementation of such a volume of powers appears to be quite a challenge.
Moreover, according to the Treasury of the Russian Federation, up to 2.7% of the expenditures transferred to the regional level were not financed in 2006 – 2011. Therefore, the regional budgets are to find their own means to cover the remaining costs (about 30 million rubles).
In order to show the imbalances of the financial flows between the federal budget and the budgets of the NWFD regions more clearly, we shall demonstrate the ratio of the amount of financial transfers to the regions to the amount of financing withdrawn from the regions. During the period under review, more revenues were flown into the federal budget from such regions as the Republic of Komi, the Vologda, Kaliningrad, Leningrad, Murmansk oblasts and Saint Petersburg, than was returned in the form of financial assistance and budget loans (tab. 5) .
It is necessary to note that some of the regions in the district did not receive financial aid from the federal budget in the form of subsidies. Donor regions in 2006 and 2007 included St. Petersburg, the Leningrad and Vologda Oblasts, the Republic of Komi. The latter lost the status of an unsubsidized region in 2008 – 2010, and the Vologda Oblast – in 2011. The Pskov Oblast headed the list of subsidized regions in the North-West during the whole analyzed period: transfers aimed at the alignment of its fiscal capacity amounted up to one third of the consolidated budget’s own revenues. Besides the Pskov Oblast, the top three of the NWFD subjects that mostly depend on the named type of financial support by the end of 2011 included the Arkhangelsk Oblast (12.5%) and the Republic of Karelia (10.2%). The level of subsidies for the North-Western regions amounted to an average of 2.8%, while for the country in general – 6.8% (tab. 6) .
The lowest share of federal financial support is registered in Saint Petersburg and the Leningrad Oblast – less than 10% of the total volume of revenues. Meanwhile, the interbudget transfers in the Arkhangelsk, Kaliningrad and Pskov Oblasts formed up to 40% of the consolidated budgets’ revenues.
Table 6. The volume of subsidies on the equalization of the fiscal capacity of the NWFD regions*
|
NWFD Subject |
2006 |
2008 |
2011 |
|||
|
Million rub. |
In % to the own revenues |
Million rub. |
In % to the own revenues |
Million rub. |
In % to the own revenues |
|
|
Pskov Oblast |
2435.9 |
32.5 |
3540.5 |
30.8 |
4139.3 |
25.4 |
|
Arkhangelsk Oblast |
2591.7 |
13.0 |
4705.7 |
13.1 |
5466.5 |
12.5 |
|
Republic of Karelia |
1116.1 |
9.6 |
1533.7 |
8.6 |
2765.2 |
10.2 |
|
Novgorod Oblast |
847.2 |
9.0 |
847.2 |
5.2 |
768.0 |
3.6 |
|
Murmansk Oblast |
1045.9 |
4.6 |
1229.9 |
3.6 |
1599.4 |
3.3 |
|
Republic of Komi |
0 |
0.0 |
314.6 |
0.8 |
1473.7 |
2.9 |
|
Vologda Oblast |
0 |
0.0 |
0 |
0.0 |
737.9 |
1.7 |
|
Kaliningrad Oblast |
783.3 |
5.0 |
1075.0 |
4.4 |
498.0 |
1.6 |
|
Leningrad Oblast |
0 |
0.0 |
0 |
0.0 |
0 |
0.0 |
|
Saint Petersburg |
0 |
0.0 |
0 |
0.0 |
0 |
0.0 |
|
NWFD |
8820.1 |
2.4 |
14620.5 |
2.6 |
18805.6 |
2.8 |
|
RF. billion rub. |
228.9 |
7.3 |
330.0 |
6.7 |
398.4 |
6.8 |
* Calculated on the basis of the accounting report on the execution of budgets of the RF subjects and local budgets. Available at:
In this connection, the solvency of the regions is to a certain extent conditioned by the transfers, as the sources of the regional budgets’ revenues. Therefore, the issue of the timeliness of their transfer is particularly important. Intergovernmental transfers are provided to the regional budgets unevenly, which, taking into account the price factor, creates the risks of inefficient use of the budget funds. The main reasons for such a situation include organizational flaws, caused first of all by the fact that the competitive procedures for the allocation of transfers are carried out in the second half of the year, besides, the circulation of documents is long, the contracts on the performance of works (rendering of services) are not concluded on time, the suppliers don’t comply with the terms of delivery of equipment and materials. All this leads to the fact that a significant share of the annual federal transfers is allocated to the regions in the 4th quarter of the year (tab.7) .
The system of inter-budget relations should be aimed chiefly on the increase in the supply of public goods at the sub-national level. Therefore, it is important to determine the dynamics of budgetary sufficiency with per capita incomes. In 2006, the NWFD top five regions by the absolute value of the average per capita income included Saint Petersburg, the Republic of Komi, the Murmansk, Vologda and Leningrad oblasts. In 2009, the Vologda Oblast was only the last but one in this rating. By the end of 2011, the highest growth rates were registered in the Kaliningrad, Pskov and Novgorod oblasts (tab. 8).
It is impossible to satisfy the population’s demand for budget services to the fullest without the transfer to the territorial level of the resources, sufficient for the realization of spending powers. In this context, the indicator of the coverage of expenditures with own revenues that allows evaluating the budget’s ability to realize the spending powers at the expense of its own tax and non-tax revenues becomes very important. Judging by the end of 2011, the Leningrad and Murmansk Oblasts, Saint Petersburg and the Republic of Komi possess the highest indicators in the NWFD, the Arkhangelsk, Kaliningrad and Pskov Oblasts have the lowest ones (figure) .
Table 7. The share of inter-budget transfers allocated in the 4th quarter, in % to the annual transfers*
NWFD Subject 2006 2007 2008 2009 2010 2011 Republic of Karelia 30.0 42.0 37.1 21.3 26.5 23.9 Republic of Komi 31.0 33.6 24.0 26.9 17.8 22.7 Murmansk Oblast 30.6 46.1 37.6 32.7 37.6 26.4 Arkhangelsk Oblast 32.6 39.4 33.7 26.9 27.5 26.8 Novgorod Oblast 23.7 28.9 31.8 26.3 18.6 27.5 Leningrad Oblast 43.1 46.7 47.3 25.7 20.9 27.6 Vologda Oblast 23.6 30.4 30.0 23.3 24.3 27.7 Pskov Oblast 23.8 24.9 19.5 17.9 17.1 33.9 Kaliningrad Oblast 46.2 48.6 45.7 13.9 27.5 41.4 Saint Petersburg 38.5 38.1 43.8 21.0 20.0 16.8 * Calculated on the basis of the accounting report on the execution of budgets of the RF subjects and local budgets. Available at:
Table 8. The per capita budget sufficiency with the incomes of the NWFD regions*
|
NWFD Subject |
2006 |
2009 |
2011 |
|||
|
Thousand rub. |
In % to the previous year |
Thousand rub. |
In % to the previous year |
Thousand rub. |
In % to the previous year |
|
|
Kaliningrad Oblast |
22.2 |
137.7 |
44.8 |
112.8 |
51.6 |
126.2 |
|
Pskov Oblast |
15.6 |
124.0 |
28.8 |
110.8 |
41.5 |
124.2 |
|
Novgorod Oblast |
18.3 |
109.4 |
36.9 |
109.5 |
44.5 |
122.2 |
|
Republic of Komi |
30.8 |
124.0 |
47.7 |
104.1 |
64.6 |
117.4 |
|
Saint Petersburg |
47.8 |
153.0 |
69.5 |
92.8 |
83.3 |
115.1 |
|
Leningrad Oblast |
22.6 |
132.3 |
38.3 |
98.5 |
48.0 |
115.1 |
|
Republic of Karelia |
21.9 |
110.5 |
37.6 |
95.7 |
55.8 |
112.9 |
|
Vologda Oblast |
26.5 |
124.9 |
32.9 |
79.3 |
42.2 |
110.9 |
|
Murmansk Oblast |
34.0 |
171.0 |
55.4 |
99.1 |
71.2 |
108.9 |
|
Arkhangelsk Oblast |
21.5 |
123.3 |
39.3 |
96.3 |
51.3 |
103.3 |
|
NWFD |
32.6 |
141.1 |
50.9 |
96.0 |
67.3 |
120.6 |
* Calculated on the basis of the RF Treasury accounting report on the execution of budgets of the RF subjects and local budgets. and also on the basis of the Rosstat data
Thus, the analysis of the formation of interbudget relations between the NWFD regions and the federal centre reveals the positive and negative sides of this system.
The positive factors include the big (over 77%) share of own tax and non-tax revenues in the total revenues of the budgets of the NWFD regions and, as a consequence, their relatively low dependence on financial assistance. For instance, in 2006 – 2011 only about 2 – 4 regions out of 10 received subsidies on the equalization of budget sufficiency, and their share in the budgets’ own revenues was below 4%.
At the same time, the increase in the efficiency of the financial cooperation between the North-Western territories and the federation is hampered by the strong inter-regional differentiation according to the level of per capita fiscal capacity of incomes (from 41.5 thousand rubles in the Pskov Oblast to 83.3 thousand rubles in Saint Petersburg in 2011).
The coverage of current and capital expenditures with own revenues of the consolidated budgets of the NWFD regions, %*
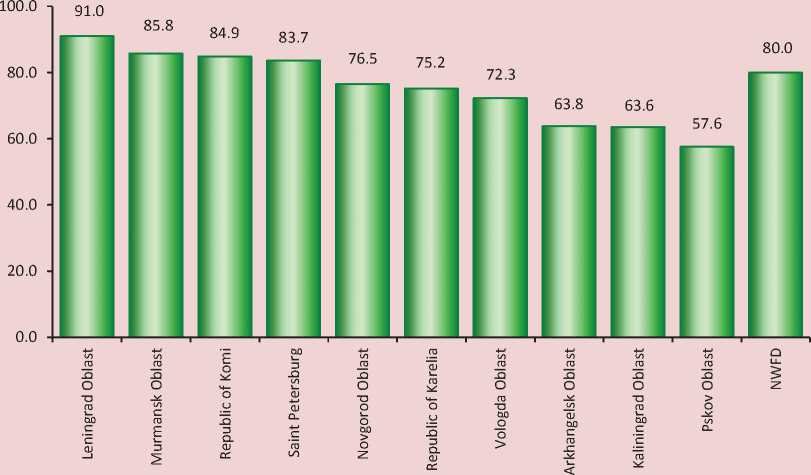
* Calculated on the basis of the RF Treasury accounting report on the execution of budgets of the RF subjects and local budgets, and also on the basis of the Rosstat data.
The limiting factor is the recent years’ increase of the budget deficit in the NWFD subjects: its amount in the Republic of Karelia, the Arkhangelsk, Vologda and Novgorod oblasts exceeds 15% of the volume of the own revenues 5 (tab. 9) .
It should be noted that the reform of interbudget relations still hasn’t solved the problems hindering the implementation of such fundamental principles of fiscal federalism, as the independence of budgets, the compliance of the assigned expenditure commitments with revenue powers, as well as the uniformity of budget sufficiency of different territories. Particular importance is attached to the problem of optimizing tax and non-tax inflows in the budgets of different levels.
The distribution of taxes should guarantee constitutional autonomy to the regions, simultaneously enhancing the authorities’ responsibility for carrying out the active economic and financial policy. As the experience of developed states proves, under a stable market economy, the tax distribution of budget revenues virtually allows the formation of sustainably independent budgets taking into account the financial capacities and requirements of the territory.
For all the complexity of the situation, in the conditions of fiscal risks, it should be recognized that the sphere of improving inter-budgetary interaction between regions and the federation has actual reserves:
-
1. The expansion of the regional authorities’ powers on the management of their revenue base that will promote the implementation of initiatives and will become the first step toward the decentralization and strengthening of the
-
2. A clear distinction of spending powers between the federal and regional authorities in accordance with their revenue sources .
-
3. The adoption of measures in the sphere of tax policy, directly or indirectly promoting the attraction of additional revenues in the regional budget:
Table 9. The amount of the consolidated budgets’ deficit in the NWFD regions * (in % to the own revenues)
|
NWFD Subject |
2006 |
2007 |
2008 |
2009 |
2010 |
2011 |
|
Murmansk Oblast |
0.0 |
0.0 |
0.9 |
7.7 |
0.0 |
0.0 |
|
Leningrad Oblast |
0.0 |
0.0 |
0.0 |
8.6 |
0.0 |
0.0 |
|
Novgorod Oblast |
0.0 |
0.0 |
6.7 |
10.3 |
20.3 |
0.0 |
|
Kaliningrad Oblast |
0.0 |
0.0 |
1.0 |
0.0 |
11.2 |
0.1 |
|
Republic of Karelia |
9.1 |
6.9 |
2.0 |
20.1 |
2.2 |
0.6 |
|
Saint Petersburg |
0.0 |
0.0 |
5.7 |
2.6 |
4.1 |
1.1 |
|
Republic of Komi |
0.0 |
0.0 |
1.1 |
3.0 |
2.4 |
2.5 |
|
Pskov Oblast |
0.0 |
0.0 |
0.0 |
6.5 |
5.3 |
2.8 |
|
Arkhangelsk Oblast |
0.0 |
0.0 |
12.1 |
21.7 |
15.1 |
12.8 |
|
Vologda Oblast |
0.0 |
0.1 |
0.0 |
23.1 |
18.7 |
18.1 |
|
NWFD |
0.0 |
0.0 |
3.7 |
6.2 |
3.5 |
1.9 |
* Calculated on the basis of the RF Treasury accounting report on the execution of budgets of the RF subjects and local budgets, and also on the basis of the Rosstat data political system. Thus, providing the authorities of the subjects of the federation with the rights of the regional taxes management will contribute to the improvement of their collection and strengthening the budget’s revenue base.
-
✓ transfer of additional tax sources to the regional level;
-
✓ introduction of a progressive taxation scale for individual income tax and sumptuary tax;
-
✓ simplification of tax reporting, etc.
-
4. Optimization of preferential treatment policy , which consists in the abolition of inefficient federal tax concessions and development of a mechanism compensating the loss of revenues that the regional budgets suffer due to the provision of benefits under the federal law.
-
5. An inventory of the remaining unfunded mandates and their provision with funding sources. We believe that this requires a more clear definition of the goals and directions of
-
6. Improvement of the transfer mechanism , consisting in the transition from the target-oriented transfers to modular transfers 6 .
-
7. Improvement of the policy of regions’ stimulation:
subventions and methods of determining their amount. All this gives the opportunity to restrict on a legal basis the amount of government powers transferred to the regional level.
-
✓ by expanding the list of the recipients of incentive grants for the progress achieved in improving the quality of budget management;
-
✓ by encouraging the regions to create and implement innovation projects.
No doubt that the implementation of all the proposals stated above could to a certain extent mitigate the negative consequences of the existing threats to the system of inter-budget relations between the regions. In this regard, the legal framework should be established at the federal level, maximum efforts should be undertaken at the regional level to increase the budget’s revenues and optimize the expenses in order to enhance the financial stability of the territories.
References Issues of improving inter-budget relations between the region and the federal centre
- Budget Code of the Russian Federation. Moscow: KnoRus, 2012.
- Valentey S.D. Economics of federative relations and regional policy. Spatial economics. 2009. No. 4. P. 7-22.
- De Silva M., Kurlyandskaya G.V. Development of fiscal federalism: international experience and Russian practice. M: Ves mir, 2006.
- Konkov A.Ye. Centre-periphery relations in the Russian Federation in the conditions of the administrative reform. Author’s published summary of Ph.D. in Political science thesis: 23.00.02. Available at: http://e-journal.spa.msu.ru/images/File/avtorefKonkov.pdf
- Accounting report on the execution of budgets of the RF subjects and local budgets. Available at: http://www.roskazna.ru/reports/mb.html
- Report on the calculation and the inflow of taxes, levies and other obligatory payments to the budget system of the Russian Federation No. 1-NM of the Federal tax service. Available at: http://nalog.ru/nal_statistik/forms_stat/
- Panov R.Yu. Speech at the all-Russian conference “Regional Russia: efficient redistribution of powers between different levels of state authority”. Available at: http://www.upcoo.ru/175/627
- Pechenskaya M.A. Assessment of the region’s fiscal capacity. Young scientists -to economics: the collection of works of youth scientific school. Vologda, 2012. Vol. 12. P. 79-111.
- Povarova A.I. Regional budget of 2012 -2014: stability is delayed. Economic and social changes: facts, trends, forecast. 2012. No. 3 (21). P. 43-63.
- Tatarkin A.I., Grebenkin A.V., Tatynov S.I. Distortion of the fiscal and regulatory functions of taxes in the Russian economy and its impact on regional budgets. Financial analytics: problems and solutions. 2011. No. 20 (62). P. 2-11.
- Uskova T.V., Povarova A.I., Orlova V.S. Public finances of the regions: modernization priorities. Supervised by T.V. Uskova, Ph.D. in Economics. Vologda: ISEDT RAS, 2010.
