IT innovation and firm’s sustainable performance: the intermediary role of organizational agility – an empirical study

Author: Mohamed Amine Marhraoui, Abdellah El Manouar
Journal: International Journal of Information Engineering and Electronic Business @ijieeb
Article in issue: 3 vol.10, 2018.
Free access
Both small and large companies are facing tough competition in today’s rapidly changing environment. They should be able to adapt continuously to these changes and to exploit them as opportunities of development. Firms should then innovate in order to gain sustainable advantage, by proposing adequate products and services allowing them to increase market shares and sustain their growth. Disruptive technologies are thus adopted in order to conceive innovative products, to develop a new use of existing products/services or to optimize processes. In this article, we describe our theoretical framework and its main constructs. It presents the direct effect of information technology innovation on economic, social and environmental performance. Moreover, our proposed framework focuses on the intermediary role of organizational agility. In addition, the main findings of our quantitative study based on the analysis of survey data from 103 participants are highlighted. After verifying the validity and reliability of our questionnaire results, the framework’s hypotheses are tested using partial least squares path modeling method.
IT innovation, organizational agility, economic performance, social performance, environmental performance
Short address: https://sciup.org/15016129
IDR: 15016129 | DOI: 10.5815/ijieeb.2018.03.01
Text of the scientific article IT innovation and firm’s sustainable performance: the intermediary role of organizational agility – an empirical study
Published Online May 2018 in MECS
The pace of change has increased rapidly in today’s environment. New regulations have been put in place for compliance and security issues. Markets are globalized and low cost firms/countries increase competition allowing them to take a significant market share in traditional markets like automobile industry and textile.
Innovation is not a choice for companies. It is an obligation in order to survive for competition. Firms which don’t propose new products/services, creative customer experience or innovative solutions cannot compete in a globalized market. Companies should embrace innovation and particularly adopt up-to-date technologies in order to propose added-value products for their commercial development, to improve their processes for higher internal efficiency and to respect social and ecological environment.
These latter are among the most important concerns of current companies which are devoted to sustain their development. They are more concerned about the needs of all stakeholders by aiming economic growth while preserving environment and promoting social development. Sustainability is then embedded in firm’s strategy and specific resources are allocated as to achieve one or some of the sustainable development goals (SDG).
As listed by the United Nations, there are 17 SDGs which propose to companies a framework for segmenting and prioritizing sustainable goals like eradicating poverty and inequalities in order to preserve or enhance profits [1].
In this paper, we focus on the impact of information technology (IT) innovation on firm’s sustainable performance. We conduct an empirical study based on a survey in order to verify the theoretical hypotheses.
This paper is organized as follow. Section two is devoted to the description of the adopted methodology and the main constructs/hypotheses of the proposed framework. In section three, we describe the main findings of our empirical study. After highlighting the validity of the results through factorial analysis, we use structural equation modeling in order to test the significance of the model hypotheses. Finally, we present a brief conclusion and our main research perspectives.
-
II. The proposed framework
-
A. Methodology and key concepts
2. Banks /Fintechs.
This work is the continuity of the paper which presents the theoretical framework of the study [2] (Fig. 1 below).
It is based on the inductive/deductive methodology as described by Mouchot [3].
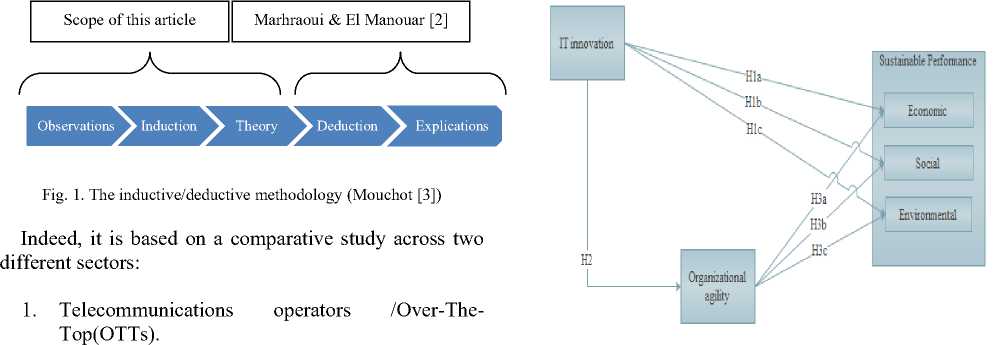
Fig.2. Our proposed framework
According to the observations, OTTs (like WhatsApp) have grown rapidly during the last ten years and have gained market share (SMS market for example) to traditional telecommunications operators.
In addition, new Fintechs are able to propose tailored and low cost solutions to customers and have a better time to market in comparison to banks.
The analysis of these observations has allowed formulating the research question and the main hypotheses.
Thus, the research question of the study is: can we generalize that agility and rapid IT innovation are two enablers for firms’ sustainable performance? And how can agility play an intermediary role?
IT innovation is related to the adoption of advanced systems and high performing standards in order to conceive new disruptive products or incremental innovative products for new uses [4].
It can also be related to the use of IT in the introduction of new or optimized production methods for delivering services [5].
Organizational agility is the combination of speed, flexibility, pro-activity, quality and profitability. It is completed through the integration of reconfigurable resources, best practices and knowledge management in order to deliver the right products and services to customers in a changing environment [6].
Furthermore, in this article, we study sustainable performance from a triple bottom line (TBL) perspective. Thus, we distinguish economic, environmental and social performance according to GRI (Global Reporting Initiative) guidelines [7].
-
B. Framework description
The framework’s hypotheses are summarized in table 1 below:
Table 1. Description of the framework hypotheses
|
Hypothesis |
Description |
|
H1a |
Firms adopting cutting edge IT innovation enhance their economic performance |
|
H1b |
Firms adopting cutting edge IT innovation enhance their social performance |
|
H1c |
Firms adopting cutting edge IT innovation enhance their environmental performance |
|
H2 |
Firms adopting cutting edge IT innovation are more agile |
|
H3a |
The more the firm is agile the more it is economically performing |
|
H3b |
The more the firm is agile the more it is socially performing |
|
H3c |
The more the firm is agile the more it is environmentally performing |
-
III. Empirical study
In order to verify the hypotheses of our proposed model, we conducted an empirical study. We’ve adopted a quantitative method based on a survey for measuring the impact of the use of IT innovation in order to enhance firm’s sustainable performance and the intermediary role of organizational agility.
Hereafter, we present the data collection method, the sample characteristics, the reliability/validity of the study and the hypotheses verification.
Organizational Agility – An Empirical Study
-
A. Data collection and sample characteristics
The questionnaire was sent to an initial database of one thousand trusted contacts holding different positions in SMEs and multinational companies in different sectors (banking, IT, industry, consulting …). This is in order to ensure the variation of the variables and to facilitate the generalization of the findings.
In order to ensure reliable contacts, the database was provided by an international training/consulting company.
The respondents are mainly from Moroccan companies (57. 28%). Moreover, we received responses from American countries (USA, Canada) and European countries (France, Germany, Austria, Hungary).
The remaining responses represent other countries in Asia and Africa. The detail of countries respondents is listed in table 2 below.
Table 2. Sample Characteristics (N=103)
|
Measure |
Item |
Percentage |
|
Gender |
Man |
62.14% |
|
Women |
37.86% |
|
|
Age |
18-29 |
31.07% |
|
30-44 |
38.83% |
|
|
45-59 |
25.24% |
|
|
60-74 |
4.85% |
|
|
Position |
Chief Executive Officer |
7.77% |
|
Board Member |
5.83% |
|
|
Manager |
53.40% |
|
|
Non manager |
33.01% |
|
|
Size |
< 10 |
14.56% |
|
Between 10 and 100 |
20.39% |
|
|
Between 100 and 5000 |
32.04% |
|
|
+5000 |
33.01% |
|
|
Sector |
Retail |
7.77% |
|
Banking |
14.56% |
|
|
Consulting |
10.68% |
|
|
Construction |
2.91% |
|
|
IT |
17.48% |
|
|
Energy |
12.62% |
|
|
Industry |
23.30% |
|
|
Others |
10.68% |
|
|
Country |
Morocco |
57.28% |
|
France |
8.74% |
|
|
USA |
8.74% |
|
|
Italy |
4.85% |
|
|
Germany |
3.88% |
|
|
Canada |
1.94% |
|
|
Austria |
1.94% |
|
|
Hungary |
1.94% |
|
|
Others |
10.68% |
-
B. Conctructs and corresponding items
The main constructs and the corresponding items are described in table 3 below.
Table 3. The constructs and corresponding items
|
Construct |
Item |
Literature |
|
IT innovation |
INN1: use of cloud computing in order to store data or access to shared resources |
Wladawsky-Berger [4] Tank [8] Barret et al. [9] Manyika et al. [10] Sambamurthy [11] Baalghusun & Qureshi [12] |
|
INN2: employees equipped with mobiles and dedicated work applications |
||
|
INN3: use of groupware and workflow tools in order to enhance collaboration |
||
|
INN4: business Analytics based on a big data initiative/project |
||
|
INN5: use of new elearning systems |
||
|
Organizational agility |
OA1: rapidly adapt to political and regulatory changes |
Sambamurthy et al.[13] Covey et al.[14] Markides [15] Brown and Eisenhardt [16] |
|
OA2: involve suppliers in the proposition of higher added value products/services |
||
|
OA3: integrate reconfigurable resources in order to be flexible to change |
||
|
OA4: adopt new organizational structures: self-management teams, holacracy, virtual teams... |
||
|
Economic performance |
SPEC1: total/net income |
Ding [17] Székely, and Knirsch [18] Bieker [19] Trébucq [20] |
|
SPEC2: Amount of sales |
||
|
SPEC3: Earning per share |
||
|
Environmental performance |
SPEN1:energy/water consumption |
|
|
SPEN2: waste |
||
|
SPEN3: emission of gases |
||
|
Social performance |
SPSO1: work conditions |
|
|
SPSO2: community initiatives and donations |
||
|
SPSO3: % suppliers that fulfill social criteria |
-
C. Reliability and validity
> Reliability/Internal consistency using Cronbach’s alpha and Gutmman’s lambda-2 :
In order to assess the reliability of our questionnaire, we used the Cronbach’s alpha and Gutmman’s lambda-2.
Indeed, the Cronbach’s alpha is related to the extent to which a set of items measures a single unidimensional latent construct. It will generally increase as the correlations among test items increase.
For our questionnaire, the value of Cronbach’s Alpha is nearly 0.90 which is an excellent index for internal consistency according to Bland and Altman [21] (See Fig. 3 below).
|
Cronbach's Alpha |
Cronbach's Alpha Based on Standardized Items |
N of Items |
|
,899 |
.900 |
1 8 |
Fig. 3. Internal reliability using Cronbach’s Alpha
Moreover, in order to ensure a high internal reliability, we used the Guttman’s lambda-2 which is the second in a series of 6 lambdas proposed by Guttman [22] in 1945.
We use the lambda-2 as Guttman has proved that among these 6 forms, only lambda-2 is closer to the true reliability [23].
The value of lambda-2 which is nearly 0.9 confirms the internal reliability of our questionnaire (Fig. 4 below) [22].
|
Lambda 1 |
,849 |
|
2 |
,902 |
|
3 |
,899 |
|
4 |
,720 |
|
5 |
,879 |
|
6 |
,931 |
|
N of Items |
18 |
Fig. 4. Internal reliability using Gutmman’s lambda-2
> KMO and Bartlett’s Test
Then we conducted a sample sufficiency test and a sphericity test.
Indeed, we used KMO (Kaiser-Meyer- Olkin) index which measures proportion of variance among variables that might be common variance.
Using IBM SPSS Statistics, we have a value of 0.828 (Fig. 5 below) which represents a high level of sampling adequacy [24].
Also, the Bartlett’s test of sphericity (Fig. 5 below) presents the validity and suitability of the collected responses to the problem being addressed through the survey. Considering a 95% level of significance (α = 0.05), the p-value (Sig.) of .000 is under 0.05, and therefore the factor analysis is valid [25].
We conclude that there may be statistically significant interrelationship between variables.
|
Kaiser-Meyer-Olkin Measure of Sampling Adequacy. В a ill eft's Test of Approx. Chi-Square Sphericity Sig. |
,828 869,477 153 ,000 |
Fig. 5. KMO and Bartlett’s Test
> Confirmatory factor analysis (CFA) :
In order to test how well the measured variables represent the constructs of our model, we conducted a confirmatory factor analysis (CFA).
CFA is a statistical method used by a set of researchers in order to confirm if the observed variables are representing a combination of unobserved constructs called factors or latent variables [26].
CFA is usually adopted in social sciences (especially in psychology) and in management/marketing studies.
We used AMOS software in order to test the prespecified relationships. Fig. 6 below presents the results of the CFA: factor loadings, factor covariances and error variances.
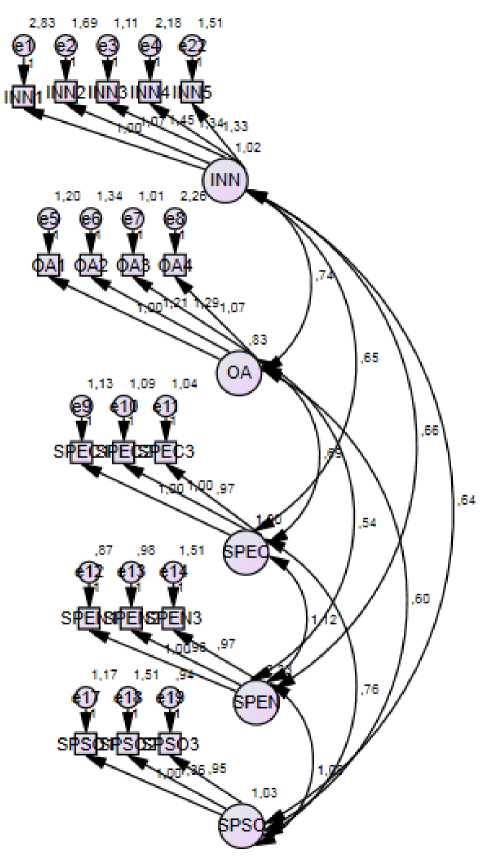
Fig. 6. The confirmatory factor analysis results
The goodness of fit of the model was measured through a set of indices as described in table 4 below:
We can conclude that the main indices (CMIN/df, RMSEA, CFI, and TLI) are acceptable and confirm a good fit of our model.
-
D. Hypotheses test
In order to verify the hypotheses of our model, we used a partial least squares path modeling method (PLS). This latter is a variance-based structural equation modeling (SEM) technique which allows estimating cause-effect relationship models containing latent variables.
Table 4. Measures used for assessing the fit of our model
|
Measure |
Definition |
Value |
Signification in comparison to threshold |
|
CMIN/df |
The CMIN represents the chisquare goodness fit or discrepancy function. df is the degree of freedom. The criterion for acceptance is less than 2 [27] |
1.490 |
Acceptable : less than 2 |
|
RMSEA (Root Mean Square Error of Approximation) |
A measure of goodness of fit for statistical models [28] |
0.069 |
Acceptable : below 0.10 |
|
CFI (Comparative Fit Index) |
Examining the discrepancy between the data and the hypothesized model [29] |
0.921 |
Good : upper to 0.90 |
|
TLI (Tucker-Lewis Index) |
Indicate how much better a model fits the data compared to a baseline model where all variables are uncorrelated [30] |
0.904 |
Good : upper to 0.90 |
PLS was introduced by the Swedish statistician Herman Wold [31] as an econometric technique. Otherwise, the main applications of this method are in chemistry and chemometrics.
The PLS path model includes inner and outer models. The inner model describes the relationships between latent variables (factors).
However, the outer model is related to the relationships between the latent variables and the observed variables [32] (Fig.7 below).
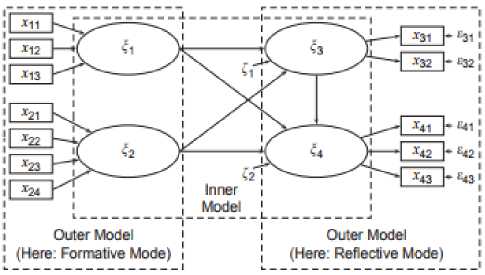
Fig. 7. Example of a PLS Path Model (Henseler et al., 2009)
In our case, the inner model is constituted by the 5 factors: IT innovation, organizational agility, economic performance, social performance and environmental performance. The related observed variables are described in table 3.
Using SmartPLS software, we calculated the PLS results on our model (Fig.8 below) with a top criterion of (10^-7) and a maximum number of iterations of 300 as advocated by Ringle et al. [33].
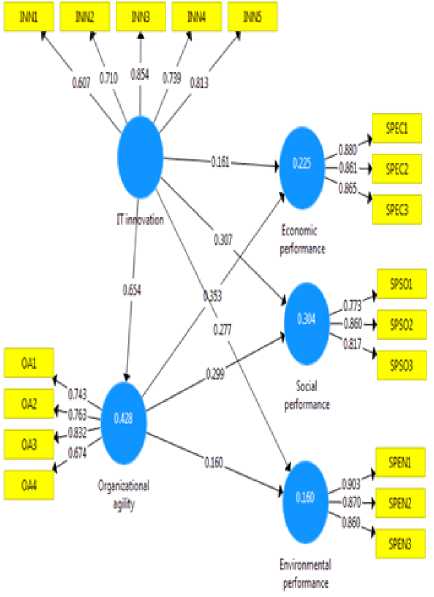
Fig. 8. The PLS-SEM results on our model
The results for our inner model are related to the causeeffect relationships between the exogenous latent variable (IT innovation) and the other endogenous latent variables (Economic, social and environmental performance) through the mediating variable (Organizational agility).
Considering the standardized path coefficient placed on the arrows, the direct effects are described in Fig. 9 below.
We can conclude that IT innovation has a significant impact on organizational agility (0.654). This supports our second hypothesis H2.
Also, organizational agility has a direct positive effect respectively on economic (0.353), social (0.299) and environmental (0.160) performance. This confirms H3a, H3b and H3c hypotheses: the more the firm is agile, the more it is sustainably performing.
Moreover, IT innovation has respectively a positive direct effect on social, environmental and economic performance of (0.307), (0.277) and (0.161).
H1a, H1b and H1c hypotheses are then validated. Also, we highlight the fact that the first concern of IT innovation is resolving social and environmental issues and then allowing firms to make profits.
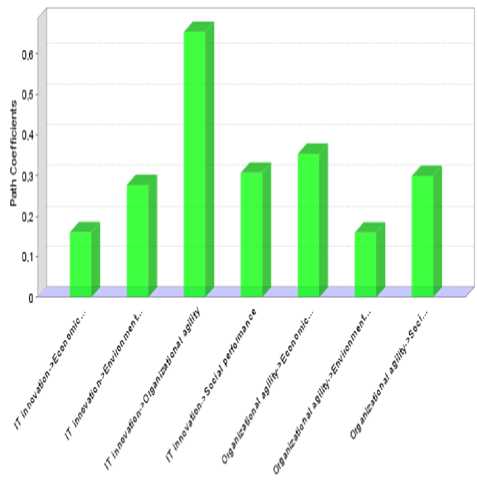
Fig. 9. Comparison of our model’s path coefficients
Nevertheless, IT innovation has greater indirect effect on economic (0.231) rather than on social (0.196) and environmental (0.105) performance (as mentioned in table 5 below).
This means that firms adopting IT innovation are more economically performing when they are agile.
Table 5. Indirect effects
|
Indirect effect |
|
|
IT innovation ->Organizational agility -> Economic performance |
0.231 |
|
IT innovation ->Organizational agility -> Environmental performance |
0.105 |
|
IT innovation ->Organizational agility -> Social performance |
0.196 |
In conclusion, IT innovation has a total impact on sustainable performance, which is the sum of direct and indirect effects (Table 6 below):
Table 6. The total effect of IT innovation on sustainable performance
|
Total effect of IT innovation |
|
|
On economic performance |
0.654*0.353 + 0.161 = 0.391 |
|
On social performance |
0.654*0.299 + 0.307 = 0.502 |
|
On environmental performance |
0.654*0.16 + 0.277 = 0.381 |
The greatest total impact is on social performance, then on economic and environmental performance.
-
IV. Conclusion and Research Perspectives
Through this empirical study, the importance of adopting IT innovation is highlighted. Indeed, IT innovation allows companies to enhance their sustainable performance either directly or indirectly by increasing their agility’s level.
Future research will focus on a specific sector or country and enlarge the sample size. Also, we will add other parameters which may impact the agility and firm’s sustainable performance.
References IT innovation and firm’s sustainable performance: the intermediary role of organizational agility – an empirical study
- B. Chakravorti, “How Companies Can Champion Sustainable Development.” Harvard Business Review. March 14, 2017. https://hbr.org/2017/03/how-companies-can-champion-sustainable-development.
- M. A. Marhraoui and A. El Manouar, “IT innovation and firm's sustainable performance: The mediating role of organizational agility.” In the 9th International Conference on Information Management and Engineering (ICIME 2017), in press.
- C. Mouchot, Méthodologie économique. Seuil, 2003.
- I. Wladawsky-Berger, “IT-based Innovation in the 21st Century” Stanford EE Computer Systems Colloquium, 2007.
- A. Y. Obeng and P. L. Mkhize, “Impact of IS Strategy and Technological Innovation Strategic Alignment on Firm Performance” International Journal of Information Technology and Computer Science(IJITCS), vol. 9, No. 8, 2017, pp.68-84. DOI: 10.5815/ijitcs.2017.08.08
- Y. Y., Yusuf, M. Sarhadi, and A., Gunasekaran, “Agile Manufacturing:: The Drivers, Concepts and Attributes.” International Journal of Production Economics, vol. 62, No. 1–2, 1999, pp. 33-43.
- GRI (Global Reporting Initiative), Sustainability reporting guidelines, www.globalreporting.org, 2002.
- D., Tank, M., “Enable better and timelier decision-making using real-time business intelligence system.” International Journal of Information Engineering and Electronic Business, vol. 7, no 1, 2015, pp. 43.
- M., Barrett, E., Davidson,, J., JPrabhu and S. L., Vargo, “Service Innovation in the Digital Age: Key Contributions and Future Directions.” MIS Q., vol. 39, No. 1, 2015, pp. 135–154.
- J., Manyika, M., Chui, J., Bughin, R., Dobbs, P., Bisson, and A., Marrs, “Disruptive Technologies: Advances That Will Transform Life, Business, and the Global Economy” McKinsey & Company, 2017.
- V., Sambamurthy, “Guiding the Digital Transformation of Organizations” Tallahassee, FL: Legerity Digital Press, 2012.
- A. O. Baalghusun and M. R. J. Qureshi,"A Novel Model for Cloud Based Mobile Learning System", IJIEEB, vol.6, no.6, 2014, pp.40-46. DOI: 10.5815/ijieeb.2014.06.05
- V. Sambamurthy,A Bharadwaj and V. Grover, “Shaping agility through digital options: reconceptualizing the role of information technology in contemporary firms” MIS Quarterly, vol. 27, No. 2, 2003, pp. 237–263.
- E. Overby, A. Bharadwaj, and V., Sambamurthy, “Enterprise agility and the enabling role of information technology” European Journal of Information Systems, Vol. 15, No. 2, 2006, pp. 120-131.
- C. Markides “Disruptive Innovation; In need of Better Theory” The Journal of Product Innovation Management, vol. 23, 2006, pp.19-25.
- K. M., Eisenhardt, and S. L., Brown “Product Development: Past Research, Present Findings, and Future Directions” The Academy of Management Review, vol. 20, No. 2, 1995, pp. 343-378.
- K. C., Ding “Developing a Multicriteria Approach for the Measurement of Sustainable Performance.” Building Research & Information, vol. 33, No. 1, 2005, pp. 3-16. doi:10.1080/0961321042000322618.
- F. Székely, and M. Knirsch, “Responsible Leadership and Corporate Social Responsibility:: Metrics for Sustainable Performance.” European Management Journal, vol. 23, No. 6, 2005, pp. 628-47. doi:10.1016/j.emj.2005.10.009.
- T., Bieker, “Sustainability Management with the Balanced Scorecard.” In Corporate sustainability : theoretical perspectives and practical approaches, edited by Ines Oehme, vol. 51, 2005, pp.121-46. München: Profil. https://www.alexandria.unisg.ch/39738/.
- S., Trébucq, “Réaliser une cartographie stratégique à partir des indicateurs GRI : Indicateurs et tableaux de bord.”, Édition AFNOR, 2009, pp. 1-22.
- J. M., Bland, & D. G., Altman, “Statistics notes: Cronbach's alpha.”., Bmj, vol. 314, No. 7080, 1997, pp. 572.
- L., Guttman, “A basis for analyzing test-retest reliability.” Psychometrika, vol. 10, No. 4, 1945, pp. 255-282.
- W., Tang & Y., Cui “A Simulation Study for Comparing Three Lower Bounds to Reliability.” Available online at: http://www.crame.ualberta.ca/docs/April 2012/AERA paper_2012.pdf, 2012.
- C.A., Cerny, & H.F., Kaiser, “A study of a measure of sampling adequacy for factor-analytic correlation matrices.” Multivariate Behavioral Research, vol. 12, No. 1, 1977. pp. 43-47.
- M. S., Bartlett, "Properties of sufficiency and statistical tests". Proceedings of the Royal Statistical Society, Series A 160, 1937. pp. 268–282 JSTOR:96803.
- R. J. Fox., "Confirmatory factor analysis". John Wiley & Sons, Ltd, 1983.
- M. T., Ullman, “The Declarative/procedural Model of Lexicon and Grammar.” Journal of Psycholinguistic Research, vol. 30, No. 1, 2001, pp. 37-69.
- DW, Kaplan, “Structural Equation Modeling: Foundations and Extensions” Thousand Oaks, CA: Sage Publications, Inc, 2000..
- K. J., Klein, F., Dansereau, & R. J., Hall, “Levels issues in theory development, data collection, and analysis” Academy of Management Review, vol. 19, 2004, pp.195 – 229.
- L. R. Tucker, and L. Charles, “A Reliability Coefficient for Maximum Likelihood Factor Analysis.” Psychometrika, vol. 38, No. 1, 1973, pp. 1–10.
- H. Wold, “Partial least squares.” Encyclopedia of statistical sciences,1985.
- J. Henseler, C. Ringle and R. Sinkovics, “The use of partial least squares path modeling in international marketing.” In : New challenges to international marketing. Emerald Group Publishing Limited, 2009. pp. 277-319.
- C. M. Ringle,., M. Sarstedt, R. Schlittgen et al. PLS “Path modeling and evolutionary segmentation.” Journal of Business Research, vol. 66, No. 9, 2013, pp. 1318-1324.
