ITD-GMJN: Insider Thread Detection in Cloud Computing using Golf Optimized MICE based Jordan Neural Network

Author: B. Gayathri
Journal: International Journal of Computer Network and Information Security @ijcnis
Article in issue: 6 vol.17, 2025.
Free access
Cloud computing refers to a high-level network architecture that allows consumers, authorized users, owners, and users to swiftly access and store their data. These days, the user's internal risks have a significant impact on this cloud. An intrusive party is established as a network member and presented as a user. Once they have access to the network, they will attempt to attack or steal confidential information while others are exchanging information or conversing. For the cloud network's external security, there are numerous options. But it's important to deal with internal or insider threats. Thus in the proposed work, an advanced deep learning with optimized missing value imputation is developed to mitigate insider thread in the cloud system. Behavioral log files were taken in an organization which is split into sequential data and standalone data based on the login process. This data was not ready for the detection process due to improper data samples so it was pre-processed using Multivariate Imputation by Chained Equations (MICE) imputation. In this imputation process, the estimation parameter was optimally chosen using the Golf Optimization Algorithm (GOA). After the missing values were filled, the data proceeded to the extraction process. In this, the sequential data are proceeded for the domain extractor and the standalone data are proceeded for Long Short-Term Memory-Autoencoder (LS-AE). Both features are fused to create a single data which is further given to the detection process using Jordan Neural Network (JNN). The proposed method offers 96% accuracy, 92% recall, 91.6% specificity, 8.39% fall out and 8% Miss Rate. The results showed that the recommended JNN detection model has successfully detected insider threads in a cloud system.
Cloud Computing, MICE, Behavioral Log Files, Golf Optimization Algorithm, LS-AE and Jordan Neural Network
Short address: https://sciup.org/15020117
IDR: 15020117 | DOI: 10.5815/ijcnis.2025.06.08
Text of the scientific article ITD-GMJN: Insider Thread Detection in Cloud Computing using Golf Optimized MICE based Jordan Neural Network
Cloud computing is becoming more and more popular, but security concerns are the main thing holding it back [1]. Security was the first major cloud difficulty, according to a recent Right Scale poll done in 2015; compared to the previous year's survey, there is now more worry regarding this challenge [2]. Furthermore, the INFOSEC Research Council asserts that insider threats present some really difficult difficulties. In the era of cloud computing, insider danger has started to affect this industry as well. The Cloud Security Alliance studies, which rank insider attacks among the worst dangers to cloud computing, corroborate this observation [3]. Insider threats are turning into a significant security risk for a lot of businesses. It is commonly understood to be described as malevolent insider acts carried out in a secure setting, frequently resulting in information theft, electronic fraud, and system sabotage. As a result, it could be detrimental to people, institutions, and national security.
Deep learning and machine learning approaches have recently been able to solve most cloud network security problems. Identifying user behavior from many angles is one of them that is extremely motivating to find a better solution. Organizations want real-time solutions, but conventional methods like Artificial Neural Networks (ANN) [9], Deep Belief Networks (DBN), Support Vector Machines (SVM), and Long Short-Term Memory (LSTM) [10] are inadequate. Moreover, given the variety of attack types, there is a strong need for machine learning algorithms that are both quick and efficient. Consequently, identifying, categorizing, and countering these insider threats calls for an efficient and successful strategy. So in the proposed work, an optimized neural network-based insider threat detection strategy is introduced to overcome the above-mentioned impacts. The collected organized data’s missing data are filled using optimized Multivariate Imputation by Chained Equations (MICE) missing value imputation. Then using LSTM-autoencoder (LS-AE) and domain knowledge to extract the features, which is further concatenated to give the Jordan Neural Network (JNN). In this case, the JNN context units are also called the state layer, and they receive their feed from the output layer rather than the hidden layer. In this way, the proposed model was utilized to detect the insider threat in cloud computing. The main objectives of the proposed model were shown as follows;
-
• An advanced Jordan neural network with an optimal MICE framework was developed to detect insider threads in cloud systems.
-
• Collected behavioural log files are categorized into standalone activities and sequential activities.
-
• Filling the missing values in the gathered data using an optimized MICE approach, thus improves the prediction
accuracy of the classifier.
• Extract the features from the pre-data using two methods domains based and LS-AE and these extracted data are concatenated to single data.
• A JNN classifier is utilized to detect the insider thread based on the extracted data.
2. Literature Review
The manuscript's remaining sections are broken down into the following sections: Section 2 reviewed a recently created insider thread forecast. A description of the suggested insider thread prediction process is provided in Section 3. Section 4 contains the findings and analysis of the suggested work, and Section 5 defines the proposed work's conclusion.
Due to their existence below enterprise-level security defences and their frequent privileged network access, insider assaults are challenging to detect and prevent. Several thread detection models were introduced based on the growing technology, and a few techniques were reviewed as follows.
Le and Zincir‐Heywood [11] developed a solution for many data granularity levels of abnormal behavior and insider threat identification based on user-centred machine learning. The goal is to support the cyber-security predictor during every stage of data observation and evaluation for insider threat forecast, including detection, pre-processing, and identification of behaviour based on machine learning, and result analysis. They could, however, also result in an average of the actual malevolent acts and necessitate a lengthier reaction time in the event that insiders are discovered. Muhammad Mehamood, et al. [12] suggested an ensemble machine learning-based system for insider threat detection and classification. Additionally, it created a methodical way to recognize different abnormal events that could indicate anomalies and security issues related to privilege escalation. That dataset is subjected to the application and analysis of four machine learning algorithms: Random Forest (RF), Adaboost, XGBoost, and LightGBM.
Meng et al. [15] represented to identify potentially harmful devices in MSNs and create an intrusion detection method based on behavioral profile and trust. By determining the variation in Euclidean distance among two behavioral profiles, a node's reputation can be assessed. One way to assess a node's reliability is to find the differences between its previous and current profiles. However, their method relies on the assumption that peers can be trusted, which leaves room for insider attacks. Bu and Cho [16] introduced a database intrusion detection system using a Convolutional Neural-Based Learning Classifier System (CN-LCS) depending on the RBAC principle. The integration of modelling procedures and rule generation in CN-LCS has been quantitatively compared using paired sampled t-test analysis and 10-fold crossvalidation tests. However, this model had high computational needs and required a significant quantity of labelled training data.
Hong et al. [17] represented a comprehensive feature engineering system that combines manually chosen and automatically derived features, all based on everyday actions. A residual hybrid network with CNN and GNN is also suggested, in addition to an organizational graph with nodes representing a user-day mixture, in order to enhance detection. But improving performance doesn't just mean putting parts on top of one another. Le et al. [18] developed a machine learning-based approach to user-centered insider threat prediction. In order to identify hostile insiders as well as malicious activities, data is analyzed at various degrees of granularity under realistic situations using ML. Organizational contexts can yield a vast array of data in a number of formats and sources. However, the model causes overfitting when the parameter value is really low.
Chadwick et al. [19] suggested a cloud-edge data sharing system with a five-tiered trust architecture. The data owner can choose a suitable trust level and CTI refinement strategy to alter the CTI data already making it available for investigation. The techniques can include homomorphic encryption, pseudonymization, and anonymization, as well as plain text. Sheykhkanloo and Hall [20] introduced insider threat detection using a widely used balancing method called spread subsample on a dataset that is very imbalanced. It consists of several steps, each with a different set of duties, including data cleaning, transformation, integration, reduction, and discretization. However, there hasn't been a thorough enough investigation into the significance of an unbalanced dataset.
Rabbani et al. [21] developed a probabilistic neural network for recognition and detection based on particle swarm optimization. Using a multi-layer neural network, the initial module for the detection procedure classified and identified the dangerous behaviors after meaningfully converting the user behaviors into a comprehensible format. Effective linear feature reduction approach PCA has the advantage of enhancing detection accuracy while needing less processing time, memory storage, and data transmission than other techniques. But occasionally, the system saw remarkably identical aberrant behaviors that interfered with its ability to recognize. Bouchama and Kamal [22] suggested a network traffic patterns can be behaviorally modelled by a machine learning system to improve cyber threat identification. The threat categories can subsequently be labelled by classifiers using anomalies that unsupervised models have identified. In order to counteract biases and increase overall forecast accuracy, assembling aggregates the detection results from several distinct models. That being said, the model is complicated and could lead to black boxes.
The above-mentioned literature has numerous techniques for detecting insider thread in a cloud environment. However, those models have some shortcomings in terms of achieving better results are longer reaction time [12], vulnerable for insider attacks [15], Needs a large amount of labelled data [16], imbalanced dataset [20], highly similar abnormal activities that affected the performance [21], and complex risk design [22]. To overcome these impacts a novel deep learning with missing data imputation based insider threat detection is proposed. The section that follows provides the description, operational states, and numerical modelling of the suggested model.
3. Proposed Methodology
Platform as a Service (PaaS), Infrastructure as a Service (IaaS), and Software as a Service (SaaS) are the three service models available for cloud computing. By offering a platform for application development and execution, the PaaS model makes life easier for users. Hosting servers, managing networks, and other resources for clients are just a few of the massive infrastructures that IaaS maintains to provide services to users. Installing and managing software services on one's own computer is a worry-free experience for users of the SaaS model. Attacks known as Denial of Service (DOS) or Distributed Denial of Service (DDOS) can cause data, applications, and services to become unavailable. So, in this proposed approach JNN based effective defensive strategy is developed against these kinds of attacks. The overall working process of the proposed model is illustrated in Figure 1.
Initially, the organization’s behavioral log is collected and split into two groups based on sequential and standalone activities. These data are pre-processed using MICE imputation values, in this the correct value of the estimation parameter was optimally chosen using the Golf Optimization Algorithm (GOA). The pre-processed data are further extracted using two methods, that is the standalone data are extracted using domain knowledge and the sequential data are extracted using LS-AE. The encoder portion makes up half of the LSTM auto-encoder, while the decoder portion makes up the remaining portion. The features of the input data were retrieved using symmetrical network of two LSTM layers. Based on the extracted data the insider threads were detected and aware of the organization using JNN. The modelling of the proposed insider thread detection is provided in below.
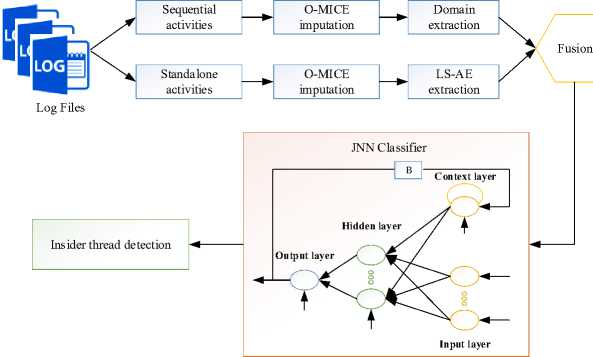
Fig.1. Architecture of proposed insider thread detection
Data Collection and Splitting
In the proposed work, a behavioral log files were taken for detecting insider thread users in a cloud system. Accurate data from behavioral log files is available to companies to assist them comprehend user behavior in real time. It is possible to gather these behavioral records utilizing remote servers and a client computer. Sequential and solo actions are the two categories into which these collected data are divided. To save processing time and improve prediction accuracy, the splitting data are pre-processed. Pre-processing process was clearly stated as follows,
Optimized MICE Imputation
A method for multiple imputation is known as Multivariate Imputation by Chained Equations (MICE) is comparable to fully conditional specification (FCS) for handling missing data. Using informed assumptions and modelling each variable with missing data based on its distribution is known as MICE [23]. The three steps that make up the implementation approach are:
-
• Imputation phase
-
• Analysis phase
-
• Pooling phase
Several imputed datasets are produced when the imputation process uses imputed missing data (m > 1) . Subsequently, every m imputed dataset undergoes a separate analysis in the analysis phase, employing a conventional statistical technique to extract parameter values and standard errors. Utilizing the total of the estimates and standard errors for the m points for each research project, the pooling stage produces a total estimation and average errors. Pt can give the estimated parameter based on the i th dataset. Next, by using Eqn. (1), the pooled estimates of the parameter P can be produced,
P^^i^(1)
The variance within-imputation is shown as V,
V^X^nVi(2)
where the projected variance is averaged for each imputed dataset. The variance estimates obtained from the i th dataset are denoted by V / . Imputation variance W, which is a different values that were imputed for different imputed datasets, can be expressed using eqn. (3).
w^y^-P)2(3)
The variance of the combined estimate is the weighted sum of two imputation variances (V), among imputation variance (W), and can be written as Eqn. (4).
Var(P) = V + (1 + ^) W(4)
where (—) is a representation of a correction for the unpredictability linked to a finite number of imputations. V^ is chosen as a constant value in this operation, which results in erroneous missing value filling. This is a statistical inference issue where the variance of an unknown distribution has to be estimated as a point estimate using a sample. Therefore, it was best to fill the values as needed. The Golf Optimization Algorithm (GOA) is utilized to select the ideal estimation parameter value in MICE, which enhances the performance of MICE by reducing error.
Golf Optimization Algorithm
Golf is an outdoor activity or sport that is played on individual or team layouts with specialized clubs that require skillful management. The fundamental principles of this game demand that it is essentially an artistic endeavor in which a ball is launched from its starting point in the direction of a faraway hole. This activity, which is played with deliberate strokes and is subject to a set of rules, is golf's ultimate form. Beneath this seemingly simple exterior, though, the rules of the game introduce subtleties that create an increased degree of difficulty. The strategic dexterity needed to direct the golf ball into the waiting hole is essential to this endeavor. This tactical dance, an exercise in intelligence, is a source of motivation for the development of an innovative metaheuristic algorithm. The GOA was modelled after this exact tactic, with its features neatly incorporated within a methodical framework. This strategic dance finds embodiment in the GOA, where its complex movements are outlined and its theoretical foundations are solidified by thorough mathematical modelling. Utilizing this tendency to determine the variance estimator's ideal solution [24].
Initialization
GOA is a population-based approach that finds relevant solutions to optimization issues by randomly searching through its members' membership in the problem-solving space. The location of the GOA members within the problem search space determines the values of the problem variables.
^ = м2.....vn
Where, n denotes the number of population.
Objective Function
To identify a solution to a specific issue that is almost as good as the desired problem, an objective function known as a fitness function is employed. The Mean Square Error (MSE) is utilized to measure fitness in this case. A smaller mistake is nearer the target values of the controller system.
J^YPMV-Pnl (6)
where, Pn denotes the observed value of each population set, yr(t) denotes the reference value, and J represent MSE.
Updation
Following the completion of the algorithm's fitness function phases, GOA starts updating the population members. The population of GOA is updated in two stages: exploitation and exploration. The best ideal value is determined by updating each iteration value.
Phase 1: Exploration
The best member's position is referred to as the "hole" in GOA. This approach covers a variety of search spaces, demonstrating the GOA's capacity for exploration in a worldwide search.
x^=[
'xP, FP < Ft
. Xt, else
Where, XP denote the newly determined GOA member's status depending on the exploration stage, FP denote objective function value, and X ; is ith position GOA member.
Phase 2: Exploitation
This tactic makes it possible to thoroughly search the area where each GOA member is situated, demonstrating the GOA's potential for exploitation in local searches.
X‘=(.
' xP, FP < Ft
. Xt, else
Where, Fp is its objective function value, Xp indicate the ith GOA member's updated determined status based on the exploitation phase, and Xt is ith position GOA member.
Termination
It is the last procedure, and it happens once the best solution has been found. After filling the values, both sequential and standalone activities are extracted using LS-AE extraction.
Feature Extraction
There are two subtle ways that bad insiders could reveal themselves in their behaviour. First, if an activity in a daily schedule deviates greatly from the norm, it may be a sign of a threat. An example of this would be the first logon time. Secondly, the tasks completed by an employee would take place in a time series that naturally generates a succession of events during a single workday. A sequence of activities that has a distinct pattern from others may also be a useful signal for detecting insider threats.
Domain Extraction
Based on subject expertise, elements of stand-alone activities are chosen for every user-day. The result of this manual selection is the output feature matrices for every user day from this data stream, which is represented as Xm (Xm E Rn*dm), where dm is the amount of manually chosen attributes for each user-day and n is the overall amount of user-day combinations. The manual feature vector for a given user-day might be written as x ^ E Rdm(ie{1,2, ., n}).
LS-AE Extractor
Regarding consecutive actions, created an auto-encoder that automatically extracts valuable characteristics using a popular LSTM model. One must first select a predetermined input sequence length L in order to use the LS-AE; the real sequence then filled to its length L. Every daily action sequences is encoded as S (t) = {5 1 ,5 2 ,... s t } afterwards one-hot encoded, where S (t) E Rn * ds(i E {1,2, ... ,n}) and ds denotes encoded activities dimension. This S (t) sequence is what our autoencoder receives as input. The encoder portion makes up half of the LS-AE, while the decoder portion makes up the other half. Figure 2 shows the Structure of LS-AE extraction.
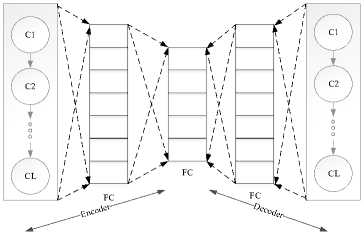
Fig.2. Structure of LS-AE extraction
S (t) = {^ 1 ,5 2 , . 5l} is each sequence that is fed into the LS-AE throughout the training process. The output S t = {5 1 ,5 2 , ... 5l} in decoder is subsequently contrasted at the raw input sequence. Through reducing the variations among S t and St . Given that the trained encoder automatically generates such features, afterwards training at every sequence S (t) , the feature that was retrieved from the output of the encoder component will be displayed as xla E Rda(i E {1,2,... n}), where da stands for automatic feature’s dimension. The automatic feature matrix of sequential activities, or Xa , is obtained by summing the involuntary features at all days. Here, n signifies the number of user days, Xa E Rn * da .
Feature Fusion
At the ultimate phase of feature production, characteristics derived from both automated and manual methods are combined to create the ultimate behavioural feature,
Xb = fusion (Xm^ (9)
Where, Xb E Rn * (dm+da) is a final behavior feature matrix in all days. The dimensions of every feature vector are dm + da. The behavioral traits for the ith user-day could be expressed as follows: x a E R(dm+da\ where i E {1,2,..., n}.
Jordan Neural Network
Jordan neural network (JNN) is similar to a feed forward network that only has one hidden layer; the context layer is added. As opposed to the concealed layer, the context units receive their feed from the output layer. The state layer is another term for the context units in a Jordan network. They consistently feel a connection to themselves. The output layer, hidden layer, input layer, and context layer are four components which develop JNN. The information from the output layer is stored in the context layer due to a first-order delay operator at a link between two layers [25]. Linear and nonlinear activation functions are the two different forms of activation functions in neural networks. In this study, the hidden layer uses a sigmoid nonlinear activation function and the output layer is considered as linear function that is represented as f(x) = 1/1 + e-1. Figure 3 displays the Jordan neural network topology.
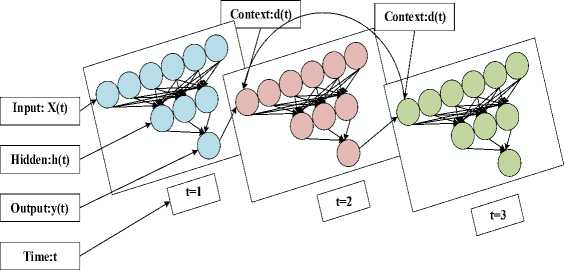
Fig.3. Architecture of JNN topology
X(t) = (x(t),x(t — т), x(t — 2т), ,.,x(t — (m — 1)t))t is utilized to denote the input vector of JNN, where t = n 1 ,n 1 + 1, .,n as well as n 1 = 1 + (m — 1)т. h(t) = (h 1 (t), h2(t),..., hr(t))T denote the hidden layer’s output vector. (W (1) )(i = 1,2, ...,r,j = 1,2,.,m) signifies weights from the input neuron to ith first hidden layer neuron. (^ j 2) )(i = 1,2, .,r) indicates weights from context layer neuron to ith first hidden layer neuron. (^ (3) )(i = 1,2, .,r) denote weights from ith hidden neuron to output layer neuron. (b (1) )(i = 1,2, ...,r) signifies biases of hidden layer neuron. b(22and b (3) are biases of the output layer and context layer, individually. f22and f (3) are activation functions of the output layer and context layer, individually, and it were usually linear function, while f1(i = 1,2,..., r) are hidden layer neurons and activation function. h / (t)(i = 1,2, ...,r) denote value of the hidden layer neuron. d(t) andy(t) are the value of the context layer and output layer. The following indicators will be covered in order to write effectively and with ease:
JNN is obtained as:
W— = (^(1)) = (W^)
W(1)V
,i = 1,2,...,r;j = 1,2,.,m
W(2) = ((2)(2))£=1,2 r = ((2)12), (2)22).....(2)®)T
W(3) = ((З)®)^ r = ((3)13), (3)23).....(3)r3))T
b(1) = ((1)11),(1)21).....(1)^)T
h;(t) = (1)“x(t) + (2)(2)d(t) + (1)(1)), 1 < t < T, i = 1,2,... r
y(t) = f(2)(ZU W(34(t) + b(2)),1 < t < T
d(t) = f(3)(ad(t — 1) + y(t — 1) + b(3)), 1 < t < T, d(0) = d(1) = 0
The Takens embedding theorem yields the following equation:
x(t + 1) ~ y(t) = g(X(t)),
Where x(t + 1) denote the fitting value of JNN at time t. The smooth mapping g is stated as in
g(X(t)) = f(2)(Z[=1[^(3)f(1)(^(1)X(t) + ^[2)f(3)(ad(t — 1) +y(t — 1) + b(3)) + b^} + b(2))
Based on the concatenated features, the insider thread was detected. The performance of the proposed JNN based thread prediction is shown in the below section.
4. Result and Discussion
In this section, JNN with an optimized MICE model was developed to detect insider thread in a cloud system as per the behavioral log data. One of the biggest obstacles to protecting computer networks and systems is insider threats. It is the responsibility of organizations to maintain the security of their network layers and to stop breaches at all levels. So in the proposed work, behavioral data are gathered from an organization to detect the insider thread to aware the users. The proposed model was implemented using MATLAB/Simulink 2021b software with Intel Core i7 CPU, NVIDIA GeForce RTX 3070 GPU, and 64GB RAM. The dataset used to analyze the proposed model was discussed as follows.
Dataset Description
A group of synthetic insider threat test datasets which offer both malicious actor and background synthetic data. A set of synthetic insider threat test datasets was created by the CERT Division with support from DARPA I2O and in collaboration with ExactData, LLC. These datasets offer data from artificially generated harmful actors as well as synthetic background data. The datasets are organized according to the data generator's release date. Many datasets are included in most releases (e.g., r3.1 and r3.2). A superset of the data creation capabilities from prior releases is typically included in later editions. A readme file that includes comprehensive notes about the features of that release is included with every dataset file [26]. It also uses NSLKDD [27] and UNSW-NB15 [28] dataset for insider threat detection. The four distinct clusters that represent the four prevalent assault types are created by analyzing and classifying the NSL-KDD data set. An extensive analytical analysis is conducted on the training and test data sets. Here is the train and test data set of 20%. Duration, protocol_type, service, flag, src_bytes, dst_bytes, land, incorrect_fragment, urgent, and hot are the parameters taken into account when training the classifier. The UNSW-NB15 dataset contains nine different types of attacks. The IXIA PerfectStorm program in the UNSW Canberra Cyber Range Lab was used to build the raw network packets for the UNSW-NB 15 dataset. This produced a mixture of real modern normal activities and synthetic contemporary assault behaviors.
Using this dataset to split the sequential and standalone behavior, then the missing value in the dataset is filled using an optimized MICE approach. After that, the filling data are extracted individually through the use of domain knowledge and LSA extractor. The extracted data are further proceed to the JNN classifier for predicting the insider thread in the cloud system. The overall performance of the proposed model was discussed as follows,
Table 1. Parameter for GOA
|
Parameters |
Values |
|
Search agents |
30 |
|
Max iteration |
100 |
|
Higher limit |
50 |
|
Lower limit |
5 |
|
r (Random value) |
0.5 |
|
I (situation parameter) |
2 |
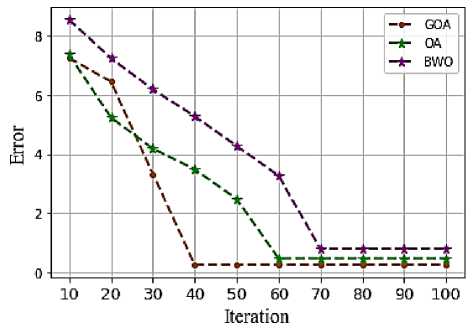
Fig.4. Convergence curve of optimized MICE
The simulation parameters utilized for Golf Optimization Algorithm for this proposed approach is given in Table 1. Search agents, max iteration, upper and lower limit are considered as a numerical values. r denotes the random value selected between 0 and 1, here 0.5 shows better outcome. I am the parameter used to simulate the situation whose value is set at 1 and 2. Value of 2 indicates better exploration ability.
The convergence curve of GOA with the existing model comparison is shown in Figure 4. It shows the proposed GOA provide a better solution at a low error of 1.2, but the existing Osprey optimization algorithm (OA) offers at error of 3 and Black Widow Optimization (BWO) provide an error of 5. Thus demonstrate the overall error values is reduced to select the optimal solution of the MICE parameter.
Epochs
Epochs
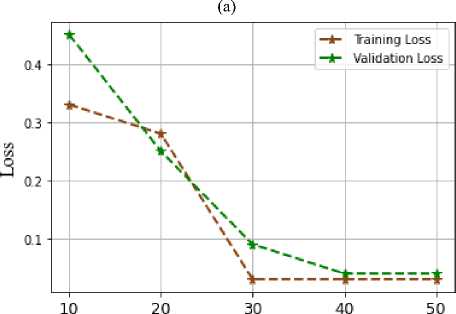
(b)
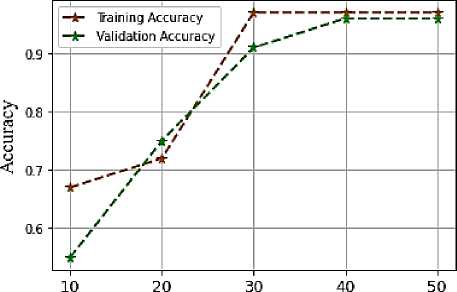
Fig.5. Analysis of proposed model training and validation (a) accuracy (b) Loss
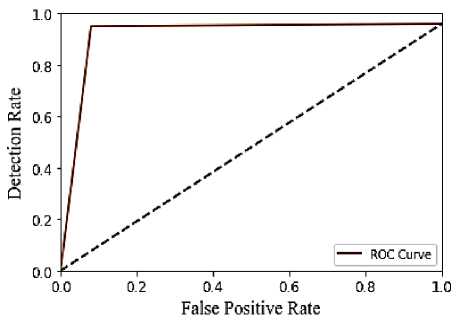
-
Fig.6. ROC of proposed model
A comparison of accuracy throughout multiple training epochs is displayed in Figure 5 (a). This proposed classifier's accuracy value is 97% because its epoch is 50. Raise the epoch value to improve the training accuracy of the suggested model. Similarly, an accuracy comparison over multiple validation epochs was noted. This proposed classifier has 50 epochs, which results in an accuracy value of 96%. Figure 5(b) illustrates the training loss, which is calculated by deducting the accuracy value from 100. The suggested JNN offers superior training performance, as evidenced by both accuracy and loss in training period values. After analysis and observation, the validation loss is found to be 0.4% for the validation period at epoch 50. The suggested JNN offers an improved validation performance, as proven by both accuracy and loss in validation period values.
A measurement technique for identifying issues and providing insider thread diagnosis is the ROC curve. The probability curve that contrasts the detection rate with the false positive rate at various threshold levels is displayed in Figure 6. Consequently, demonstrates that the recommended method performs better when separating insider threads from normal threads. Thus, demonstrates that the suggested model provides improved prediction performance.
Comparison Analysis
The suggested JNN is contrasted with current classifiers such as deep belief network (DBN), long short-term memory (LSTM), and Deep neural networks (DNN). Table 2 demonstrates the parameters with its ranges of proposed JNN and existing approaches.
Table 2. Parameter with its ranges of proposed and existing methods
|
Parameters |
Methods |
Ranges |
|
Activation function |
JNN |
tanh |
|
Dropout |
0.2 |
|
|
Loss function |
MSE |
|
|
Activation function |
LSTM |
tanh |
|
Dropout |
0.3 |
|
|
Loss function |
MSE |
|
|
Bath size |
DBN |
5 |
|
Learning rate |
0.1 |
|
|
Transfer function |
Sigmoid |
|
|
Hidden layer |
DNN |
4 |
|
Activation function |
Soft sign |
|
|
Loss function |
MSE |
The performance metrics utilized for evaluation between proposed and existing classifiers are precision, accuracy, recall, specificity, error, FOR, FDR, NPV, F1_Score, FNR, MCC, and FPR.
-
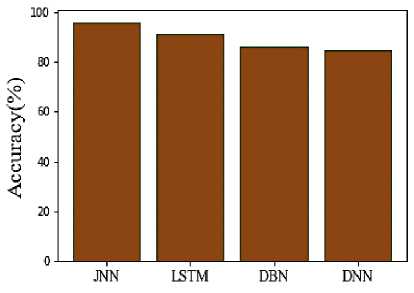
Fig.7. Comparison of accuracy
The accuracy of the proposed and suggested approaches is shown in Figure 7. The ratio of precisely predicted points (predicts) to all of the correct predictions ultimately essential. Its value is in the interval of 0 to 1. The accuracy of the suggested technique is 96%, whereas that of LSTM is 91.4%, DBN is 86.2%, and DNN is 84.6%. The suggested model is more effective when compared to current techniques. The Positive Predictive Value (PPV) of the suggested and used approaches is shown in Figure 8. Because it indicates the likelihood that a positive test would actually represent the underlying illness, PPV is another indicator of a biomarker's performance. The PPV of the suggested approach is 94%, while that of LSTM, DBN, and DNN is 86%, 79%, and 83%, respectively. The comparison shows that the proposed approach outperforms conventional models in terms of PPV.
Fig.8. Comparison of PPV
Fig.9. Comparison of Hit Rate
Fig.10. Comparison of selectivity
Fig.11. Comparison of NPV
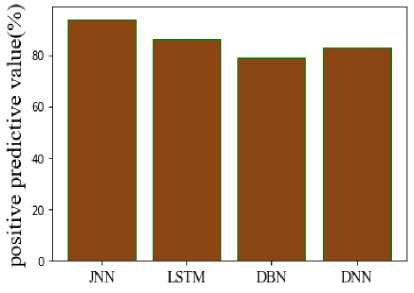
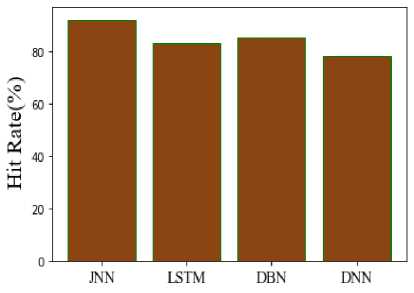
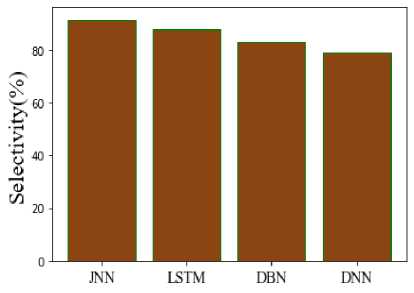
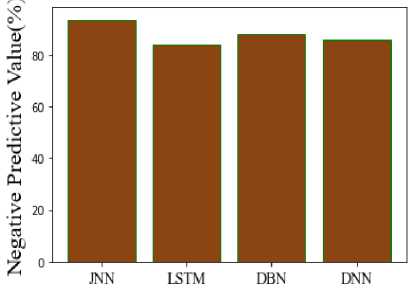
Fig.12. Comparison of FOR
Fig.13. Comparison of fallout
Fig.14. Comparison of miss rate
Figure 9 compares recall for suggested and existing methods. T Recall is calculated by dividing the number of positive samples which were correctly classified as positive by the overall number of positive samples. Compared to other existing methods like LSTM, DBN, and DNN, which have recall values of 83%, 85%, and 78%, the proposed JNN has a recall value of 92%. Figure 10 compares the selectivity of recommended and current techniques. The capacity of a model to forecast true negatives for every category that is accessible is measured by its specificity. Compared to some of the other existing techniques, such as LSTM, DBN, and DNN, which had comparable specificity values of 88%, 83%, and 91.679%, the recommended method's specificity value was found to be 91.6%.
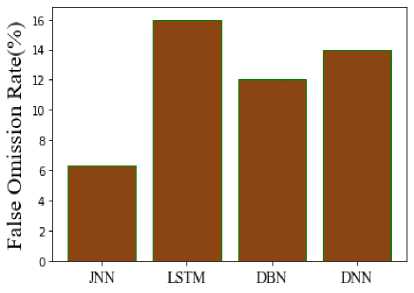
Figure 11 illustrates the negative predictive value (NPV), this represents the proportion of individuals who received a negative diagnosis to all participants who had negative test findings. The new method's NPV is 93.7% that of the current one. It is 84% for LSTM, 88% for DBN, and 86% for DNN. It is evident from this that the suggested model provides a better solution than the conventional models. Figure 12 makes the erroneous omission rate of the suggested and current comparison very evident. The percentage of negative outcomes that are false negatives is known as the false omission rate, or FOR. In contrast, the JNN has 6.29% FOR, LSTM has 16% FOR, DBN has 12% FOR, and DNN has 14% FOR, per the comparison. Hence, demonstrates that the suggested model performs more effectively than the conventional models.
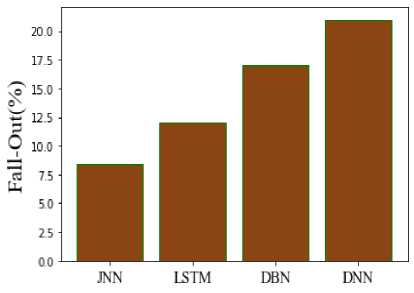
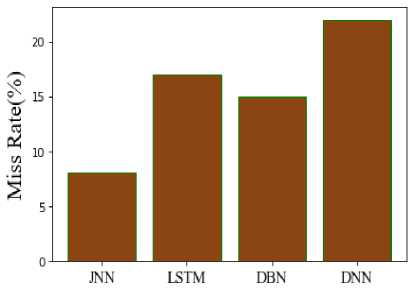
A comparison between the suggested and current procedures is shown in Figure 13. The quantitative probability of each positive or negative test result leading to a positive result due to a flaw is computed using the fallout method. The fallout from the proposed technique is 8.39%, compared to 12% from the current LSTM, 17% from DBN, and 21% from DNN. As a result, compared to standard models, the suggested model provides better results. Figure 14 displays the comparison of the Miss Rate (MR) between the recommended and current methods. Positive class labels are incorrectly predicted by the model as negative, leading to a predicted value of negative but a real value of positive. The MR of the suggested approach is 8%, compared to 17% for the current LSTM, 15% for DBN, and 22% for DNN. It shows that the JNN produces superior results than the current methods.
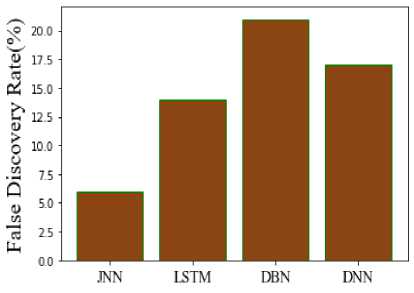
Fig.15. Comparison of FDR
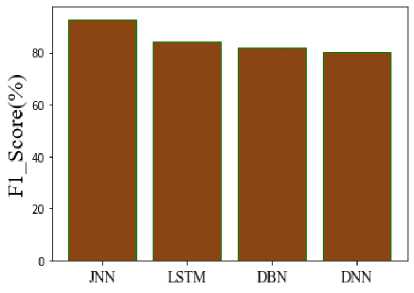
Fig.16. Comparison of F1_score
In Figure 15, the FDR of the suggested and current comparison is displayed clearly. The efficacy of testing numerous hypotheses simultaneously can be evaluated using the False Discovery Rate (FDR), an accuracy statistic. According to the comparison, the FDR for JNN is 6%, LSTM is 14%, DBN is 21%, and DNN is 17%. It determines the proposed model has a lower FDR than conventional methods. The proposed F1 Score and the existing F1 Score are contrasted in Figure 16. The binary kinds of the system and the degree of correctness of the data set are revealed by a statistical analysis of the F1_ score. The suggested JNN has an F1 Score of 92.98%, LSTM of 84.47%, DBN of 81.89%, and DNN of 80.42%. According to the evaluation, the recommended model performs better than the other models.
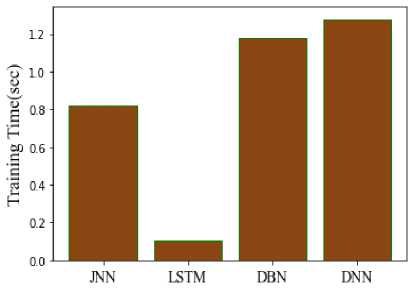
Fig.17. Comparison of training time
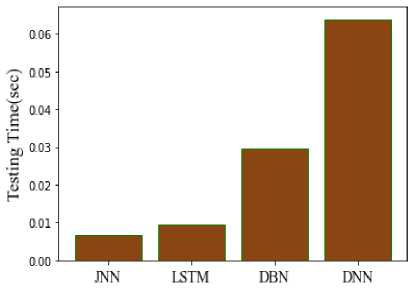
Fig.18. Comparison of testing time
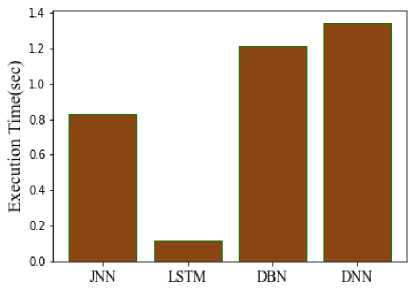
Fig.19. Comparison of execution time
Computational timing analysis includes timing for testing and training. The amount of time an algorithm needs to use training data to create a model is known as the training time, as seen in Figure 17. There is a testing phase to determine whether a trained model will perform as intended. During the testing phase, a classifier makes predictions about the results using a trained model. The training times for the suggested approach are 0.823 seconds, LSTM 0.104 seconds, DBN 1.18 seconds, and DNN 1.28 seconds. Testing times for the suggested approach are 0.0068 seconds, 0.0095 seconds for LSTM, 0.0295 seconds for DBN, and 0.0639 seconds for DNN. Figure 18 compares the computation times of the suggested and current models in order to verify the procedure. The answer is provided by the suggested JNN in 0.8298 seconds, however it is provided by the conventional LSTM model in 0.11349 seconds, the DBN model in 1.2095 seconds, and the DNN model in 1.3439 seconds. When compared to other models, the comparison gives the suggested model a quicker processing time and produces better predictions than the conventional methods in Figure 19.
Table 3. Comparison of performance metrics
|
Methods |
Accuracy |
Recall |
Precision |
F1_score |
|
Proposed JNN |
0.96 |
0.92 |
0.94 |
0.92 |
|
LSTM |
0.62 |
1 |
0.62 |
0.76 |
|
CNN |
0.58 |
0.90 |
0.61 |
0.73 |
|
CNN-BiLSTM |
0.63 |
0.99 |
0.62 |
0.77 |
|
ORC_NN |
0.94 |
0.80 |
1 |
0.89 |
Table 3 demonstrates the comparison of performance metrics at the proposed JNN and existing models. The existing was taken as LSTM [29] Convolutional Neural Network (CNN) [30], CNN-BiLSTM [31], and Optimized Recurrent Convolutional Neural Network (ORC_NN) [32]. The comparison shows that the suggested model outperforms the conventional models in terms of results.
Table 4 shows the comparison of proposed approach with existing algorithms using two various dataset called NSL-KDD and UNSW-NB15. These comparison clearly demonstrates that the proposed JNN algorithms produce better results than other current approaches for two datasets.
Table 4. Comparison of proposed algorithm using 2 different datasets
|
Performance |
NSL-KDD |
UNSW-NB15 |
||||||
|
JNN |
LSTM |
DBN |
DNN |
JNN |
LSTM |
DBN |
DNN |
|
|
Accuracy |
97% |
92% |
86% |
89% |
90% |
80% |
79% |
80% |
|
Sensitivity |
96% |
86% |
74% |
90% |
91% |
81% |
80% |
79% |
|
Specificity |
96% |
95% |
94% |
81% |
92% |
87% |
74% |
83% |
|
FPR |
5% |
13% |
25% |
5% |
3% |
15% |
12% |
20% |
|
FNR |
6% |
5% |
3% |
14% |
4% |
10% |
20% |
17% |
|
Precision |
95% |
86% |
77% |
90% |
94% |
82% |
84% |
74% |
|
FDR |
7% |
14% |
30% |
6% |
6% |
24% |
17% |
24% |
|
F1_Score |
97% |
91% |
84% |
84% |
91% |
84% |
80% |
74% |
Discussions
Several existing approaches were developed for insider threat detection in cloud environment. At first, the existing LSTM algorithm utilized for detecting DDoS in public cloud network. But this approach has low accuracy. Second, hybrid CNN with grey wolf optimization algorithm was employed for anomaly detection in cloud datacenter networks. High processing time was taken by this hybrid approach. Finally, hybrid CNN-LSTM approahces are utilized in the existing papers for detecting insider threat in the cloud environment. But it needs large amount of labelled data. In this proposed approach, JNN algorithms is developed for effective prediction of threats in cloud. The effectiveness of this proposed JNN is evaluated by comparing this with various existing approaches. These comparison metrics clearly demonstrates that the proposed JNN approach produce better outcome than other algorithms.
5. Conclusions
An advanced JNN with optimized MICE configuration was introduced to detect insider thread in cloud computing. Insider threats are multifaceted and can fit into several categories. This encompasses the malevolent insider, the negligent, oblivious, unsophisticated, or gullible worker, and the outside contractor. Thus, in the proposed work, detect the insider thread to mitigate file hacking for unauthorized users. The insider thread was detected based on behavioral log files, initially this is split into sequential data and standalone data. Then filling the missing places in these data using an optimized MICE model. In this approach, the n-estimator parameter was set as random thus cause poor value replacement. So in the proposed model, a GOA is utilized to find the optimal value to improve the performance of the MICE model. In the realm of the GOA, this strategic dance finds embodiment, its intricate steps delineated, and its conceptual underpinnings crystallized through rigorous mathematical modelling. In this way, the optimal solution of MICE was estimated. After filling the missing places, the data is going for the feature extraction process. Both sequential data and standalone data’s features are extracted individually using a domain extractor and LS-AE extractor. The domain extractor's output features matrix for every user-day in this stream. It has the automatic feature matrices of sequential tasks utilizing LS-AE by combining automatic features from every user-days. Then these features are combined to make a single data that is given to JNN detection model. Elman networks are comparable to Jordan networks. As opposed to the concealed layer, the context units receive their feed from the output layer. The state layer is another term for the context units in a Jordan network. A cloud computing organization's thread is identified by the JNN based on its attributes. The proposed method offers 96% accuracy, 92% recall, 91.6% specificity, 8.39% fall out, 8% Miss Rate, 0.823 sec training time, 0.0068 sec testing time, and 0.8298 sec overall computation time. This shows the proposed JNN detection model offers a better solution at all period, however the overall training speed of JNN is quite low compared to another networks. However, the over fitting problem may arise in the JNN which affects the performance proposed approach. In future, a hybrid techniques or any other deep learning based ensemble model will be preferred for detecting insider thread in cloud computing.
Acknowledgement
Funding: The authors declare that no funds, grants, or other support were received during the preparation of this manuscript.
Conflict of Interest: The authors declared that they have no conflicts of interest to this work. We declare that we do not have any commercial or associative interest that represents a conflict of interest in connection with the work submitted.
Availability of data and material: Not applicable
Code availability: Not applicable
Author contributions: The author claims the major contribution of the paper including formulation, analysis and editing, provides guidance to verify the analysis result and manuscript editing.
Compliance with ethical standards: This article is a completely original work of its authors; it has not been published before and will not be sent to other publications until the journal’s editorial board decides not to accept it for publication.
