Key performance indicators: economic and mathematical approach

Author: Dobrenkov Vladimir Ivanovich, Afonin Yury Alekseevich
Article in issue: 3 (56) т.18, 2022.
Free access
This article is a scientific and educational journey across the contemporary tools for managing social organizations in Russia and abroad. It presents several methods, methodologies and management models which are used by exceptional Russian organizations. This volume best resembles a practical manual for managers who daily come in contact with issues arising from the real-time operations of their organization, including conflict resolution, team building, and the development of a strong corporate culture. It will help readers shed light on the complex and multifaceted atmosphere within the company and outside of it, analyze the development situation, and bring about change within them and within their business while keeping in step with the dynamic processes world-wide.
Indicative management, indicator-based management, macroeconomic level, territorial level, mesoeconomic level, microeconomic level, sustainable development indicators, criteria, simple indicators, linking indicators, ongoing feedback, institutional aspects, social aspects, environmental aspects
Short address: https://sciup.org/14125369
IDR: 14125369 | UDC: 51-77:519.71
Ключевые показатели производительности: экономический и математический подход
Данная статья представляет собой научно-познавательное путешествие по современным инструментам управления общественными организациями в России и за рубежом. В ней представлено несколько методов, методологий и моделей управления, которые используются выдающимися российскими организациями. Работа аналогична практическому руководству для менеджеров, которые ежедневно сталкиваются с проблемами, возникающими в ходе работы их организации в режиме реального времени, включая разрешение конфликтов, построение команды и развитие сильной корпоративной культуры. Она поможет читателям пролить свет на сложную и многогранную среду внутри компании и за ее пределами, проанализировать ситуацию в области развития и добиться изменений внутри себя и своего бизнеса, не отставая от динамических процессов во всем мире.
Text of the scientific article Key performance indicators: economic and mathematical approach
Indicator-based management has as its foundation the research and analysis of economic factors observed at any given organization. An indicator, in this case, is defined as the limits of economic factors which describe the life of the organization, holding, country, etc, and within which it can stability exist and grow.
At the heart of the indicative management lies a set of indicators which allow the managers not only to detect any economic deviations from the original plan, but to take preventative measures before problems occur. The indicator itself is a set of upper and lower limits, describing at the bottom the minimal allowable economic values, and at the top – the maximum possible (Rausch et al., 2013).
Indicative management, a set of procedures used to coordinate production processes, is realized at different levels of management:
-
1. at the macroeconomic level – in the form of forecasts, budget plans and programs developed by the federal economic agencies
-
2. at the regional or territorial level – in the form of regional forecasts, programs and budget plans developed by Federal subject agencies and municipal entities
-
3. at the mesoeconomic level – in the form of plans, forecasts and programs for the growth of economic sectors and sub-sectors, territorial-production complexes and industrial clusters, developed by meta-corporations (inter-sector, inter-regional and international financial and industrial groups)
-
4. at the microeconomic level – in the form of strategic development plans for the growth of corporations as legal entities.
Indicative management allows the following:
1. trace the changes in the dynamics of those economic indicators, which are most important for the company
2. given the limits of these indicators, assess the situation at the company
3. to have extra time to make managerial decisions depending on the company's situation
The purpose behind indicator-based planning lies in determining the factors or indicators which reflect the economic activities of the entity. Subsequently, based on these factors, planning, forecasting, accounting, and monitoring of the organization's activities takes place (Odiorne, 2005).
2. Models and methods
In order to do indicator-based planning it is important to daily track the changes in the economic factors within the indicator. This is what will provide the managers with the ability to make decisions without having to allow their company to reach extreme, pre-crisis conditions (Vissema, 2000).
Sustainable Development Indicators
The need to develop sustainable development indicators was defined in “Agenda 21”, which was passed by the United Nations at the historical summit in Rio de Janeiro in 1992. The global program called Agenda for the 21st Century was intended to prepare the international community to address issues that civilization would come in contact with at the turn of the century. The document was divided into four sections: social and economic dimensions, conservation and management of resources for development, strengthening the role of major groups, and means of implementation. In chapter 40 of this document, titled “Information for Making Decisions”, it is written: “In order to create a reliable foundation for the decision-making process all levels, and to facilitate the selfregulating sustainability of complex environmental systems and development systems, it is necessary to develop sustainable development indicators” (United Nations, 1993).
In other words, criteria and factors, together called sustainable development indicators, need to be developed in order to track how well the sustainable development goals are being met, to monitor the whole process, and to evaluate the effectiveness of the tools being used (Castaldi et al., 2009).
The indicators are used as rationale for the decisions that are being made, and using them with a quantitative assessment and simplification, they help interpret ongoing changes, pinpoint shortcomings in the implementation of the program, and provide access to information for different types of users. The indicators also help with the exchange of scientific and technological information.
The development of criteria and indicators for sustainable development is well on its way all around the world. Leading international organizations are involved in this effort: the United Nations, the World Bank, the Organization for Economic Development and Cooperation (OECD), the European Commission, the Scientific Committee on Problems of the Environment (SCOPE), among others. This issue is also actively discussed at various manager conferences and seminars.
Although the development of sustainable growth indicators is far from complete, already plans have been proposed for using the indicators for systems of various dimensions: global, regional, national, local, sector-based, even for individual municipalities or organizations (Swiss, 2005).
It is useful to highlight a few such projects:
-
1. system of sustainable development indicators, proposed by the United Nations Commission on Sustainable Development (CSD), composed of 132 indicators;
-
2. system for Integrated Environmental and Economic Accounting, proposed by the UN department of Statistics, and aimed at monitoring environmental factors in national statistics;
-
3. genuine savings indicator, developed and calculated by the World Bank;
-
4. program of environmental indicators developed by OECD.
The development of sustainable development indicators is a complex and expensive procedure which demands a large amount of information which is difficult, if not impossible, to obtain (Meadows et al., 2002). The number of factors which are included in the system makes the indicators impractical to use in many countries where there is a lack of statistical data. In this case an indicator is a factor (derived from primary source data which typically cannot be used directly for interpreting changes) which allows one to make a judgment about the status of economic, social or environmental variables (Sherrer, 2010).
Along with indicators, indices are also developed and used for similar purposes. An index is an aggregated or weighted indicator which is based on several other indicators or sets of data. Indices are used to flush out cause-effect relationships (Schaltegger and Burritt, 2000).
There are several models for indicator systems:
-
- simple indicators determine the overall amount, concentration, averages or proportions (ratios). Even though it is not very difficult to obtain them from available sources of information, they are not very useful because they need to be heavily interpreted before they are made applicable. For instance, most people do not understand whether the emission of 10 thousand tons of sulfur dioxide into the atmosphere is a little or a lot.
-
- Linking indicators are used when specialists are trying to determine the connection between economic activity and its social and environmental effects. These indicators include, for instance, the area of land used for production/manufacturing purposes. There are also the “distance-to-target” indicators, which express how much work still has to be covered before the locally set goals are reached. They are useful because they clearly express how much has been done, and how much is left to do. After this is known, priorities can be set more accurately.
-
- Ongoing feedback. The selection of indicators also reflects the level to which the society is in agreement on its goals. Ideally, the indicators that are selected should be closely related to the goals within a community. This concurrence process should be performed simultaneously be all interested parties (Gereffi, 2005).
There are specific requirements for using indicators. First of all, there's a need for transparency and clarity, since it's important to understand which data can be used to formulate an indicator. Often indicators merely name the issue at hand, without specifying which parameters can be used to make measurement in a specific locale.
Another requirement is the accessibility of data. It's self-evident why data needs to be sufficient and accessible, both from existing sources and from new ones. The costs of obtaining new data need to be comparable to the level of their expressiveness and interconnection with data that already exists. This does not mean that specialists should turn away from introducing new indicators simply because not all of the data is yet accessible. Instead, an interdisciplinary approach needs to be developed to include new data at subsequent stages of the process (Shaohua and Ravallion, 2010)..
Another important requirement is the completeness of data as it relates to sustainable development. Situations should be avoided where, as a result of a rapid decrease in the number of indicators, the sphere of applicability shrinks (Cattaneo et al., 2010). On the other hand, attention should be paid not only to the local and short-term aspects of the quality of life, but also to longterm sustainability, for instance, the protection of the environment.
Typically indicators describe events or conditions within the environment, and point to situations which are not directly observed. Future indicators are vital for many day-to-day decisions, but they, naturally, can be flawed and even with thorough preparation they will remain imperfect because the future is terra incognito.
Global experience in determining sustainable development indicators shows that there can be two approaches to building them (Yunus, 2007).
The first approach is to build a system of indicators where each reflects a specific aspect of sustainable development. Often, the following subsystem indicators are selected from the general system: environmental, economic, social, and institutional.
The second approach is to build an integral, aggregated indicator which will reflect the level of stability of socio-economic development. Aggregation is typically performed based on three groups of indicators: environmental-economic, environmental-socio-economic, and environmental (Cokins, 2009).
System of Indicators, developed by the United Nations Commission on Sustainable Development (UN CSD)
One of the comprehensive systems of sustainable development indicators was developed by US CSD. Indicators are broken down into several key groups:
-
1. indicators reflecting the social aspects of sustainable development
-
2. indicators reflecting the economic aspects of sustainable development
-
3. indicators reflecting the environmental aspects of social development (including characteristics of water, land, the atmosphere, other natural resources, and waste)
-
4. indicators reflecting the institutional aspects of sustainable development (programming and policy planning, scientific growth, international legal instruments, information technology and support, increased role played by main population groups).
The indicators proposed by the UN program call for special changes, adherence to specific requirements, and, in some cases, expansion for certain countries. The indicators are broken down into three categories based on their targets:
-
- indicators as a moving force which characterizes human activity, processes and qualities which affect sustainable development
-
- status indicators which describe the current state of various aspects of sustainable development
-
- reaction indicators, which reflect political or other type of reaction towards the status quo, in order to change it.
Among the many proposed options, the scheme “topic – subtopic – indicator” was preferred (UN, 2001). According to this system, for each sphere key topics are selected, which are then broken down into subtopics, which are in turn broken down into a minimal number of indicators. Emphasis is placed on the ability to make political decisions. So for example, in the economic sphere two topics have been established: economic structure and production-consumption. The economic structure comprises three sub-topics: business, trade, finance (Cohen, 2006). Productionconsumption comprises found sub-topics: consumption of material resources, energy consumption, waster formation and recycling, transportation. The list of indicators is short:
-
- GPD per capita
-
- investment share, % of GDP
-
- trade balance in goods and services
-
- debt share, % of IRR
-
- received or given assistance, % of GDP
-
- four indicators for material and energy output
-
- four waste indicators
-
- use of transportation
This list of basic indicators is given to countries for testing and preparing national programs.
The World Bank can be called the international leader for sustainable development indicators (WB, 2005). The bank's annual report titled The World Development Indicators helps assess a country's position on its way towards UN goals for economic growth and fight against poverty. These indicators are groups into six sections:
I. general
II. population
III. environmental
IV. economy
V. country
VI. markets
The key characteristics of the general section are used for determining specific indicators for all of the other sectors – population, land, and GDP. All indicators are shown starting from 1980, which helps analyze long-term global trends (World Economic Forum, 2013).
3. Examples of modeling
In order to analyze and compare the development of different countries, information from over 550 indicators is assessed. Based on the World Development Indicators, the World Bank has been annually issuing the Little Green Data Book from the year 2000.
System of Sustainable Development Indicators for Russia
The system of indicators (topic-subtopic-indicator) for Russia is presented in Table 6. There is a total of 42 indicators, of which the vast majority is calculated based on official statistical data, while a small portion is based on information from various agencies and one-time polls and assessments.
Integral sustainable development indicators
The issues of aggregating the different types of indicators into a single index was tackled in the UN-drafted Report on the Aggregation of Indicators for Sustainable Development., CSD, NY 2001. The major hurdle when combining information into an index lies in determining the weight of initial data without assigning it too much value or diminishing it. The more aggregation, the more complex the issue of accurately weighing individual pieces of data.
The Delphi Method, a multi-criteria analysis approach to weighing data, is used in the social sciences. The “distance-to-target” method uses target indicators which are stipulated by international or other legal documents. It is possible to obtain weighted coefficients using population polling (such as the euro-barometer, which reflects social preferences), or the Delphi Method, which is a group method where a board of specialists is surveyed. The survey is performed several times (this is the so-called multi-round polling process). After similar opinions begin to appear, the results are used as an assessment (Proskura et al., 2008). The indices developed by Eurostat have weights which reflect opinions of experts and key population groups.
Laws, international conventions and standards can be used to weigh indicators. Moreover, other criteria are used, including: the long-term or short-term aspect, global – regional – or local level of the issue, depth and complexity of the influence, extent of the irreversibility of the process, etc. In general, it is not recommended to use equal weights (World Economic Forum, 2013).
The stability of the index is also an important factor to consider, as it its affect on the end result of various indicators. The aggregation process must be fully transparent so that the user would have the opportunity to track the process of the transformation of the initial data into the indicator, and so that if necessary, he could work backwards to that initial data. A good understanding of what the index actually shows, and what its limits are, is also critical (Lund et al., 2013). The information aggregation process happens in the following sequence:
-
- at the first level the indicators for the selected issues are weighed in order to obtain an index for that issue
-
- at the second level intermediate indexes are weighed and indexes for the selected fields are determined
-
- at the third level, second-level indices are weighed in to obtain one final index.
It is possible to aggregate indicators up to the main aspects of development – the environmental, economic, social, and institutional. The environmental aspect joins air, lands, oceans, seas, coastal areas, clean water, and biodiversity. The economic aspect includes the economic environment, production, and consumption (Galbraith, 2012). The social aspect covers health, education, equality, housing, safety, and population. The institutional aspect includes the organization and capabilities of social institutions.
Several international organization play an active role in developing an aggregated index of sustainable development. The most successful such projects were undertaken by the UN and the World Bank. The availability of an aggregated index would allow decision-makers to assess the stability and the environmental developmental trajectory of a country. In this manner, it can be used as a unique type of GDP or GNP index, or an indicator of national income, which is often used nowadays to measure the success of economic growth and wellbeing in a given country. However, given the methodological and statistical issues and complexities of calculating such indicators, there is to-date no one integral indicator accepted world-wide today (Michaels et al., 2009).
Apart from the aforementioned indicators there is also the genuine (domestic) savings indicator, which was created by the World Bank. This indicator reflects the rate at which national savings are made after accounting for the depletion of natural resources and damage done to the environment. The concept of “genuine savings” is closely tied to the attempt to take a different approach on the measurement of a country's wealth. The World Bank has calculated the natural, production (physical and artificial), and social capital as well as its share in the totality of a country's national wealth. For example, the share of natural capital in national wealth for over 100 countries is anywhere from 2-40%, while the human capital share is from 40-80%. Moreover, in developed countries the natural capital share does not exceed 10% while the human capital share is over 70%. For many low-income countries, the unit weight of the agricultural component makes up 80%, while in high-income countries this indicator does not exceed 40%.
Currently, the genuine savings indicator has been calculated by World Bank specialists for over 100 countries, including Russia. These data are included in the Little Green Data Book 2006 (World Bank, 2005). But the depletion of mineral and forest resources is accounted for in only 2025% of all countries (typically small, developing nations).
The Human Development Index is a comprehensive indicator which evaluates the average achievements of a country based on three main areas of human development: longevity as a result of a healthy lifestyle, based on the expected life expectancy at birth; knowledge, based on the literacy level of the adult population and on the aggregated gross coefficient of those entering primary, secondary, and post-secondary institutions; and an acceptable quality of life as assessed by the GDP per capita in parity with purchasing power (PPP in USD). Let us call the Human Development Index a comprehensive indicator of human potential, while the indices for each element will be the fundamental indicators of human potential (Nielsen, 2013).
Before calculating the HDI itself, the indicators for each of its elements must be calculated separately. In order to calculate the indices for these elements (life expectancy, education, and GDP), each of these indicators should be assigned a minimum and maximum value. Achievement in each measurement is expressed in values from 0 to 1.
Element Long and healthy Ife Knowledge Good quality of ife
Indicator Life expectancy at Adult literacy Gross Per capita GDP birth level enrollment (PPP, in USD)
ratio I
1 r Gross enrollment ▼
Element Index Life expectancy Adult intlex GDP index index literacy level /
\ Education level index /
Human potential development index
Fig. 1 . Structure and composition of the Human Development Index
After this the HDI is calculated as the arithmetic average of the elements indices.
Table 1 . Threshold Values for HDI Calculations
|
Indicators |
Maximum value |
Minimum value |
|
Average life expectancy, years |
85 |
25 |
|
Literacy level of the adult population, % |
100 |
0 |
|
Aggregated gross coefficient of those entering an education institution, % |
100 |
0 |
|
Per capita GDP (PPP, USD.) |
40 000 |
100 |
When calculating the index for the estimated life expectancy, the indicator used is the forecasted average life expectancy at birth (expresses the number of years that on average a person is expected to life, given that the person is from a generation for whose entire duration the life expectancy of a child being born remains the same). For Russia, where in 2002 the life expectancy was 66.7 years, the index of the forecasted life expectancy equals .69.
Life Expectancy Index = 6^7 ^ = 0,69
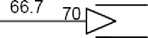
50 ______
Life expectancy
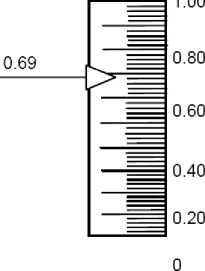
Life expectancy index
Fig. 2. Calculating Life Expectancy using the Example of Russia in 2002
The education index measures the relative achievements of countries in terms of raising the adult literacy levels and increasing the gross share of those entering primary, secondary, and postsecondary education institutions.
The GDP index is calculated using the corrected GDP per capita indicator (PPP in USD). The selection of the fundamental indicator must reflect the multiple factors which express the opportunities for the development and realization of human abilities: their personal approach; distribution of income between layers of society; access to land resources and credit, etc. The many difficulties encountered when calculating these indicators make it almost impossible to accurately assess the financial quality of life using a direct indicator. Therefore, in order to evaluate the financial quality of life indirect indicators are used, such as the GDP per capita value, which subsequently undergoes a series of modifications. The United Nations report for 2008 reveals that the HDI is growing in all countries around the world with the exception of countries in Africa and several countries in the post-Soviet space, where the index is falling because of the decreased quality of education, economics and high mortality rates. Russia takes 73rd place in the list, with its HDI = 0.806 (which is quite high, although it is lower than the indicators for Belorussia and Kazakhstan). The index began falling in the early 1990's as a result of a drop in the GDP and in spite in mortality rates. In 1992 Russia was in 52nd place, in 1995 it was in 114th place, in 2004 it was in 57th place, in 2005 - 62nd place, in 2006 – in 65th place with an index of 0.795, in 2007 – 67th place with an index of 0.802. According to the 2009 report, Russia is in 71st place, however based on the life expectancy index, Russia is in 118th place (66.2 years), based on the literacy level in 11th place (99.5%), and based on the financial well-being in 51st place, while for the per capital GDP it's in 55th place (PPP in USD). When compared to its neighbors on the table, Russia has an extremely low life expectancy and a slightly lowered level of education.
The “population health” indicator reflects the distribution of environmentally-affected illnesses. There is a solid relationship between the quality of the environment and respiratory diseases and digestive infections (Beall et al., 2012). Since children are the ones most severely affected by respiratory diseases, the child mortality indicator has been introduced to measure the mortality as a result of respiratory diseases according to the standard classification of illnesses per 100,000 children aged 1-14 years. The mortality indicator from digestive diseases in calculated for a country's general population.
4. Conclusions
The genuine progress indicator and the index of sustainable economic welfare are both attempts to create an adequate measurement of economic wellbeing, to improve the GDP by accounting for externalities. The genuine progress indicator reflects the following components:
-
- criminality and family breakdown
-
- household work and parenting
-
- income distribution
-
- resource depletion
-
- pollution
-
- long-term environmental damage
-
- changes in the amount of free time
-
- defense spending
-
- service life of articles intended for long-term use - dependence on foreign capital.
The index of genuine progress is meant to reflect those aspects of economics, which are outside of monetary turn-around. The attempt is made to determine those functions, which support the economy but remain outside of monetary usage. Indicator-based planning of the nation's economy has been used long and successfully abroad, for example in France, Japan, China and other nations.
Электронное научное издание «Устойчивое инновационное развитие: проектирование и управление»
том 18 № 3 (56), 2022, ст. 7
References Key performance indicators: economic and mathematical approach
- Beall, J., Guha-Khasnobis, B., Kanbur, R. (2012). Urbanization and Development in Asia. Multidimensional Perspectives. New York: Oxford University Press.
- Castaldi, C., and others (2009). Technological learning, policy regimes, and growth: the long-term patterns and some specificities of a “Globalized” economy. In Industrial Policy and Development: The Political Economy of Capabilities Accumulation, Mario Cimoli, Giovanni Dosi and Joseph Stiglitz, eds. Oxford: Oxford University Press.
- Cattaneo, O., Gereffi, G., Staritz, C. (2010). Global value chains in a postcrisis world: resilience, consolidation, and shifting end markets. In Global Value Chains in a Postcrisis World, Olivier Cattaneo, Gary Gereffi and Cornelia Staritz, eds. Washington, D.C.: World Bank.
- Cohen, B. (2006). Urbanization in developing countries: current trends, future projections, and key challenges for sustainability. Technology in Society, vol. 28, Nos. 1-2 (January-April), pp. 63-80.
- Cokins G. (2009). Performance Management - Integrating Strategy Execution, Methodologies, Risk, and Analytics. John Wiley & Sons, Inc. ISBN 978-0-470-44998-1
- Galbraith, J. K. (2012). Inequality and Instability: The Study of the World Economy Just before the Great Crisis. Oxford: Oxford University Press
- Gereffi, G. (2005). The global economy: organization, governance, and development. In The Handbook of Economic Sociology, Neil Smelser and Richard Swedberg, eds. Princeton, New Jersey: Princeton University Press.
- Lund, S., and others (2013). Financial globalization: retreat or reset?—global capital markets 2013. McKinsey Global Institute.
- Meadows, D. H., Randers, J., Meadows, D. (2002). Limits to Growth: The 30-Year Update. White River Junction, Vermont: Chelsa Green Publishing Company.
- Michaels, E., Handfield-Jones, H., Axelrod, B. (2009). The War for Talent. Mann, Ivanov and Ferber pub.
- Nielsen, P. A. (2013). Performance Management, Managerial Authority, and Public Service Performance. Journal of Public Administration Research and Theory. Published electronically on June 2. DOI:10.1093/jopart/mut025.
- Odiorne, G. S. (2005). Management by Objectives; a System of Managerial Leadership, New York: Pitman Pub
- Proskura, D. V., Rogova, E. M., Tkachenko, E. A. (2008). Theoretical Aspects of Forming Regional Cluster Policy // Problemy Sovremennoi Ekonomiki. vol. 4 (28). 287
- Rausch, P., Sheta, A., Ayesh, A., (Eds.). (2013) Business Intelligence and Performance Management: Theory, Systems, and Industrial Applications, Springer Verlag U.K., ISBN 978-1-4471-4865-4.
- Schaltegger, S., Burritt, R. (2000). Contemporary Environmental Accounting: Issues, Concepts and Practice. Sheffield, United Kingdom: Greenleaf Publishing
- Shaohua, C., Ravallion. M. (2010). The developing world is poorer than we thought, but no less successful in the fight against poverty. Quarterly Journal of Economics, vol. 25, No. 4, pp. 1577-1625.
- Sherrer, A. (2010). Deming’s 14 Points and Quality Project Leadership.
- Swiss, J. E. (2005). A framework for assessing incentives in results-based management. Public Administration Review 65:592–602.
- United Nations (1993). Report of the United Nations Conference on Environment and Development, Rio de Janeiro, 3-14 June 1992, vol. I, Resolutions Adopted by the Conference. Sales No. E.93.I.8 and corrigendum. Resolution I, annex I (Rio Declaration on Environment and Development). Resolution I, annex II (Agenda 21). Geneva, Switzerland. United Nations.
- United Nations (2001). Indicators of sustainable development: guidelines and methodologies. New York: United Nations
- United Nations. (2012). System Task Team on the Post-2015 UN Development Agenda Realizing the future we want for all: report to the Secretary-General. Available from http://www.un.org/millenniumgoals/pdf/Post_2015_UNTTreport.pdf.
- Vissema, H. (2000). Strategic Management and Entrepreneurship. Opportunities for Future Prosperity: translated from English. pub.
- World Bank (2005). World Development Report: Equity and Development. Washington, D.C. World Bank
- World Economic Forum (2013). The Green Investment Report: The Ways and Means to Unlock Private Finance for Green Growth—A Report of the Green Growth Action Alliance. Geneva.
- Yunus, M. (2007). Creating a World without Poverty: Social Business and the Future of Capitalism. New York: PublicAffairs.
