Квазипериодические пульсации в солнечных и звездных вспышках. Обзор

Автор: Куприянова Е.Г., Колотков Д.Ю., Накаряков В.М., Кауфман А.С.
Журнал: Солнечно-земная физика @solnechno-zemnaya-fizika
Статья в выпуске: 1 т.6, 2020 года.
Бесплатный доступ
В статье представлен обзор современного состояния исследований колебательных процессов в солнечных и звездных вспышках, основанных на наблюдательных данных наземных и космических инструментов с высоким временны́м, пространственным и спектральным разрешением в разных диапазонах электромагнитного спектра. Рассматриваются механизмы генерации вспышечного излучения и его квазипериодической модуляции. Обсуждаются сходство и различие солнечных и звездных вспышек, а также связанные с этим проблемы супервспышек на Солнце и космической погоды. Показано, что квазипериодические пульсации (КПП) вспышечного излучения являются эффективным инструментом диагностики как самих вспышечных процессов, так и параметров тепловой плазмы и ускоренных частиц. Рассматриваются виды КПП, их статистические свойства и методы анализа с учетом нестационарности параметров КПП. Сделан обзор предполагаемых механизмов КПП и открытых вопросов.
Солнце, солнечная активность, солнечные вспышки, звездные вспышки, квазипериодические пульсации
Короткий адрес: https://sciup.org/142224285
IDR: 142224285 | УДК: 523.985.3 | DOI: 10.12737/szf-61202001
Quasi-periodic pulsations in solar and stellar flares. Review
This paper provides an overview of the state-of-the-art studies of oscillatory processes in solar and stellar flares, based on modern observational data from ground-based and space-borne instruments with high temporal, spatial, and spectral resolution in different electromagnetic spectrum ranges. We examine the mechanisms that generate flare emission and its quasi-periodic modulation. We discuss similarities and differences between solar and stellar flares, and address associated problems of superflares on the Sun and space weather problems. Quasi-periodic pulsations (QPPs) of flare radiation are shown to be an effective tool for diagnosing both the flare processes themselves and the parameters of flare plasma and accelerated particles. We consider types of QPPs, their statistical properties, and methods of analysis, taking into account the non-stationarity of the QPPs’ parameters. We review the proposed mechanisms of QPPs and address open questions.
Текст научной статьи Квазипериодические пульсации в солнечных и звездных вспышках. Обзор
Study of the Sun can answer many questions relating to solar-terrestrial and stellar physics. Physical processes occurring on the Sun are of interest for understanding and predicting the interaction of solar plasma with Earth’s atmosphere and magnetic field, which is essential for understanding Earth’s climate and space weather. Furthermore, the Sun can be considered as the natural plasma laboratory. Plasma is an ionized gas, and its behavior is largely determined by the electromagnetic interaction between free electrons and ions. More than 99.9 % of the visible Universe is made of plasma, so its study is of great interest for modern physics. For example, the study of plasma is important for solving the problems of clean and nearly inexhaustible energy of the future because the plasma is a working body in controlled thermonuclear reactors.
Along with such relatively steady processes as thermal emission, in particular in the visible band, coming from the solar surface, and plasma outflow in the form of the solar wind filling most of the solar system, sporadic impulsive energy releases such as flares and coronal mass ejections (CMEs) occur on the Sun. The characteristic duration of these processes is from several seconds to several hours. The released energy reaches 1033 erg, i.e. it is equivalent to the energy of simultaneous explosion of two billion atomic bombs detonated over Hiroshima, which makes flares and CME the most powerful physical processes in the solar system. In this case, the energy release is caused not by nuclear reactions but by conversion of the magnetic field energy into other forms of energy — thermal and kinetic (including acceleration of charged particles and generation of plasma flows). Accelerated particles are associated with the occurrence of emission of different wavelengths — from long-wavelength to hard X-rays and γ-rays.
Late-type stars such as red dwarfs are also known for their flare activity. At the same time, the identity of the physical mechanisms responsible for the impulsive energy releases on flaring stars and on the Sun has not been conclusively established. High-precision observations of solar-type stars show the presence of flare activity in them too. Moreover, in some cases, the stars exhibited superflares with energies up to 1038 erg, which far exceed the energy of the most powerful solar flares. Detection of superflares on stars raises questions about the possibility and probability of the occurrence of a superflare on the Sun and its consequences for our civilization.
Despite the obvious importance and intensive research, there is still no complete understanding of the physical processes that lead to the impulsive energy releases. Difficulties in the research are due not only to the multiscale and nonlinear nature of flares, but also to the lack of high-precision and multi-wavelength observations. In addition, difficulties arise in the diagnostics of plasma and magnetic field parameters in flare regions as well as in the development and implementation of specific methods, which enable us to choose the models that best describe the observations.
In recent years, a significant progress has been achieved in understanding the importance of oscillatory quasi-periodic phenomena in solar flares. The fact that the quasi-periodic phenomena, commonly referred to as quasi-periodic pulsations (QPPs), are observed in most flare events suggests the need for taking them into account when constructing a solar flare model. In this paper, we offer a detailed overview of the current state of the experimental study of QPPs in solar and stellar flares and their theoretical modeling.
This report was presented at the International Workshop “Eruptive energy release processes on the Sun and stars: origins and effects”. October 10–12, 2018. Institute of Solar-Terrestrial Physics SB RAS, Irkutsk, Russia
2. WHAT ARE SOLARAND STELLAR FLARES? 2.1. Observations and phenomenology of solar flares
Solar flare emission is observed throughout the electromagnetic spectrum — from low-frequency radio waves to high-energy y- rays. We begin with defining different wavelength bands, which are discussed in the review (in order of descending wavelength). We also note that boundaries of these bands are rather approximate, and in the border regions the separation into the bands depends on the mechanism of emission (see Subsection 2.3 for more detail). The solar flare radio emission is recorded with ground-based telescopes from decametric to millimeter (mm) and submillimeter (sub-mm) wavelengths. The radio frequency band from tens of centimeters to several millimeters is often considered separately, and the emission with such wavelengths is called microwave. Recently (in terms of solar flare observing facilities), an interest has also arisen in the so-called terahertz (THz) and sub-terahertz (sub-THz) radio bands. In terms of wavelength, these ranges are also referred to as submillimeter and millimeter, X ® 0.1-8 mm. In longer wavelengths, they adjoin the microwave band; and in their short-wavelength, the infrared (IR) band (X ® 0.74 200 цт). The optical continuum ranges from the Balmer discontinuity (X=3646 A) to the near IR band (X ~ 7400 A). In the ultraviolet (UV) emission band (X ® 100-3000 A) is an extreme ultraviolet (EUV) subband with the wavelength X ® 100-1210 A. The X-ray emission is commonly determined using energy values in electronvolts (eV). Planck’s law for black body emission allows us to convert these values to wavelengths: Xa ® 12400/ EeV, where Xa is the wavelength in A, E eV is the photon energy in eV. The soft X-ray (SXR) emission with energies from 10 eV to 10-15 keV corresponds to X ® 0.84-124 A. Wavelengths of the hard X-ray (HXR) emission with energies 15–250 keV are within X ® 0.05-0.84 A. The highest-energy (and shortest-wavelength) y- ray band with energies above 100 keV overlaps with the HXR emission band (X < 0.1 A).
Solar flares occur in the solar atmosphere, mainly in active regions, but sometimes also between them. The active regions are located above the regions of enhanced magnetic flux, generally multipolar, on the solar surface. At the level of the visible solar surface, these regions often contain a sunspot, pore or their ensemble (Figure 1).
Data on the magnetic field can now be obtained using, in particular, observations from the Helioseismic and Magnetic Imager (HMI) on board the Solar Dynamics Observatory (SDO) [Scherrer et al., 2012] . In the sunspot, the magnetic field is as strong as several thousand gauss. In the pore, it is weaker — one-two thousand gauss. The magnetic field extending into the upper part of the solar atmosphere — the corona — fills the entire available volume and results in plasma structuring, forming loop structures directed along magnetic field lines. Their typical diameters are tens to hundreds of thousands of kilometers; and small radii (cross-section radii) are around several thousands of kilometers.
Both in EUV and SXR bands, coronal loops are observed as bright arcades (see two right panels in Figure 1; to illustrate the arcades we have used EUV data from the Atmospheric Imaging Assembly (AIA) on board SDO and SXR data from the Hinode satellite [Golub et al., 2007] ). The magnetic field in the coronal part of active regions is from several units to several hundreds of gauss. The behavior of the plasma over active regions is largely determined by the magnetic pressure. In particular, the parameter P, which is the ratio of gas pressure to magnetic pressure, is an important parameter of plasma systems. Over active regions, the parameter P is usually not greater than 0.2 [Shibasaki, 2001; Wang et al., 2007] .
A standard solar flare begins with a sudden increase in brightness of individual loops in the EUV band in an active region. In radio and HXR bands at this time, there is a sharp, up to several orders of magnitude, increase in the radiant flux — the so-called flare impulsive phase. Sources of the HXR emission are generally localized in the chromosphere, two sources located on opposite sides of the neutral line on the solar surface (see the schematic sketch of a solar flare in Figure 2) in regions with opposite magnetic polarity. The relative area of the HXR-emission sources is the tenth or the hundredth of one percent of the total area of the solar surface. A similar morphology is usually also observed in the range of Hα, which is associated with the emission of the ionized hydrogen in the chromosphere.
In rare cases, in the vicinity of the HXR-emission sources there are white-light and y- ray brightenings. The sources of the HXR emission and white light sometimes
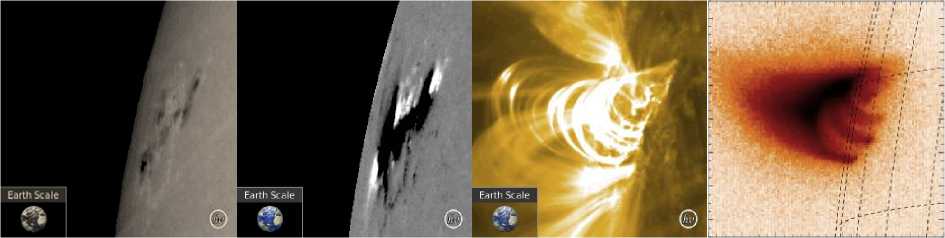
Figure 1. Images of an active region with flare loops during the decay phase of the solar flare SOL2013-05-14 at 04:20:00 UT in different wavelengths (left to right): sunspots on the photosphere (SDO/AIA 4500 Å), magnetogram (SDO/HMI), EUV emission (SDO/AIA 171 Å), and SXR emission (Hinode) at 02:26:34 UT. SDO images were produced using the website [], SXR data was obtained from the Internet Archive []
coincide with the emission sources in the mid-IR band [Penn et al., 2016] . In some cases, there is a third source of HXR emission near the top of a flare loop. In energetic flares, conjugate sources of HXR emission are often observed which travel along the neutral line with typical velocities of several tens of kilometers per second [Bogachev et al., 2005; Reva et al., 2015] . In this case, the ensemble of the chromospheric HXR and Hα emission sources forms a structure with two locally parallel ribbons extending on either side of the neutral line at a distance of several tens of thousands of kilometers from each other. Such flares are called two-ribbon flares. An arcade of coronal loops connects the chromospheric ribbons (the characteristic height is also several tens of thousands of kilometers). Sources of microwave radio emission are observed in a flare loop, whereas bursts of longer-wavelength radio emission are recorded at a higher level, above the active region. Dynamic spectra of the flare-induced radio emission contain various fine structures called radio bursts. The flare impulsive phase usually lasts from several tens of seconds to several minutes [Benz, 2017] .
A longer, up to several hours, the flare phase is that of enhanced brightness of the flare region in EUV and SXR. The maximum brightness in these bands is generally observed at the end of the impulsive phase. Curiously, during the phase of rising emission the time derivative of the increasing brightness of SXR emission resembles the signal recorded in the radio and HXR ranges (for more detail see Subsection 2.3). This phenomenon is called the Neupert effect [Neupert, 1968]. Sources of EUV and SXR emission often have the form of loop or cusp (Figure 1). After reaching the maximum, the EUV and SXR emission from the flare region de- creases slowly and smoothly. This period lasting from several tens of minutes to several hours is called the decay phase.
The described picture is averaged, and the specific manifestations of a particular flare in different observational wave bands may differ significantly from this scenario. In particular, there are sometimes cold flares with a negligible increase in the SXR emission [Fleishman et al., 2011; Masuda et al., 2013; Lysenko et al., 2018] , as well as radio-quiet flares followed by weak radio emission [Benz et al., 2007] . Another deviation from this generalized scenario is the above mentioned quasi-periodic variations in flare emission fluxes recorded at all phases in all observational wave bands.
There are several systems for classification of solar flares. The currently widely used system is based on the SXR emission intensity in the 1-8 A band. Flares with an intensity higher than 10–4 W/m2 correspond to class X; from 10–5 to 10–4 W/m2, to class M; from 10–6 to 10–5 W/m2, to class C; and from 10–7 to 10–6 W/m2, to class B. B-class flares are often referred to as microflares. Other classifications rely on the relative area and brightness of Hα ribbons and on the peak value of radio emission at a frequency of 5 GHz. More information on solar flares is given in [Benz, 2017] .
2.2. Standard model of a solar flare
The standard model of a solar flare (also known as the Carmichael, Sturrock, Hirayama, Kopp-Pneuman model, CSHKP-model) based on the observational properties described above is schematically shown in Figure 2 (see also Figure 22 and the corresponding web link in
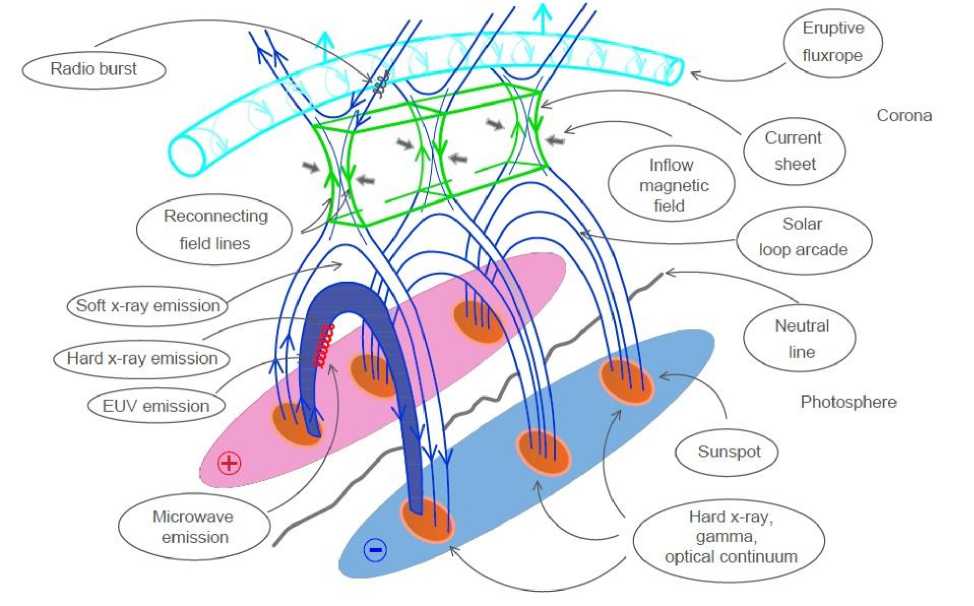
Figure 2. Standard model of a solar flare
[Hudson, 2016] , which represents the Flare Cartoon Archive of all similar schematic illustrations of a solar flare, published in the literature from 1948 to 2012). In this Section, we briefly describe the CSHKP-model, addressing the main physical mechanisms and processes.
At the initial (pre-flare) stage, the energy of the magnetic field, which is the main source of energy release in flares, is accumulated in active regions of the corona as a nonpotential field. Such magnetic configuration is unstable with respect to an arbitrarily small perturbation of plasma parameters, whereby fast magnetic reconnection is initiated, for example, in the current sheet formed after the destabilized emerging plasmoid (eruptive rope), which leads to a rapid release of free magnetic energy. The reconnecting current sheet is generally oriented perpendicularly to the solar surface, in much the same way as the tail of Earth’s magnetosphere. The released magnetic energy is subsequently converted into the internal (thermal) plasma energy, the kinetic energy of collective plasma flows such as Alfvén jets or plasmoids, and into acceleration of nonthermal population of charged particles up to peak energies from ~15– 20 keV to tens of MeV. Although the particle acceleration during the magnetic reconnection is still not fully understood, it is associated with the sharp increase in the nonthermal emission of active regions: HXR, gamma, and radio emission, as well as emission caused by electron beams, and, possibly, emission in the optical continuum (a more detailed comparison between thermal and nonthermal emissions from solar flares is made in Subsection 2.3). Accelerated charged particles move along magnetic field lines, generating gyrosynchrotron emission in microwaves. Electrons with energies 10– 100 keV, moving toward the solar surface, precipitate into a denser plasma of the chromosphere, which is the so-called thick target for them, where they lose all kinetic energy and generate electromagnetic HXR emission (Figure 3). Accelerated protons and relativistic electrons with energies greater than 100 keV can probably penetrate deeper down to the lower chromosphere and photosphere, generating gamma-rays (due to nuclear processes such as neutron capture, positron annihilation), and in white light (see the discussion of the formation mechanisms of emission in the optical band in the context of solar and stellar flares respectively, for example, [Heinzel, Kleint, 2014; Heinzel, Shibata, 2018] ). As the number of particles moving with relativistic speeds is usually small, solar flares in γ -rays are rarely observed. Perhaps for the same reason, white-light flares are also rare. A contrary statement has, however, been made [Kretzschmar, 2011] that white-light flares accompany most (if not all) solar flares including weak C-class flares.
As a result of bombardment by fast particles, dense plasma of the chromosphere heats up to tens of millions of Kelvin and evaporates upward, to the corona, whereby coronal magnetic loops are filled with hot plasma being in thermal equilibrium (hereinafter we call it thermal plasma). At this stage, we can see the occurrence of bright post-flare coronal loops emitting in soft X-rays (Figure 1). In turn, nonthermal electrons moving upward
AIA171_THIN29-Mor-14 18:24:12.340
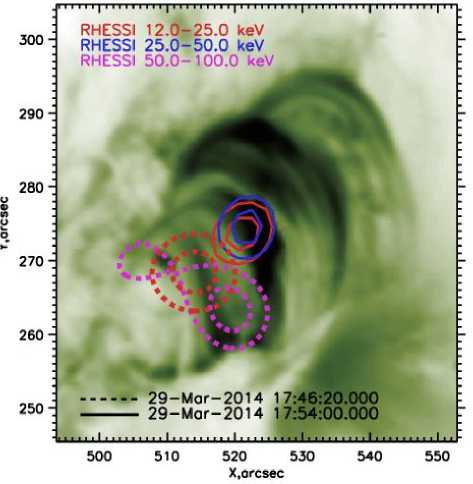
Figure3. Contours of HXR- and SXR-emission sources during the impulsive phase (dashed lines) and decay phase (solid lines) imposed on EUV images from SDO/AIA 171 Å from the region of the initial acceleration interact with the ambient thermal plasma, thus leading to the formation of radio bursts of different types [Mészárosová et al., 2009].
This standard model describes flares in the zeroorder approximation since it ignores, in particular, the 3D structure of the regions of the most powerful energy releases (see the discussion of properties of two-ribbon flares in Subsection 2.1). An attempt to summarize the standard model of a solar flare in terms of 3D effects has been made, for example, in [Aulanier et al., 2012] .
2.3. Thermal and nonthermal emission: generation mechanisms, observations, diagnostics
The nature of the emission of a flaring plasma is mainly determined by the distribution over charged particles generating it over speeds and energies. To describe the particle distribution, different functions are used such as the Maxwell — Boltzmann distribution, power-law function, κ and η distributions.
The electrons with the Maxwellian speed distribution, i.e. being in a thermal equilibrium, are associated with the so-called thermal emission. The thermal emission is mainly generated due to the free-free (thermal bremsstrahlung) mechanism. More specifically, the kinetic energy lost by thermal free electrons during Coulomb collisions with free plasma electrons and ions transforms into plasma heating and emission energy. For the thermal free-free emission in SXR to be significant (detectable), electrons must have a sufficiently high energy — above 0.1 keV (which corresponds to a temperature of 1.2 MK).
The free-free mechanism is also one of the main mechanisms in generating the HXR emission. However, since the energy of most electrons generating emission in this spectral band is determined by processes of ac- celeration, and their distribution by speeds (e.g., the power-law distribution) differs from the Maxwell — Boltzmann distribution, the shape of the HXR-emission spectrum differs from that of the SXR-emission spectrum. Such electrons are called nonthermal; and their emission is nonthermal. In most cases, the emission in the range above 25–30 keV has a nonthermal nature.
Thus, the SXR emission with energies below 10 keV is most often associated with thermal processes; the HXR emission with energies above 30 keV, with nonthermal processes. In the transition interval 10–30 keV, thermal and nonthermal particles make a comparable contribution to the emission. In order to reliably separate thermal and nonthermal components, X-ray spectra should be fitted using at least two functions of electron distribution by speeds — Maxwell — Boltzmann and power-law [Hudson et al., 1978; Holman et al., 2003] .
Note that such a distinction between thermal and nonthermal X-ray components is not strict and universal. On the one hand, in some cases the electrons with speed distribution different from the Maxwellian one (e.g., κ and η distribution [Battaglia et al., 2015; Dudik et al., 2011] ) may contribute to the X-ray region up to 20 keV. On the other hand, very hot thermal plasma can affect the emission with energies 25–30 keV and higher [Caspi et al., 2010; Kashapova et al., 2013] .
The most common method of diagnosing thermal processes in plasma of solar flares is currently based on the analysis of the light curves of SXR emission obtained by GOES (Geostationary Operational Environmental Satellite) in 1–8 Å (1.5–12 keV) and 0.5–4 Å (3–25 keV). To study the nonthermal emission, data is widely used from Russian and foreign satellites such as Konus-Wind [Aptekar et al., 1995] , Solar Neutron and Gamma rays (SONG) on board Complex ORbital Observations in Near-Earth space of the Activity of the Sun (CORONAS-F) [Kuznetsov et al., 2002] . For a long time, Reuven Ramaty High-Energy Solar Spectroscopic Imager (RHESSI) was employed to study space-time and spectral characteristics of X-rays [Lin et al., 2002] .
The emission in the standard EUV bands, used for solar observations, results from direct heating or cooling of hot plasma. In most cases, this emission is of thermal origin. A more reliable indicator of thermal or nonthermal origin of the emission in this spectral band is still, however, X-rays (see above). The optical (4500 A), UV (1600 A, 1700 A), and EUV (304 A) emissions, observed by SDO/AIA, are formed at levels of the temperature minimum and chromosphere and also need analyzing preliminarily by observing in X-rays. A number of studies have fitted X-ray and EUV-emission spectra derived from RHESSI and SDO/AIA data, thus covering a wider rangeof energies — from 0.1 keV to several tens of keV [Battaglia et al., 2015] .
One of the mechanisms for generating the microwave emission of solar flares is gyrosynchrotron (GS) mechanism (see also Figure 5 and the description of observation features of GS and other mechanisms of emission in the microwave band in [ /norh/doc/]). The shape of the microwave GS spectrum allows us to iden- tify regions of optically thin and optically thick emissions from the spectral peak frequency. The source of emission at frequencies above the spectral peak frequency is optically thin. The negative spectrum slope in this region obeys the power law and is determined by the energy distribution of accelerated electron. The emission at frequencies bellow the spectral peak frequency is also related to accelerated electrons. The source of the emission at these frequencies is, however, optically thick, and therefore the emission comes only from the external source region. The positive GS-spectrum slope in a low-frequency region is defined by self-absorption, which causes the spectrum intensity to decrease with decreasing frequency.
Information on the spectrum, temporal and spatial structure of microwave emission can currently be gained with such instruments as the Siberian Radioheliograph-48 (SRH-48, solar images at five frequencies in the 4–8 GHz band) [Lesovoi et al., 2017] developed from the Siberian Solar Radio Telescope (SSRT), and the Siberian Radio Spectropolarimeter (SRS, 4–8 GHz and 2–24 GHz) located in the ISTP SB RAS Radioastrophysical Observatory (the urochishche of Badary) [Zhdanov, Zandanov, 2015] , the radioheliograph (NoRH, images at 17 GHz and 34 GHz) and radio polarimeters (NoRP, 1–80 GHz) of the Nobeyama Observatory [Nakajima et al., 1980, 1985] , the Academy of Sciences Radio Telescope (RATAN-600, 0.610–35 GHz, the stanitsa of Zelenchukskaya) [Khaikin et al., 1972] , telescopes of the Radio Solar Telescope Network (RSTN).
Note that in the microwave band the gyrosynchrotron and synchrotron emission intensity in solar flares depends on the magnetic field strength, coronal plasma density (when observed at low frequencies), and on the spectrum index, pitch angle, and density of nonthermal electrons [Dulk, Marsh, 1982] . The Neupert effect described in Subsection 2.1 relates the light curves of flare signals in SXR and HXR (and microwaves), and hence profiles of thermal and nonthermal emissions, and is, in fact, an indicator of the direct connection between electron acceleration leading to the HXR and microwave emissions and plasma heating emitting in SXR.
At the end of this section, we call attention to the boundary wave bands of IR, submillimeter, and millimeter emission, in which studies have been carried out mainly to refine models of temperature distribution in the chromosphere [see, e.g., Loukitcheva et al., 2004] . The first observations of solar flares at submillimeter wavelengths were made in 1984 [Kaufmann et al., 1986] . Since 2000, regular observations have been made with the Solar Submillimeter Telescope (SST) in the sub-mm and mm bands. The first data on solar flares in the IR continuum was obtained later, in 2003 [Xu et al., 2004] . In the past two decades, the popularity and significance of observations in these ranges increased dramatically in connection with the commissioning of a new system of telescopes — the Atacama Large Millimeter Array (ALMA) [Wedemeyer et al., 2016] . Modeling and observation of the IR-continuum emission indicate that it is thermal free-free and is caused by free-free collisions of chromospheric ions [Heinzel, Avrett, 2012; Trottet et al.,
2015; Simões et al., 2015] . Mechanisms of the sub-mm and mm emission are not completely understood. The emission during the flare impulsive phase was interpreted through the inverse Compton scattering [Kaufmann et al., 1986] , direct Cerenkov radiation of electrons accelerated in the chromosphere [Fleishman, Kontar, 2010] , and the coherent plasma mechanism [Sakai et al., 2006; Zaitsev et al., 2014, 2016] . If we consider the sub-mm and mm bands as a continuation of the microwaves, the spectrum becomes N-shaped, i.e. after the typical flux decay from the spectral peak frequency toward higher frequencies the spectrum slope becomes positive again in the sub-THz region. On the one hand, such behavior of the spectrum was interpreted as the GS emission of electrons with an energy of over 300 keV [Tsap et al., 2018] or as the GS emission from a compact source with a dense plasma under conditions of which an important role in forming the spectrum is played by the Razin effect [Silva et al., 2007] . On the other hand, the positive slope of the spectrum can be explained by the thermal free-free emission of hot plasma of flare ribbons with a temperature of 104–106 K [Kontar et al., 2018] .
2.4. What is the difference between observations of solar and stellar flares?
Much as solar flares are the most powerful impulsive energy releases in the Solar System, flares on active stars of spectral class M (red dwarfs) and solar-type stars represent one of the highest-energy processes in their systems. Detection of such events requires extensive sky surveys or long-term observation of an individual star. The detected energy of stellar flares is comparable or often considerably higher than energies of the most powerful solar flares, whereas the spectral ranges in which the stellar flares are seen are wide enough — from radio waves (recorded, for example, by RATAN-600 and other radio telescopes) and optical region (Kepler and Transiting Exoplanet Survey Satellite (TESS), as well as the ground-based network of telescopes the Next-Generation Transit Survey) to ultraviolet (Galaxy Evolution Explorer, GALEX) and X-rays (XMM-Newton). The importance of the study of these events is due to, at least, two reasons: firstly, the impact of their high-energy emission on potential habitable zones of corresponding exoplanetary systems, namely, their role in ozone depletion and dissipation of planetary atmospheres, as well as on the formation of organic compounds (see [Armstrong et al., 2016] and references therein); secondly, the assessment of the probability of such events on the Sun and their impact on space weather and life on Earth.
When observed in white light, solar and stellar flares are usually associated with the amplification of integral flux in the optical continuum from the Balmer discontinuity to the near infrared band. The intensity of the white-light flux in stellar flares usually varies from a few percent to several tens of percent of stellar magnitude in solar-type stars [Maehara et al., 2015] and by orders of magnitude in red dwarfs [Gershberg, 2005]. The most extreme stellar flares can change the stellar magnitude by orders of magnitude for several hours. Moreover, the most powerful events occurring on a rela- tively faint star with usual luminosity beyond the sensitivity of an observational instrument can make it visible during the flare. In turn, on the Sun white-light flares increase its total luminosity only slightly (~0.01%). This feature of white-light solar flares along with their relatively short duration (less than a few minutes) complicates their detection. Numerous attempts have been made to detect the increasing spectral power in the optical region in solar flares. For example, several recent studies (see [Kotrč et al., 2016] on ground-based and [Heinzel, Kleint, 2014] space-borne spectrographic observations) reported short-term localized increases in the spectral flux in the optical continuum up to 500 % coinciding in time and position with flux increases in other spectral bands. Estimated variation in the full brightness of the Sun with time in these events shows an increase in the intensity of the optical flux by ~0.1–0.5 %. On the other hand, in a large portion of spectrally resolved observations of solar flares, the enhancement of spectral power was much weaker [Lin, Hudson, 1976] or was not detected at all [Švestka, 1966]. Thus, observations of solar flares in white light give rather contradictory results. It remains unclear whether the mechanisms of the formation of solar and stellar flares coincide or not and as a result whether stellar observations can be scaled down to characteristic values of solar flares or not. For example, the maximum expected flare energy was estimated as a function of active region (starspot) size in [Aulanier, 2013, Figure 4].
A huge distance of objects from ground-based and space-borne instruments leads to the fact that stellar flares are detected as a short-term increase in the total brightness of the entire visible disk of the star in certain electromagnetic band. Spatially-resolved observations of solar flares compare favorably in this respect, allowing us not only to study integral light curves of the flares, but also to localize emission sources and to determine the geometry of the flare region (see the description of two-ribbon flares in Subsection 2.1). Note that in addition to routine observations of solar coronal structures in shortwave bands cold dim post-flare off-limb loops are also observed in white light [Saint-Hilaire et al., 2014] . Heinzel, Shibata [2018] have used one of these whitelight observations to assess the contribution of the loop optical emission to the total luminosity of stellar flares. Thus, the presence of spatial information is crucial for the correct interpretation of physical mechanisms of the flare and parallel running processes (see Section 5).
2.5. Superflares
The most powerful solar flare ever recorded is the so-called Carrington flare [Carrington, 1859] with a total energy of ~1032 erg. Among ordinary stellar flares are much more powerful flares — the so-called superflares with a total energy of over 1033 erg, which is by orders of magnitude higher than the energy of all solar flares observed. Typical stars producing flares are considered to be M-class red dwarfs. Nevertheless, the spacecraft Kepler has recorded more than 1500 superflares with a total energy of 1033–1036 erg on G-class, i.e. solar-type, stars [Shibayama et al., 2013]. While the number of stars that produce superflares is only ~0.1 % of all the stars studied [Maehara et al., 2012], the question arises about the probability of the occurrence of a superflare on the Sun. Shibayama et al. [2013] have found an empirical relationship between the occurrence rate N of stellar flares and their energy E, which is described by the power-law function dN/dE ∝ E –α, α ≈ 2. Statistical studies show a similar relationship in the occurrence of solar flares. A comparison of the statistical results for solar and stellar flares allows us to estimate the mean occurrence rate of solar flares with an energy of about 1034–1035 erg (i.e. 100–1000 times more powerful than the Carrington flare) as one event in 800–5000 years [Shibayama et al., 2013].
The question about the occurrence of a superflare on the Sun becomes more urgent if we take into account that solar and stellar flares have similar scenarios, as much has been discussed in the monograph [Gershberg, 2005] . Moreover, decaying quasi-periodic pulsations similar to pulsations in solar flares have recently been identified in many superflares [Pugh et al., 2015] . After examining 59 solar and 52 stellar flares, Cho et al. [2016] have established that the time of QPP decay in solar and stellar flares is related to the oscillation period according to the same law, namely, the characteristic decay time depends linearly on the oscillation period. This is indirect evidence for the similarity between the physical mechanisms responsible for solar flares and stellar superflares.
On the other hand, the analysis of photometric measurements of luminosity of late-type stars has shown that spots on stars can be by orders of magnitude larger than sunspots in area and magnetic field strength [Gershberg, 2005] , hence stellar coronae contain much more energy that is eventually realized in flares than the solar corona. Moreover, the stars producing superflares may differ qualitatively from the Sun [Katsova et al., 2018] . The modeling of the dynamo mechanism has revealed that when the alpha-effect has a sign opposite to the solar one there should be a sharp increase in magnetic activity of stars [Kitchatinov, Olemskoy, 2016] .
2.6. Effect of flares on Earth’s magnetosphere and upper atmosphere
Solar flares and coronal mass ejections have a significant impact on near-Earth space, i.e. on space weather, and thereby on health of astronauts and crews and passengers of high-altitude aircraft, on the operation of spacecraft, and energy, communication and navigation systems, in particular GPS (Global Positioning System) and GLONASS (Russian GLObal Orbiting Navigation Satellite System). For example, the aforementioned Carrington flare in 1859 generated a global geomagnetic disturbance and led to the malfunction of the telegraph, and the March 13–14, 1989 geomagnetic storm, triggered by the X4.5-class solar flare, led to the large-scale power failure in the Canadian province of Quebec (Quebec event). The flux of energetic particles generated by solar flares causes induced currents in electrical circuits, especially at high latitudes, where the magnetosphere protects Earth against the impact of cosmic rays less efficiently [Gurevich, 2016]. Most recently, in September 2017, the most powerful flares of solar cycle 24 caused the failure of high-frequency communication lines, affecting efforts to render aid to the islands off the coast of America affected by Hurricane Irma [Frissell et al., 2019].
Hayes et al. [2017] have found a relationship between electron density pulsations with a characteristic period of ~20 min in the ionospheric D layer and QPPs in the solar flare emission in X-rays and EUV. Earth’s ionosphere has been shown to be more sensitive to small-scale variations of the solar SXR emission flux than thought. The close relationship between processes in Earth’s ionosphere and small-scale changes in solar activity has thus been confirmed.
3. QUASI-PERIODICPULSATIONS
As mentioned above, solar flares exhibit repetitive variations of emission fluxes such as those approximately resembling a harmonic function. It is, however, obvious that in solar flare observations it is impossible to find pure harmonic signals, even if they are present. The instrumental noise, the effect of Earth’s ionosphere, and the complex nature of solar phenomena lead to the fact that in practice we deal with such deviations from the harmonic signal as trends of all kinds, noises of different nature, modulation of signal amplitude and frequency both stochastic and determined by a specific physical process (or processes), signals in the form of wave trains. All these deviations make the observed oscillatory signal not purely periodic, but quasi-periodic. These emission variations are called quasi-periodic pulsations (QPPs). Moreover, some mechanisms (see Section 5) result in repetitive nonharmonic or significantly modulated signals, for example in the form of an exponentially decaying sinusoid.
3.1. Statistical properties of QPPs
QPPs are present in the emission throughout the electromagnetic spectrum, from radio waves to gamma-rays [Kane et al., 1983; Nakajima et al., 1983; Nakariakov et al., 2010a; Kupriyanova et al., 2010; Dolla et al., 2012; Su et al., 2012; Simões et al., 2015; Inglis et al., 2016] . By analyzing properties of a signal in different wave bands, namely its amplitude, frequency, and phase characteristics, we can reveal the nature of QPPs [McLaughlin et al., 2018; Van Doorsselaere et al., 2016; Nakariakov, Melnikov, 2009] (see Figure 4 and Section 5).
Statistical studies have shown that QPPs are present both in nonthermal [Kupriyanova et al., 2010] and in thermal [Simões et al., 2015] emission of more than 80 % of solar flares examined. The fact that QPPs represent a frequent or perhaps even intrinsic feature of the flare energy releases stimulates interest in observational detection of this phenomenon and in its theoretical modeling. In particular, it has been understood that QPPs should be built in the standard model of a solar flare, which will undoubtedly increase the reliability of the prediction of extreme space weather events, as well as will allow us to advance our understanding of the fundamental processes of plasma astrophysics such as magnetic reconnection and charged particle acceleration.
Typical periods of the observed QPPs vary from fractions of a second to tens of minutes. Such periods are associated with the physical processes generating QPPs, but we should also take into account peculiarities of observational procedures. On the one hand, the time resolution of a number of astronomical instruments impedes the identification of the characteristic periods shorter than a few seconds. Instruments observing in the radio band have the highest time resolution: solar images can be captured every 0.1 s (e.g., NoRH). On the other hand, the short duration of most flares limits the longest detectable period to several minutes.
Statistical studies of the oscillation quality (Q-factor) of OPPs, i.e. the number of oscillation cycles (periods), and its relationship with the QPP period based on the events occurring in the same flaring active region [Pugh et al., 2017b] have shown that the typical duration of QPPs is only several (2–10) oscillation cycles [Nakariakov et al., 2019] . Also shown is the complete absence of the dependence of the mean QPP period on the number of QPP cycles. These statistical properties of QPPs in solar flares should be taken into account in their detection and analysis.
3.2. Types of QPPs
The classification of QPPs can be based on their nonstationarity, namely, on characteristic time variations in amplitude and period, and the characteristic time history of a signal. For example, among others are two typical classes of QPPs: decaying quasi-harmonic oscillations and triangular signals (i.e. oscillations whose profiles have a symmetric triangular shape) [Na-kariakov et al., 2019] . In particular, it is necessary to pay special attention to nonstationary properties of QPPs because the nonstationarity provides additional seismological information (for more detail see Subsection 3.3).
QPPs occur at all phases of solar flares. In some cases, they were detected during the impulsive and decay phases [Van Doorsselaere et al., 2011; Dolla et al., 2012; Simões et al., 2015; Kupriyanova, Ratcliffe, 2016] . In other cases, QPPs were observed only during the impulsive phase [Jakimiec, Tomczak, 2012] or only during the decay phase [Kim et al., 2012] . QPPs of different types are associated with different phases of solar flares. For example, QPPs during the impulsive phase often feature a great emission intensity modulation depth, sometimes over 80 % [Kupriyanova et al., 2016] . QPPs during the decay phase often appear as decaying quasi-harmonic signals [Kupriyanova, Ratcliffe, 2016; Kim et al., 2012] . For QPPs of this class, the signal decay time is proportional to the oscillation period. This proportion is found to be true for both solar and stellar flares [Cho et al., 2016] .
Multi-periodic QPPs often occur which comprise several periodic components (modes) with different periods [Inglis, Nakariakov, 2009]. Note that each individual mode may relate to QPPs of different types. On the other hand, the triangular signals may either result from the superposition of several modes (Figure 5 and [Kolotkov et al., 2015]) or indicate nonlinear processes in flaring plasma [Dubinov, Kolotkov, 2018]. Multi-periodic QPPs can serve as a good tool for plasma diagnostics [Inglis et al., 2009; Guo et al., 2016].
3.3. Nonstationary properties of QPPs
In most cases, the period of QPPs detected remains almost constant. Recently, however, evidence has appeared for the presence of QPPs in solar flares with nonstationary, i.e. significantly changing in time, parameters. Thus, Kupriyanova et al. [2010] have revealed the presence of drift of the period between 20 and 60 s in the microwave emission of several solar flares, with the period increasing in some events and decreasing in others. Drift of the period from 2.5 to 5 min was recorded in the microwave and HXR emissions [Reznikova, Shibasaki, 2011] , as well as in the EUV emission [Hayes et al., 2016] , in particular in a series of the most powerful flares of solar cycle 24 in September 2017 [Kolotkov et al., 2018; Hayes et al., 2019] . Another example are signals in the form of wave trains — amplitude-modulated and often broadband oscillations localized in space and time [Mészárosová et al., 2009] . The observed nonstationarity of the QPP parameters may be due firstly to the sequence (or superposition) of independent physical processes in the flare region and secondly to time variations of the physical and geometrical parameters of the flare region, e.g. magnetohydrodynamic (MHD) resonator parameters (see Section 5 for more detail).
An example of the first scenario may be the modulation of flare emission in a flare loop by several MHD modes acting in series or in parallel [Inglis, Nakariakov, 2009] , or the interaction between the eruptive filament and the loop arcade. As the filament emerges, it sequentially causes individual arcade loops to reconnect, thereby, in particular, causing particles to accelerate and precipitate into the chromosphere, and producing HXR-emission sources. The observed displacement of HXR-emission sources is associated not with the physical movement of the same source along the solar surface but with the emergence of a new HXR source in a new place. The pulsations observed in this case in light curves of the HXR emission represent separate successive acts of precipitation of accelerated particles into the chromosphere [Kuznetsov et al., 2016] . Similar QPPs in the HXR emission have previously been found in [Reznikova, Shibasaki, 2011] , but a trigger of the magnetic reconnection was considered to be a slow MHD mode (for more detail, see Subsections 5.1 and 5.3). Note that the characteristic features of the above-mentioned QPPs are the varying time interval between individual pulses, the triangular shape of an individual pulse, the high modulation depth, and the random amplitude modulation.
A vivid example of the latter scenario, i.e. the nonstationarity associated with a change in the MHD-resonator parameters, is decaying quasi-harmonic QPPs with a period decreasing from ~90 to 50 s [Kolotkov et al., 2015]. In terms of the observed parameters of the flare region and the value of the oscillation period, this mode was associated with a kink oscillation of the flare loop (see Subsection 5.1, where QPP mechanisms are described in detail). Later, Pascoe et al. [2017] have revealed a direct relationship between the decreasing loop length and the decreasing period of kink oscillations. Similarly, the increasing QPP period may be attributed to the increasing length of the flare loop [Hayes et al., 2016].
4. METHODS OF DETECTING AND ANALYZING QPPs
QPPs are generally detected and analyzed using methods based on the Fourier transform, in particular, with a running window [Reznikova et al., 2005] , on the wavelet analysis [Torrence, Compo, 1998] , the Hilbert — Huang [Huang et al., 1998] and Wigner — Ville transforms [Kislyakov et al., 2006] . These methods assume that the signal has a harmonic form, perhaps with modulated amplitude and period (also see the Krylov — Bogolyubov method in [Nagovitsyn, 1997] ). These methods work in the most meaningful way for sufficiently narrowband oscillatory signals existing during the entire flare or at least containing a sufficiently large number of oscillation cycles.
4.1. Fourier analysis of the full time series with trend
Figures 4 and 5, a show that the full time series (or light curve) of a flare consists of a slowly varying low-frequency trend (identified in this case by the empirical mode decomposition method (EMD)), quasi-periodic signal often representing a superposition of several periodic components, high-frequency (white) and correlated (colored) noise. For the last one, the spectral power is distributed according to the power law with a specific power index, which can be considered as a measure of correlation between successive data points in the noise, i.e. its color. One of the methods for detecting periodic components is the construction of the Fourier spectrum of the time series. Note that this method reliably identifies only those signals whose period is constant or hardly varies throughout the time interval of interest. If there are significant time variations of the period or in case of an extremely low Q-factor of the system, the method cannot robustly identify the oscillatory component against the background noise.
The Fourier spectrum of the total light curve of a flare is a power-law function, where the low-frequency trend and the high-frequency noise have the maximum and minimum spectral power respectively. As a special case the broken power-law spectrum with different slopes (different power-law indices) in the low-frequency and high-frequency ranges are considered [Pugh et al., 2017b]. The noise level, or the significance level of spectral peaks, is determined from the criterion χ2 [Vaughan, 2005; Pugh et al., 2017a]. In this case, the noise color is determined empirically — as a slope of the Fourier spectrum. We should, however, keep in mind that the unfiltered low-frequency flare trend can also affect the spectrum slope (see the discussion in Subsection 4.2). An undeniable advantage of this method is the high accuracy of the periodicities found: the positive detection of the periodicity means its statistical significance as compared to the background noise processes and the low-frequency and high-amplitude flare trend. In other words, the spectral peaks whose power exceeds the significance level are most likely to be true, i.e. have a noise-free nature. A disadvantage of this method is that not all periodic components present in the signal can be found, having the level of statistical significance estimated in such a way. In other words, not all the peaks with the spectral power below the significance level are spurious. To solve this problem, we should analyze only the high-frequency component of the full signal, with the low-frequency flare trend removed. The high-frequency component can be identified in two ways: subtracting the previously found trend from the full signal analyzed (detrending, see Subsection 4.2) or identifying the high-frequency component using direct filtration methods (see Subsection 4.3).
4.2. Problem of trend and methods of its identification
The study of 8100 white-light flares observed on the spectral M-class star GJ 1243 has shown that ~15 % of them have light curves of the characteristic “elementary” shape — a sharp increase in signal and a gradual decay having a form of a broken exponent [Davenport et al., 2014] . Gryciuk et al. [2017] have proposed an analytical model of soft X-ray emission of an elementary solar flare. This model is based on the assumption that the energy increase is a Gaussian function of time; and the energy relaxation is an exponential function. Especially noteworthy is the result obtained in [Nakariakov et al., 2019] according to which the slope of the Fourier power spectrum of the analytical model of trend from [Gryciuk et al., 2017] may well coincide with the slope of the red noise spectrum. This circumstance complicates the determination of the true cause of the Fourier spectrum slope — the influence of the trend or the effect of colored background noise as described in Subsection 4.1.
03:08 03:09 03:10 03:11 03:12
Start Time (2005-05-06 03:07:02 UT)
10:36 10:37 10:38 10:39 10:40
Start Time (2004-06-03 10:35:49 UT)
Figure 4. Typical flare light curves: top panel — the SOL2005-05-06T03:08:40 solar flare with QPPs in microwave (34 GHz, NoRH, black curve), hard X-ray (100–300 keV, RHESSI, blue curve), and radio emission (32 MHz, RSTN, red curve) [Kupriyanova et al., 2016]; bottom panel — stellar flare on the red dwarf SDSS J144738.47 035312.1 with QPPs in the near UV band as derived from GALEX data [Doyle et al., 2018]
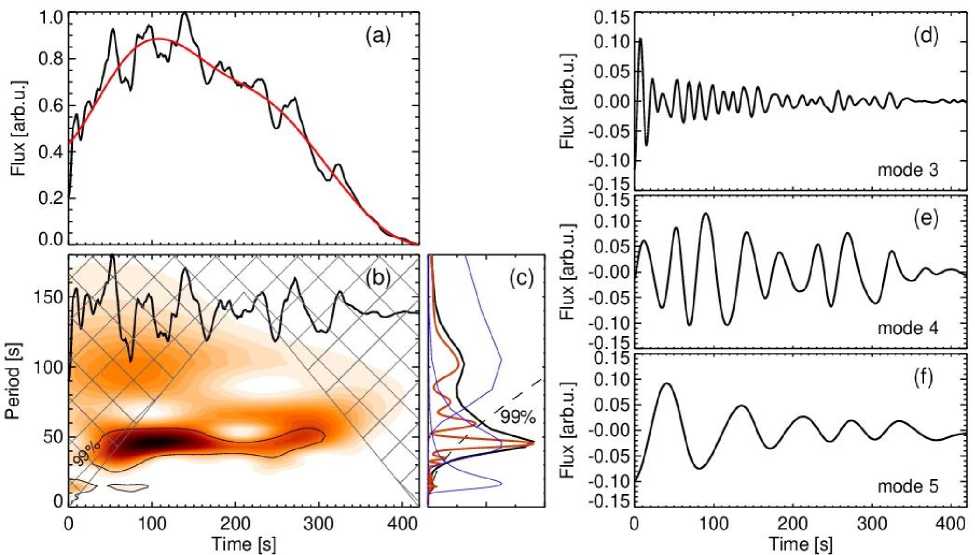
Figure 5. Results of the analysis of periodic properties of the microwave emission of the SOL2013-05-14T01:11 solar flare as derived from NoRH data at the frequency of 17 GHz: a — a light curve of the flare (black curve) showing triangular profiles of separate pulsations, and its trend (red curve) obtained by the EMD method; b — a high-frequency component of a signal after subtraction of the trend (black curve) with its wavelet spectrum (shades of red); thin black contours show a significance level of 99 %; c — the global wavelet spectrum (black curve) obtained by integrating the wavelet spectrum over time, and corresponding Fourier spectrum (red curve); blue curves indicate three Gaussian filters whose application to the Fourier spectrum followed by the inverse Fourier transform gives the best correspondence to the EMD modes presented in panels d , e , f ; d , e , f are three significant EMD modes with periods of ~15 and 45 s and a decreasing period from ~90 to 50 s respectively
The identification of a flare trend is not a trivial task and requires a careful approach. An incorrectly determined trend can not only lead to the occurrence of spurious peaks in the signal frequency spectrum but also affects the evaluation of statistical significance. Because of this, a number of recent studies did not perform the detrending procedure at all [Dominique et al., 2018; Inglis et al., 2016; Pugh et al., 2017a] . At the same time, the trend has a significant effect on the shape of the power spectrum [Kolotkov et al., 2018] , due to which it becomes much more difficult to detect true QPPs [Pugh et al., 2017a] , and therefore the problem of eliminating the trend from light curves does remain important.
There are several ways to identify the trend. In the ideal case, we know the physical process that determines the trend and know its analytical form (for example, the exponential decay of emission during the flare relaxation phase). In this case, trend parameters are found, e.g., using the least square method. In most cases, however, the analytical form of the trend cannot be determined. Most solar flares have a complex form of the trend, especially in the nonthermal emission.
When the analytical form of the trend is unknown, we can apply different procedures smoothing a signal over a time window of a given width. Such smoothing can be implemented in IDL using SMOOTH.pro or SAVGOL.pro procedures or any other software with similar functions. The light curve smoothing in automatic mode can give rise to spurious peaks in the Fourier per- iodogram or artificially suppress true peaks. With the manual processing of light curves (e.g., selection of the smoothing window width) and visual control of the interim results, the number of spurious peaks decreases. Alternately, we can also use the longest-period mode (or modes), obtained with the EMD method, as the flare trend (see Subsection 4.4 and references therein).
4.3. Direct methods for identifying the high-frequency component
Among direct methods for identifying the high-frequency component is, in particular, the Fourier filtration [Inglis, Nakariakov, 2009]. The filtration procedure consists of several steps. First, a Fourier spectrum of the full time series is constructed. To the resulting Fourier spectrum a narrowband filter is applied in the form of, e.g., Gaussian function. This makes the spectrum significant inside the filter and suppresses the spectral power outside it. Then, the time series is restored through the inverse Fourier transform of the filtered Fourier spectrum. The result is a time series with the frequencies of interest specified by the spectral filter width. By eliminating the high-frequency noise, the method increases the power of the periodic component, but the application of the too narrowband Fourier filter will result in the occurrence of a spurious peak in the periodogram. Note that the Fourier filtering method is also affected by the trend. The fact of the matter is that the presence of the trend, in addition to the appearance of a peak in the low-frequency part of the periodogram, also changes the slope of the entire spectrum (see Subsection 4.2). Therefore, even inside the filter selected in the high-frequency region of the Fourier spectrum, powers of spectral peaks will be distorted by the trend.
Similarly, we can adopt the wavelet filtering, applying the filter to the wavelet spectrum [Dolla et al., 2012] .
4.4. Wavelet and EMD analysis of QPPs with nonstationary parameters
It is known that the implementation of the standard wavelet method in software package frequently used in solar physics [Torrence, Compo, 1998] significantly overestimates the statistical significance of QPP signal when compared with the white noise spectrum. A more realistic estimate of the QPP significance can be obtained using the red noise, which is also provided by the standard software package. Standard methods based on the Fourier transform represent the signal as a superposition of harmonic basis functions. Convolution of an anharmonic signal with a periodic basis function can lead to the occurrence of spurious peaks in the periodogram or wavelet spectrum; hence the need for a new approach to the analysis of QPPs with nonstationary parameters.
The recently introduced EMD (Empirical Mode Decomposition) method differs fundamentally from the aforesaid methods in the fact that as a priori any basis of decomposition [Huang, Wu, 2008] . The EMD method analyzes time scales of the time series, separating similar time scales into the intrinsic empirical mode. The iteration method identifies modes of different time scales, from the low-frequency trend to the high-frequency noise. This, in particular, can be used for effective detrending of the signal analyzed (see [Nakaria-kov et al., 2010b; Cho et al., 2016] for solar and stellar QPPs and [Hnat et al., 2016] for magnetospheric pulsations). Each of the modes represent, in fact, a nonsta-tionary and anharmonic oscillation signal. For this reason, the EMD method is best suited for the analysis of nonstationary oscillations. While the EMD method has already been used to study nonstationary properties of QPPs [Nakariakov et al., 2016] , the full application of this method requires a better understanding of its capability and disadvantages. In particular, a considerable advance in the use of the EMD method for analyzing noisy observational signals has been made in [Kolotkov et al., 2016a] , where it has been shown that not all intrinsic EMD modes necessarily represent a statistically significant oscillatory process. Thus, the estimated significance of EMD modes, such as through the approximation of the spectrum shape by a power-law function and through the construction of confidence intervals, should be considered as a necessary and inherent part of the method.
Summarizing what has been discussed in Section 4, we note that there is still no commonly accepted method for automatic detection of QPPs in flare light curves. All the approaches described above require us to estimate the statistical significance of the periodicities found as compared to the background noise. Despite the signifi- cant progress in this field, the question of detecting statistically significant QPPs remains open (see, e.g., the most recent review of various modern methods for detecting QPPs in flares in [Broomhall et al., 2019]). At this stage, achieving a reliable detection of QPPs requires visual control of interim results and comparing the results obtained by different methods.
5. THEORETICAL MODELS OF QPPs
Since typical QPP periods — from fractions of a second to several tens of minutes — coincide with typical periods of MHD waves in the solar atmosphere, it is natural to suggest that there is a relationship between QPPs and MHD oscillations. For example, the characteristic transit time of a slow magnetoacoustic (SMA) wave between footpoints of the coronal loop is (depending on plasma temperature and loop length) from a few minutes to several tens of minutes. A similar time for fast magnetoacoustic (FMA) and Alfvén waves is minutes. These waves travel across the loop for a few seconds or faster.
The current understanding of the mechanisms responsible for the occurrence of QPPs in the light curves of flare emission divides them into three categories: mechanisms based on direct modulation of emitting plasma by MHD oscillations; mechanisms in which MHD waves modulate energy release efficiency (e.g., periodically induced magnetic reconnection), acceleration of charged particles and their kinematic parameters; and mechanisms based on a spontaneous quasi-periodic energy release. Some of the most well-known QPP mechanisms are shown in Figure 6.
5.1. Eigenmodes of a magnetic flux tube oscillations
The first QPP models relied on the consideration of natural MHD oscillations of a coronal loop. By modeling the loop as a straight plasma cylinder surrounded by the plasma with other properties, Zaitsev, Stepanov [1975] derived dispersion equations describing properties of MHD modes in this system. Later, a general description of natural MHD oscillations of a coronal loop was provided [e.g., Edwin, Roberts, 1983] . In the case of the plasma loop, boundary conditions on its footpoints result in the formation of standing waves with a fixed wavelength in the direction along the field (cylinder axis). As in any 3D resonator, MHD modes feature a set of three wave numbers. The longitudinal mode number is determined by the number of half-waves in the spatial structure of the disturbance along the cylinder. The radial mode number describes the number of zeros in the radial structure of the disturbance, e.g., the radial component of plasma speed. The azimuthal mode number describes the azimuthal symmetry of the disturbance. The main properties of MHD modes are determined by the azimuthal number m . The radial structure of the disturbance, i.e. in the direction perpendicular to the cylinder axis, may be oscillatory inside the cylinder (body modes) or exponentially decaying from the boundary to the axis of the cylinder (surface modes). In the external
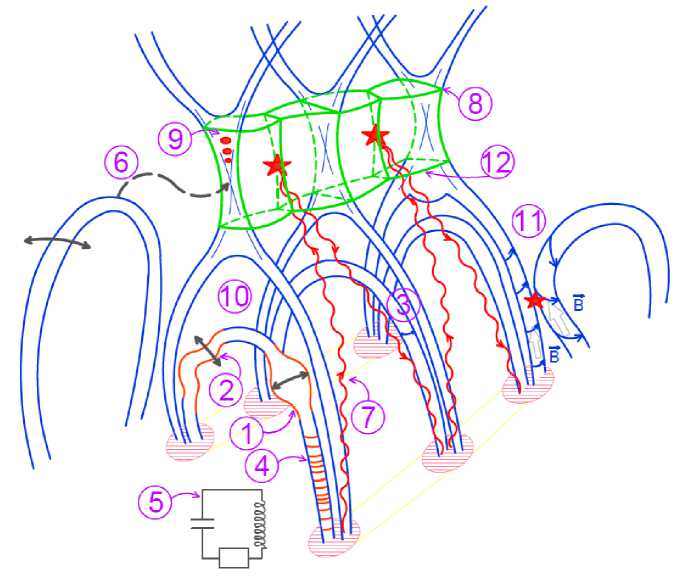
Figure 6. Mechanisms of QPP generation. Numbers correspond to the numbers of the mechanisms in the text
medium, the radial structure of the disturbance can be exponentially evanescent from the cylinder axis (trapped modes) or effectively escaping from the cylinder (leaky modes). These modes are also referred to as non-radiative and radiative modes. Typical speeds of MHD modes are determined by the sound speed Cs = ^ y kT / m and the Alfven speed CA = B / ^/pp inside and outside the cylinder, where γ is the adiabatic index, k B is the Boltzmann constant, T is the plasma temperature, m is the mean particle mass equal to 0.6 of proton mass (considering the presence of a small fraction of helium ions in the corona), B is the magnetic induction, ρ is the plasma density, and μ is the magnetic permeability.
In a coronal loop, Alfvén speeds generally exceed sound speeds by an order of magnitude. The Alfvén speed outside the cylinder exceeds that inside it.
There are several most important types of modes. A sausage (radial, peristaltic, m = 0) mode represents axisymmetric oscillations of cylinder boundaries, followed by variations in the plasma density and magnetic field and predominantly radial plasma flows in a plasma with a low value of the parameter β (see Figure 6, mechanism 1). In a plasma with finite values of the parameter β, the sausage mode also induces field-aligned plasma flows. Tsap et al. [2011] have concluded that field-aligned and radial flows in this mode are phase-shifted by π/2 relative to each other. In the case of longitudinal wavelengths of the order of or shorter than the diameter of the cylinder, the period of the sausage mode is determined by the ratio of the longitudinal wavelength to the characteristic phase speed with the value between the Alfvén speeds inside and outside the loop. With decreasing longitudinal wavelength, this phase shift tends to the Alfvén speed inside the loop [Nakariakov et al., 2012]. In the long-wavelength limit, the sausage oscillation period depends on the ratio of a loop minor radius (cylinder diameter) to the Alfvén speed inside the loop [Kopylova et al., 2007]. Typical periods of sausage modes of coronal loops vary from fractions of a second to tens of seconds.
The kink mode (| m | = 1) features transverse oscillations of the cylinder axis and hence of the direction of the magnetic field in the loop (Figure 6, mechanism 2). The displacement of the cylinder axis may have both a linear (in particular, horizontal or vertical) and circular or elliptical polarization. In the long-wavelength regime, the plasma density remains almost unchanged. While this mode can be considered as an analogue of a vibrating string, it should not be confused with the Alfvén mode. The kink mode is a modified FMA mode because with decreasing ratio of the wavelength to the diameter of the cylinder it becomes increasingly compressive. In other words, the plasma density perturbation becomes considerable. The period of kink modes depends on the ratio of the longitudinal wavelength to the kink speed
( о C2 + о C 2 V2
CK = I — A0—— Ae- I , determined by plasma densi-l Oo+ Oe J ties and Alfvén speeds inside (index "0") and outside (index "e") the plasma cylinder [Ryutov, Ryutova, 1976]. Typical periods of kink modes of coronal loops are several minutes.
In the plasma cylinder with a straight magnetic field, the true Alfvén wave is a torsional wave, which is characterized by periodic twisting and untwisting of the cylinder (Figure 6, mechanism 3, see [Van Doorsselaere et al.,
2008] ). Since the twisted component of the magnetic field is associated with the electric current along the cylinder axis, this mode can be regarded as an alternating current flowing through the loop. The period of Alfvén waves is determined by the ratio of the longitudinal wavelength to the Alfvén speed inside the cylinder. The typical periods of Alfvén waves of coronal loops are close to the periods of the kink modes. Unlike the sausage and kink modes, the radial structure of disturbances in the Alfvén waves is determined only by initial conditions and may be any, which can lead to mixing (in a radial direction) of oscillation phases. Thus, Alfvén waves are not collective, and their properties may differ significantly on the adjacent cylindrical magnetic surfaces. The collective nature of a specific mode suggests that oscillations of adjacent layers of the cylinder are coupled (the cylinder oscillates as a whole), which is typical of magnetoacoustic modes and absent for the Alfvén mode.
The longitudinal or acoustic (slow) mode is characterized mainly by longitudinal plasma flows along the magnetic field axis of the cylinder (Figure 6, mechanism 4). At small values of the parameter β, this mode is well described by one-dimensional acoustic equations (in other words, equations for plane acoustic waves). At the same time, these oscillations are not plane since their longitudinal wavelength, determined by the length of the cylinder, far exceeds the transverse wavelength, defined by the diameter of the cylinder, which is important for finite values of the parameter β. In this case, the phase speed of slow modes is close to the so-called
CC tube, or cusp, speed CT = —. SA . For в ^ 0, the tube c2 + cA speed reduces to the sound speed (infinite magnetic field approximation). Perturbations of the magnetic field and cylinder diameter for this mode are also determined by the value of the parameter β, and for small β this mode hardly disturbs the magnetic field. The period of slow modes depends on the ratio of the longitudinal wavelength to the sound, or tube, speed. The typical periods of slow modes of coronal loops range from several minutes to several tens of minutes.
The direct modulation of the flare emission by the MHD modes depends on a particular emission mechanism. For example, in the case of optically thin thermal emission driven by the plasma temperature and the line-of-sight plasma density squared, the temperature and plasma density are modulated by both SMA and FMA modes. Furthermore, the observed thickness of the loop and accordingly the amount of plasma along the line of sight are modulated by both sausage and kink modes. In this case, periods and amplitudes of QPPs are determined by periods and amplitudes of MHD modes. It is obvious that this mechanism readily explains QPPs with a low relative amplitude (modulation depth). Difficulties, however, arise in interpreting QPPs with deep emission modulation.
Moreover, in the presence of nonthermal electrons in an oscillating loop the modulation of electron plasma frequency and gyrofrequencies, caused by the corresponding perturbation of the plasma density and magnetic field in an MHD wave, can generate a modulation of incoherent nonthermal emission, e.g., through the GS mechanism [Kopylova et al., 2002]. The kink and Alfvén modes by perturbing the direction of the local magnetic field will thus change the angle between the line of sight and the local magnetic field, also causing a modulation of the microwave emission intensity [Tapping, 1983].
Observations show that the cross-section of loops may increase with height. Thus, the loop is a magnetic trap for accelerated electrons. Sausage modes perturb the loop cross-section inhomogeneously along the axis of the loop and hence modulate parameters of the magnetic trap (magnetic mirror ratio), and thus the flow of electrons precipitating into the chromosphere. This effect causes a periodic modulation of the nonthermal emission, generated by accelerated electrons, for example, in the microwave and HXR emission (Zaitsev — Stepanov mechanism [Zaitsev, Stepanov, 1982] ). The periodicities typical for the sausage modes can therefore be observed in the emission in these bands. A similar mechanism has been adapted for interpreting QPPs with a period of ~13 s in the optical emission of red dwarf EV Lac in [Stepanov et al., 2005] . The authors have concluded that the emission sources are located near the loop footpoints and their optical emission is modulated by periodically precipitating electrons.
5.2. Equivalent RLC circuit
The finite electrical conductivity of a partially ionized plasma in the chromosphere and photosphere shorts the electric currents directed along the magnetic field of active regions in the corona. Thus, the coronal loop may be considered as a contour with electric current with effective inductance, capacitance, and resistance, determined by geometric and magnetic parameters of the loop (Figure 6, mechanism 5). This physical system can serve as an equivalent resonant circuit [Zaitsev, Stepanov, 2008] . The period of natural oscillations of the alternating electric current in such a system is PLC R =^—^ ( LC ) 12 , where L is the equivalent inductance, and C is the equivalent capacitance. The alternating current can cause periodic acceleration of charged particles and affect their kinematic parameters, resulting in the occurrence of QPPs in the nonthermal emission.
5.3. Periodically induced magnetic reconnections
It is generally accepted that the flare energy release occurs due to magnetic reconnection, although questions remain open about accumulation of magnetic energy and its rapid transformation into other kinds of energy (the problem of fast reconnection). In the simplest Sweet — Parker and Petschek models [Somov, 2010], the magnetic reconnection process is considered to have no intrinsic time scale. Direct numerical experiments show that the energy release is essentially non-stationary, and the characteristic statistical energy distribution is described by the power law [Barta et al., 2011]. The periodic variation in boundary conditions such as the velocity of flows transferring the magnetic field to the reconnection region may lead to periodic modulation of the reconnection rate, and thus of energy release.
The periodic modulation of the boundary conditions can be induced by MHD oscillations in the plasma structures located at a distance from the reconnection site. For example, the kink oscillation of a coronal loop near the flare current sheet or X-point (Figure 6, mechanism 6) will result in a periodic modulation of the magnetic field and plasma flow velocity [Nakariakov et al., 2006] . Moreover, it has been established that the interaction of FMA waves, radiated, for example, by an oscillating loop (leaky mode), with the X-point is accompanied by focusing of waves in its vicinity [McLaughlin et al., 2011] , thereby leading to a dramatic quasi-periodic increase in the electric current density. The amplitude of the current density variations can exceed the amplitude of the MHD oscillation that induces the variations by orders of magnitude. High values of the electric current density may cause plasma instabilities and thus the development of turbulence in plasma, leading to a sharp, by several orders of magnitude, increase in the electrical resistivity of plasma. Being localized in the vicinity of the X-point, this periodically occurring anomalously high electrical resistivity acts as a trigger of the periodic energy release resulting from reconnection. In this case, the QPP period is determined by the remote kink oscillation period. A similar mechanism may also involve SMA oscillations [Chen, Priest, 2006] .
This scenario can readily explain the observed progression of the emission source position in flare ribbons along the neutral line. The initial energy release event localized above the plasma arcade leads to the generation of SMA pulses propagating at a certain small angle to the magnetic field, reflected from the chromosphere, coming back to the top of the arcade, and causing there the next energy release (Figure 6, mechanism 7). The time separating the individual pulses, in other words the QPP period, is defined by the propagation time of SMA waves from the loop top to footpoints and back [Nakar-iakov, Zimovets, 2011] . A detailed study of this effect has not been carried out yet.
5.4. Flapping oscillations
The quasi-periodic energy release propagating along the neutral line can also be explained by natural oscillations of the macroscopic current sheet located above the flare arcade (see Figure 2). This phenomenon, called flapping oscillations, is associated with the current sheet destabilization leading to increasing quasi-periodic movements perpendicular to the plane of the sheet (Figure 6, mechanism 8). Flapping oscillations are purely magnetohydrodynamic. The characteristic flapping oscillation period can be estimated through magnetic field gradients in the vicinity of the current sheet as
2π μρ
P ® , v —. In this case, the Z-axis flap ^(5Bx 1dz)(dBz 1dx)
may be regarded as a vertical coordinate; and the X-axis, as a horizontal coordinate across the current sheet. The current sheet with the magnetic field component per- pendicular to the plane of the sheet is sometimes referred to as magnetic reversal. In general, the oscillation period also depends on the current sheet thickness and perturbation wavelength along the sheet [Erkaev et al., 2007]. Flapping oscillations of the sausage symmetry modulate the current sheet thickness, which may lead to a quasi-periodic modulation of the rate of the magnetic reconnection and its related processes such as acceleration of charged particles [Artemyev, Zimovets, 2012]. Flapping oscillations have been actively studied in the context of interpretation of wave processes observed in the geomagnetic tail.
5.5. MHD self-oscillations
It is known that in nonconservative nonlinear dynamic systems there may appear self-oscillatory regimes corresponding to the occurrence of a limit cycle in the phase portrait. A self-oscillatory process can be illustrated by the conversion of the direct current energy or constant flow of fluid or plasma into the alternating current or mechanical oscillations. The frequency of selfoscillations is determined by properties of the system and is generally independent of properties of the external excitation. In the world around us, the self-oscillatory processes play a huge role. For example, self-oscillators (generators of self-oscillations) are the human heart, various generators of radio waves, lasers, musical instruments, electronic and mechanical watches [Jenkins, 2013] .
The standard solar flare model includes all necessary components of the self-oscillator. An external source of energy is plasma flows carrying the magnetic field to the reconnection region. The role of the nonlinear element is played by the current sheet; and the role of the MHD resonator, cusp loop structures under the current sheet. Thus, the energy release rate may be periodically modulated by internal spontaneous self-oscillatory processes (Figure 6, mechanism 9). The theory of this phenomenon is absent, although direct numerical experiments show the possibility of its existence. For example, Murray et al. [2009] have found a quasi-periodically pulsating magnetic reconnection due to the interaction of a vertical magnetic field with a smoothly emerging bipolar magnetic region. Typical periods of the selfoscillations were several tens of minutes. The dependence of the self-oscillation period on parameters of the system was not studied. Numerical experiments carried out in [Thurgood et al., 2019] have shown a periodic variation in the magnetic field geometry in the vicinity of the X-point.
Nakariakov et al. [2010b] have proposed an interpretation of the pulsating reconnection based on the analogy with the formation and detachment of droplets in hydrodynamics. Let us consider the well-known dripping faucet. The water flow to the faucet spout can be regarded as constant. The detachment of droplets can be strictly periodic. This periodicity has nothing to do with any of the oscillatory processes. The droplet detachment period depends on the water inflow rate, its surface tension and gravity. The role of the water inflow in the pulsating magnetic reconnection is played by MHD flows carrying the magnetic field to the reconnection region; the electric resistivity of plasma plays the role of surface tension; and the Lorentz force, the role of gravity. Thus, we can expect the occurrence of spontaneous oscillations of the energy release rate, e.g., during the quasi-periodic formation of plasmoids and in the quasi-periodic acceleration of charged particles. This mechanism can explain the periodic formation of plasmoids in the current sheet, which is observed in the numerical experiment [Kliem et al., 2000]. It has been empirically found that the typical period of the formation of plasmoids is defined by the ratio of the plasmoid diameter to the Alfvén speed in it [Jelínek et al., 2017].
5.6. Thermal overstability
Long-period (several tens of minutes) QPPs of thermal emission may be caused by the modulation of thermodynamic plasma parameters by thermal overstability. Physics of this phenomenon can be illustrated as follows. Radiative losses of energy lead to a continuous cooling of hot plasma in the solar corona. In the optically thin regime, these losses are determined by the plasma density squared and highly nonmonotonic temperature function. For example, 1 g of plasma in the coronal active region with a temperature of 10 MK loses more than 1011 erg/s, which is more than 100 kW. The existence of the hot corona requires continuous compensation of these radiative losses. This defines one of the fundamental problems of modern solar physics, namely, the problem of coronal heating. Specific mechanisms of coronal heating are the subject of intensive research. Obviously, the dependences of the unknown heating and radiative cooling functions on the physical parameters of the coronal plasma, perturbed by MHD oscillations, should be different. Thus, the violation of the thermal equilibrium defined by the balance of radiative losses, heating, and perhaps thermal conductivity, by MHD waves or another external perturbation leads to a thermal misbalance. Depending on the derivatives of a combined heat/loss functions with respect to the plasma MHD paramters (density, temperature, possibly, magnetic field), this misbalance can lead both to restoration of thermal equilibrium and to various instabilities [Field, 1965] . In particular, there may be a regime of periodic oscillations with growing amplitude, i.e. overstability (Figure 6, mechanism 10). Modulation of plasma parameters and possibly of the magnetic field by this overstability can produce QPPs (see, e.g., observations in [Tan et al., 2016] ).
5.7. Periodic regime of coalescence of two twisted loops
The oscillating regime of coalescence of two twisted current-carrying flux tubes can also lead to quasi-periodic bursts of emission intensity in solar flares [Tajima et al., 1987] and is often regarded as one of the possible mechanisms of excitation of the observed QPPs (Figure 6, mechanism 11). According to this mechanism, the current sheet is formed in the region of interaction between two colliding magnetic loops with the magnetic field twisted in the same direction. At the initial stage, such loops with unidirectional currents may move toward each other due to the relative movement of their footpoints in the photosphere. As the distance between them decreases, the Ampere force of current interaction increases, thereby causing a rapid decrease in the current sheet thickness and possibly its reconnection, i.e. the so-called coalescence instability of two twisted magnetic loops (magnetic flux ropes, plasmoids). The nonlinear evolution of the “explosive” phase of this instability (when colliding plasmoids are located sufficiently close to each other so that their dynamics is completely determined by the balance between the magnetic Ampere force and the thermal pressure gradient) was modeled analytically and numerically using MHD and kinetic codes. The results show that there are at least two scenarios of the formation of plasma parameter oscillations in this instability. Firstly, the process of coalescence of two plasmoids can be quasi-periodic. Secondly, fast (short-period) transverse oscillations of the current sheet may occur in each elementary act of coalescence. In the former case, a constant inflow of magnetic field energy to the reconnection region is required. In this case, the characteristic time scale of the process will be determined by the intensity of the magnetic influx and plasma parameters in the current sheet (see the discussion of the similarity of such pulsating reconnection with quasi-periodic detachment of water droplets from a horizontal surface in Subsection 5.5). Tajima et al. [1987] have numerically shown that for typical values of coronal plasma parameters the characteristic periods of this process are ~200 s. In the latter case, the current sheet formed in each new collision of coalescing plasmoids can also experience oscillations of radial (sausage) symmetry with much shorter periods with the Ampere magnetic force and thermal pressure gradient as driving and restoring forces respectively. In the approximation of quasi-neutral MHD, it has been demonstrated that oscillations of this current sheet are described by the second-order ordinary nonlinear differential equation, which in the linear regime reduces to a usual harmonic oscillator with a period P∝β 3/2τ A, where β is the plasma parameter defining the relationship between thermal and magnetic plasma pressures; and τA is the Alfvén transit time across the current sheet of width L, determined on the boundary β=1. With a typical value of plasma parameters in a flare and L=1 Mm, the period of such linear oscillations is equal to fractions of a second. If we, however, take into account the non-linear relationship of the oscillation period with amplitude, the oscillation period may be as long as 1 s in the nonlinear regime of the current sheet evolution for the relative amplitude oscillation of ~100 %. Kolot-kov et al. [2016b] have analytically shown that when the current sheet thickness before reconnection decreases to the scales comparable to the Debye length, the high-frequency oscillations considered cause an effective local electric charge separation. The charge separation, in turn, leads to the formation of an additional driving force of electrostatic nature. In this case, in the approximation of two-fluid MHD the linear oscillation period is defined as P x ^в3т2 + 4в / ю2, where « is the characteristic frequency of ion oscillations of the current sheet plasma. For typical conditions in the solar corona, this period is a few microseconds. It is interesting that the electrostatic field induced in this case oscillates with the same period and in the nonlinear regime has a characteristic form of symmetrical triangular peaks.
5.8. Magnetic fork model
Another example of the formation of flare plasma oscillations can be the magnetic fork model [Takasao, Shibata, 2016] , according to which the supersonic nonperiodic magnetic flux flowing from the reconnection region interacts with the upper part of hot and dense post-flare loops (Figure 6, mechanism 12). The collision of a rapid magnetic flux with a dense plasma results in the formation of shock waves in a relatively small region above tops of the post-flare loops and the subsequent formation of specific magnetic V-shaped structures there, which serve as effective resonators for plasma perturbations. The numerical 2D MHD simulation has shown that arms of such plasma structures can experience transverse oscillations of the radial symmetry with a period P proportional to the value of the local magnetic field as P x B -2.1. The estimated period for typical conditions in the solar corona is ~40 s and longer, which is consistent with the observed periods of QPPs in flares. It has been empirically found that the oscillations also depend on the structure of the shock waves generated and completely vanish in the absence of the magnetic influx. Importantly, the shock waves required to form the corresponding magnetic V-shaped configuration and its subsequent oscillations may occur in the regime of steady, non-pulsating magnetic reconnection. In turn, the quasi-periodic movements of the structure arms disturb the surrounding plasma, leading to the generation of traveling FMA waves. In its principle of operation, the model described resembles a tuning fork resonator, after which it gets its name.
CONCLUSION
The quasi-periodic pulsations of flare emission discovered fifty years ago continue to attract close attention of researchers. Increased sensitivity and resolution capabilities of instruments, improvement of observational data analysis methods, and rapid development of theoretical modeling of physical processes occurring in flares have led to significant advances both in the understanding of causes of QPPs and in methods of their detection and analysis. It has been found that in both nonthermal and thermal emissions QPPs are quite widespread and, moreover, perhaps an intrinsic component of the flare process independent of the observational wave band, specifics of an instrument, and data processing method. Furthermore, it has been established that QPPs observed in stellar superflares and in much weaker solar flares are similar. Thus, QPPs are a necessary element of a flare in general, and a physical model of flare cannot be complete without description of QPPs.
It is understood that individual QPPs may be caused by the physical processes that fall into one of three groups (see Section 5): direct emission modulation by MHD oscillations of all known types; periodic modulation of efficiency of energy release processes such as magnetic reconnection (and acceleration of charged particles associated with it), by MHD oscillations; and the quasi-periodic regimes of the very reconnections themselves, not directly related to the MHD oscillations. Understanding of specific mechanisms responsible for the occurrence of QPPs along with their observed parameters allows us to diagnose flaring plasmas and can considerably improve the prediction of flares.
Further progress in QPP research requires the following steps. First, by analogy with geomagnetic pulsations, it is necessary to make a clear classification of the observed QPPs. The classification should be based primarily on the use of the characteristic time scale and the characteristic time history of the observed signal along with information on the spatial structure of its source. In particular, sinusoidal and symmetric triangular QPPs should obviously correspond to different mechanisms, as well as QPPs with characteristic periods of a few tens of minutes and several seconds. This classification will enable us to search for different statistical regularities within a particular QPP class. We must continue to search for the correlation between QPP parameters and observed parameters of flare active regions. It seems extremely interesting to study the evolution of QPP parameters with the development of flare and the correlation of this evolution with changes in the parameters of both the flare region and the flare itself. This allows us to make use of the definite advantage of observations of solar flares — the opportunity to obtain information about the spatial structure of a QPP source and its evolution. This approach can provide us with unique information for identifying the mechanism responsible for specific QPPs. It seems very promising to detect and analyze QPPs of different classes in one flare, which may enable us to significantly reduce the number of free parameters of flare regions estimated from QPPs.
In the theoretical modeling, we should focus on determining specific characteristics of particular mechanisms generating QPPs, and on their manifestations in observations in different wave bands. Especially valuable are simultaneous observations in different wave bands. It seems interesting to develop self-oscillating scenarios of flare evolution. For example, if we assume that in the most powerful two-ribbon flares the speed of energy release propagation along the neutral line is determined by the group velocity of SMA waves, we can estimate the duration of the flare, and hence its maximum power, which is extremely important for space weather forecasting. The often observed deep modulation of a flare signal by QPPs indicates the need to consider the effects of finite amplitude and the development of the theory of nonlinear QPPs and allows us to use the QPP amplitude as an additional observed parameter.
This work was partially supported by the Russian Foundation for Basic Research in the framework of projects No.17-52-10001-Ko_a, No. 17-52-80064-
BRIKS_a, No. 18-29-21016-a.
Список литературы Квазипериодические пульсации в солнечных и звездных вспышках. Обзор
- Гуревич С.И. Еще раз о влиянии геомагнитных штормов на работу релейной защиты // Релейная защита и автоматизация. 2016. № 2 (23). С. 19-21.
- Зайцев В.В., Степанов А.В. О природе пульсаций солнечного радиоизлучения IV типа // Иссл. по геомагнетизму, аэрономии и физике Солнца. 1975. № 37. С. 3.
- Зайцев В.В., Степанов А.В. О происхождении пульсаций жесткого рентгеновского излучения солнечных вспышек // Письма в АЖ. 1982. Т. 8. С. 248-252.
- Зайцев В.В., Степанов А.В. Корональные магнитные арки // Успехи физ. наук. 2008. Т. 178, № 11. С. 1165-1204.
- Лесовой С.В., Алтынцев А.Т., Кочанов А.А. и др. Сибирский радиогелиограф: первые результаты // Солнечно-земная физика. 2017. Т. 3, № 1. С. 3-16. DOI: 10.12737/23588
- Сомов Б.В. Магнитное пересоединение в солнечных вспышках // Успехи физ. наук. 2010. Т. 180. С. 997-1000.
- Хайкин С.Э., Кайдановский Н.Л., Парийский Ю.Н. и др. Радиотелескоп РАТАН-600 // Изв. Главной астрономической обсерватории в Пулкове. 1972. Т. 188. С. 3-12.
- Aptekar R.L., Frederiks D.D., Golenetskii S.V., et al. Konus-W gamma-ray burst experiment for the GGS Wind spacecraft // Space Sci. Rev. 1995. V. 71, iss. 1-4. P. 265-272.
- DOI: 10.1007/BF00751332
- Armstrong D.J., Pugh C.E., Broomhall et al. The host stars of Kepler's habitable exoplanets: superflares, rotation and activity // Monthly Not. Royal Astron. Soc. 2016. V. 455. P. 3110-3125.
- DOI: 10.1093/mnras/stv2419
- Artemyev A., Zimovets I. Stability of current sheets in the solar corona // Solar Phys. 2012. V. 277, iss. 2. P. 283-298.
- DOI: 10.1007/s11207-011-9908-1
- Aulanier G., Démoulin P., Schrijver C. J., Janvier M., Pariat E., Schmieder B. The standard flare model in three dimensions. II. Upper limit on solar flare energy // Astron. Astrophys. 2013. V. 549, id. A66. 7 p.
- DOI: 10.1051/0004-6361/201220406
- Aulanier G., Janvier M., Schmieder B. The standard flare model in three dimensions. I. Strong-to-weak shear transition in post-flare loops // Astron. Astrophys. 2012. V. 543, id. A110. 14 p.
- DOI: 10.1051/0004-6361/201219311
- Balona L.A., Broomhall A.-M., Kosovichev A., et al. Oscillations in stellar superflares // Mon. Not. Roy. Astron. Soc. 2015. V. 450, iss. 1. P. 956-966. 10.1093/mnras/ stv661.
- DOI: 10.1093/mnras/stv661
- Barta M., Buchner J., Karlicky M., Skala J. Spontaneous current-layer fragmentation and cascading reconnection in solar flares. I. Model and analysis // The Astrophys. J. 2011. V. 737, id. 24. 11 p.
- DOI: 10.1088/0004-637X/737/1/24
- Battaglia M., Motorina G., Kontar E.P. Multithermal representation of the kappa-distribution of solar flare electrons and application to simultaneous X-ray and EUV observations // The Astrophys. J. 2015. V. 815, id. 73. 8 p.
- DOI: 10.1088/0004-637X/815/1/73
- Benz A.O. Flare observations // Liv. Rev. Solar Phys. 2017. V. 14, iss. 1, id. 2. 59 p.
- DOI: 10.12942/lrsp-2008-1
- Benz A.O., Brajša R., Magdalenić J. Are there radio-quiet solar flares? // Solar Phys. 2007. V. 240, iss. 2. P. 63-270.
- DOI: 10.1007/s11207-007-0365-9
- Bogachev S.A., Somov B.V., Kosugi T., Sakao T. The motions of the hard X-ray sources in solar flares: images and statistics // The Astrophys. J. 2005. V. 630, iss. 1. P. 561-572.
- DOI: 10.1086/431918
- Broomhall A.-M., Davenport J., Hayes L., et al. A blueprint of state-of-the-art techniques for detecting quasi-periodic pulsations in solar and stellar flares // The Astrophys. J. Suppl. Ser. 2019. V. 244, iss. 2, id. 44, 37 p.
- DOI: 10.3847/1538-4365/ab40b3
- Carrington R.C. Description of a singular appearance seen in the Sun on September 1, 1859 // Mon. Not. Roy. Astron. Soc. 1859. V. 20. P. 13-15.
- DOI: 10.1093/mnras/20.1.13
- Caspi A., Lin R.P. RHESSI line and continuum observations of super-hot flare plasma // The Astrophys. J. Lett. 2010. V. 725. P. L161-L166.
- DOI: 10.1088/2041-8205/725/2/L161
- Chen P.F., Priest E.R. Transition-region explosive events: reconnection modulated by p-mode waves // Solar Phys. 2006. V. 238, iss. 2. P. 313-327.
- DOI: 10.1007/s11207-006-0215-1
- Cho I.-H., Cho K.-S., Nakariakov V.M., et al. Comparison of damped oscillations in solar and stellar X-ray flares // The Astrophys. J. 2016. V. 830, iss. 2, id. 110. 12 p.
- DOI: 10.3847/0004-637X/830/2/110
- Davenport J.R.A., Hawley S.L., Hebb L., et al. Kepler flares. II. The temporal morphology of white-light flares on GJ 1243 // The Astrophys. J. 2014. V. 797, iss. 2, id. 122. 11 p.
- DOI: 10.1088/0004-637X/797/2/122
- Dolla L., Marqué C., Seaton D.B., et al. Time delays in quasi-periodic pulsations observed during the X2.2 solar flare on 2011 February 15 // The Astrophys. J. Lett. 2012. V. 749, iss. 1, id. L16. 7 p.
- DOI: 10.1088/2041-8205/749/1/L16
- Dominique M., Zhukov A.N., Dolla L. et al. Detection of quasi-periodic pulsations in solar EUV time series // Solar Phys. 2018. V. 293, iss. 4, id. 61. 24 p.
- DOI: 10.1007/s11207-018-1281-x
- Doyle J.G., Shetye J., Antonova A.E., et al. Stellar flare oscillations: evidence for oscillatory reconnection and evolution of MHD modes // Mon. Not. Roy. Astron. Soc. 2018. V. 475, iss. 2. P. 2842-2851.
- DOI: 10.1093/mnras/sty032
- Dubinov A.E., Kolotkov D.Y. Above the weak nonlinearity: super-nonlinear waves in astrophysical and laboratory plasmas // Rev. Modern Plasma Phys. 2018. V. 2, id. 2. 46 p.
- DOI: 10.1007/s41614-018-0014-9
- Dudík J., Dzifčáková E., Karlický M., Kulinová A. The bound-bound and free-free radiative losses for the nonthermal distribution in solar and stellar coronae // Astron. Astrophys. 2011. V. 529, id. A103. 14 p. 10.1051/0004-6361/ 201016329.
- DOI: 10.1051/0004-6361/201016329
- Dulk G.A., Marsh K.A. Simplified expressions for the gyrosynchrotron radiation from mildly relativistic, nonthermal and thermal electrons // The Astrophys. J. 1982. V. 259. P. 350-358.
- DOI: 10.1086/160171
- Edwin P.M., Roberts B. Wave propagation in a magnetic cylinder // Solar Phys. 1983. V. 88, iss. 1-2. P. 179-191.
- DOI: 10.1007/BF00196186
- Erkaev N.V., Semenov V.S., Biernat H.K. Magnetic double-gradient instability and flapping waves in a current sheet // Phys. Rev. Lett. 2007. V. 99, iss. 23, id. 235003. 10.1103/Phys RevLett.99.235003.
- DOI: 10.1103/PhysRevLett.99.235003
- Field G.B. Thermal Instability // The Astrophys. J. 1965. V. 142. P. 531.
- DOI: 10.1086/148317
- Fleishman G.D., Kontar E.P. Sub-Thz radiation mechanisms in solar flares // The Astrophys. J. Lett. 2010. V. 709. iss. 2. P. L127-L132.
- DOI: 10.1088/2041-8205/709/2/L127
- Fleishman G.D., Kontar E.P., Nita G.M., Gary D.E. A cold, tenuous solar flare: acceleration without heating // The Astrophys. J. Lett. 2011. V. 731, iss. 1, id. L19. 6 p.
- DOI: 10.1088/2041-8205/731/1/L19
- Frissell N.A., Vega J.S., Markowitz E., et al. High-frequency communications response to solar activity in September 2017 as observed by amateur radio networks // Space Weather. 2019. V. 17. P. 118-132.
- DOI: 10.1029/2018SW002008
- Gershberg R.E. Solar-Type Activity in Main-Sequence Stars. Springer, Berlin, Heidelberg, 2005. 496 p.
- DOI: 10.1007/3-540-28243-2
- Goddard C.R., Nisticò G., Nakariakov V.M., Zimovets I.V. A statistical study of decaying kink oscillations detected using SDO/AIA // Astron. Astrophys. 2016. V. 585, id. A137. 9 p.
- DOI: 10.1051/0004-6361/201527341
- Golub L., Deluca E., Austin G., Bookbinder J., et al. The X-Ray Telescope (XRT) for the Hinode Mission // Solar Phys. 2007. V. 243, iss. 1. P. 63-86.
- DOI: 10.1007/s11207-007-0182-1
- Gryciuk M., Siarkowski M., Sylwester J., et al. Flare characteristics from X-ray light curves // Solar Phys. 2017. V. 292, iss. 6, id. 77. 19 p.
- DOI: 10.1007/s11207-017-1101-8
- Guo M.-Z., Chen S.-X., Li B., et al. Inferring flare loop parameters with measurements of standing sausage modes // Solar Phys. 2016. V. 291, iss. 3. P. 877-896. 10.1007/ s11207-016-0868-3.
- DOI: 10.1007/s11207-016-0868-3
- Hayes L.A., Gallagher P.T., Dennis B.R., et al. Quasi-periodic pulsations during the impulsive and decay phases of an X-class flare // The Astrophys. J. Lett. 2016. V. 827, iss. 2, id. L30. 6 p.
- DOI: 10.3847/2041-8205/827/2/L30
- Hayes L.A., Gallagher P.T., McCauley J., et al. Pulsations in the Earth's lower ionosphere synchronized with solar flare emission // J. Geophys. Res.: Space Phys. 2017. V. 122, iss. 10. P. 9841-9847.
- DOI: 10.1002/2017JA024647
- Hayes L.A., Gallagher P.T., Dennis B.R., et al. Persistent Quasi-periodic pulsations during a large X-class solar flare // The Astrophys. J. 2019. V. 875, iss. 1. Id. 33. 11 p.
- DOI: 10.3847/1538-4357/ab0ca3
- Heinzel P., Avrett E.H. Optical-to-radio continua in solar flares // Solar Phys. 2012. V. 277, iss. 1. P. 31-44.
- DOI: 10.1007/s11207-011-9823-5
- Heinzel P., Kleint L. Hydrogen Balmer continuum in solar flares detected by the Interface Region Imaging Spectrograph (IRIS) // The Astrophys. J. Lett. 2014. V. 794, iss. 2, id. L23. 6 p.
- DOI: 10.1088/2041-8205/794/2/L23
- Heinzel P., Shibata K. Can flare loops contribute to the white-light emission of stellar superflares? // The Astrophys. J. 2018. V. 859, iss. 2, id. 143. 7 p. 10.3847/1538-4357/ aabe78.
- DOI: 10.3847/1538-4357/aabe78
- Hnat B., Kolotkov D.Y., O'Connell D., et al. Nonlinear waves in the terrestrial quasiparallel foreshock // Phys. Rev. Lett. 2016. V. 117, id. 235102. 10.1103/PhysRevLett. 117.235102.
- DOI: 10.1103/PhysRevLett.117.235102
- Holman G.D., Sui L., Schwartz R.A., Emslie A.G. Electron bremsstrahlung hard X-ray spectra, electron distributions, and energetics // The Astrophys. J. 2003. V. 595, iss. 2. P. L97-L101.
- DOI: 10.1086/378488
- Huang N.E., Wu Z. A review on Hilbert-Huang transform: Method and its applications to geophysical studies // Rev. Geophys. 2008. V. 46, iss. 2, id. RG2006. 10.1029/ 2007RG000228.
- DOI: 10.1029/2007RG000228
- Huang N.E., Shen Z., Long S.R., et al. The empirical mode decomposition and the Hilbert spectrum for nonlinear and non-stationary time series analysis // Ro. Soc. London Proc. Ser. A. 1998. V. 454, iss. 1971. P. 903-998.
- DOI: 10.1098/rspa.1998.0193
- Hudson H.S. Chasing white-light flares // Solar Phys. 2016. V. 291, iss. 5. P. 1273-1322.
- DOI: 10.1007/s11207-016-0904-3
- Hudson H.S., Canfield R.C., Kane S.R. Indirect estimation of energy deposition by non-thermal electrons in solar flares // Solar Phys. 1978. V. 60. P. 137-142. 10.1007/ BF00152338.
- DOI: 10.1007/BF00152338
- Inglis A.R., Nakariakov V.M. A multi-periodic oscillatory event in a solar flare // Astron. Astrophys. 2009. V. 493, iss. 1. P. 259-266. :200810473.
- DOI: 10.1051/0004-6361
- Inglis A.R., van Doorsselaere T., Brady C.S., Nakariakov V.M. Characteristics of magnetoacoustic sausage modes // Astron. Astrophys. 2009. V. 503, iss. 2. P. 569-575.
- DOI: 10.1051/0004-6361/200912088
- Inglis A.R., Ireland J., Dennis B.R., et al. A large-scale search for evidence of quasi-periodic pulsations in solar flares // The Astrophys. J. 2016. V. 833, iss. 2, id. 284. 16 p.
- DOI: 10.3847/1538-4357/833/2/284
- Jakimiec J., Tomczak M. Investigation of quasi-periodic variations in hard X-rays of solar flares. II. Further investigation of oscillating magnetic traps // Solar Phys. 2012. V. 278. P. 393-410.
- DOI: 10.1007/s11207-012-9934-7
- Jelínek P., Karlický M., Van Doorsselaere T., Bárta M. Oscillations excited by plasmoids formed during magnetic reconnection in a vertical gravitationally stratified current sheet // The Astrophys. J. 2017. V. 847, iss. 2, id. 98. 15 p.
- DOI: 10.3847/1538-4357/aa88a6
- Jenkins A. Self-oscillation // Phys. Rep. 2013. V. 525. P. 167-222.
- DOI: 10.1016/j.physrep.2012.10.007
- Kane S.R., Kai K., Kosugi T., Enome S., et al. Acceleration and confinement of energetic particles in the 1980 June 7 solar flare // The Astrophys. J. 1983. V. 271. P. 376-387.
- DOI: 10.1086/161203
- Kashapova L.K., Tokhchukova S.K., Rudenko G.V., et al. On the possible mechanisms of energy release in a C-class flare // Cen. Europ. Astrophys. Bull. 2013. V. 37. P. 573-583.
- Katsova M.M., Kitchatinov L.L., Livshits M.A., et al. Can superflares occur on the Sun? A view from dynamo theory // Astron. Rep. 2018. V. 62, iss. 1. P. 72-80.
- DOI: 10.1134/S106377291801002X
- Kaufmann P., Correa E., Costa J.E.R., Zodi Vaz A.M. A synchrotron inverse Compton interpretation of a solar burst producing fast pulses at lambda less than 3 mm and hard X-rays // Astron. Astrophys. 1986. V. 157. P. 11-18.
- Kim S., Nakariakov V.M., Shibasaki K. Slow magnetoacoustic oscillations in the microwave emission of solar flares // The Astrophys. J. Lett. 2012. V. 756, iss. 2, id. L36. 5 p.
- DOI: 10.1088/2041-8205/756/2/L36
- Kislyakov A.G., Zaitsev V.V., Stepanov A.V., Urpo S. On the possible connection between photospheric 5-min oscillation and solar flare microwave emission // Solar Phys. 2006. V. 233. P. 89-106.
- DOI: 10.1007/s11207-006-2850-y
- Kitchatinov L.L., Olemskoy S.V. Dynamo model for grand maxima of solar activity: can superflares occur on the Sun? // Mon. Not. Roy. Astron. Soc. 2016. V. 459, iss. 4. P. 4353-4359.
- DOI: 10.1093/mnras/stw875
- Kliem B., Karlický M., Benz A.O. Solar flare radio pulsations as a signature of dynamic magnetic reconnection // Astron. Astrophys. 2000. V. 360. P. 715-728.
- Kolotkov D.Y., Nakariakov V.M., Kupriyanova E.G., et al. Multi-mode quasi-periodic pulsations in a solar flare // Astron. Astrophys. 2015. V. 574, id. A53. 6 p.
- DOI: 10.1051/0004-6361/201424988
- Kolotkov D.Y., Anfinogentov S.A., Nakariakov V.M. Empirical mode decomposition analysis of random processes in the solar atmosphere // Astron. Astrophys. 2016а. V. 592, id. A153. 9 p.
- DOI: 10.1051/0004-6361/201628306
- Kolotkov D.Y., Nakariakov V.M., Rowlands G. Nonlinear oscillations of coalescing magnetic flux ropes // Phys. Rev. E. 2016b. V. 93, iss. 5, id. 053205. 10.1103/PhysRevE.93. 053205.
- DOI: 10.1103/PhysRevE.93.053205
- Kolotkov D.Y., Pugh C.E., Broomhall A.-M., Nakariakov V.M. Quasi-periodic pulsations in the most powerful solar flare of cycle 24 // The Astrophys. J. Lett. 2018. V. 858, iss. 1, id. L3. 8 p.
- DOI: 10.3847/2041-8213/aabde9
- Kontar E.P., Motorina G.G., Jeffrey N.L.S., et al. Observation-driven model of the frequency rising sub-THz emission component in solar flares // Astron. Astrophys. 2018. V. 620, id. A95. 6 p.
- DOI: 10.1051/0004-6361/201834124
- Kopylova Yu.G., Stepanov A.V., Tsap Yu.T. Radial oscillations of coronal loops and microwave radiation from solar flares // Astron. Lett. 2002. V. 28, iss. 11. P. 783-791.
- Kopylova Yu.G., Melnikov A.V., Stepanov A.V., et al. Oscillations of coronal loops and second pulsations of solar radio emission // Astron. Lett. 2007. V. 33, iss. 10. P. 706-713.
- DOI: 10.1134/S1063773707100088
- Kotrč P., Procházka O., Heinzel P. New observations of Balmer continuum flux in solar flares: Instrument description and first results // Solar Phys. 2016. V. 291, iss. 3. P. 779-789.
- DOI: 10.1007/s11207-016-0860-y
- Kretzschmar M. The Sun as a star: observations of white-light flares // Astron. Astrophys. 2011. V. 530, id. A84. 7 p.
- Kupriyanova E.G., Ratcliffe H. Minute pulsations in microwaves and X-rays during the flare on May 6, 2005 // Adv. Space Res. 2016. V. 57, iss. 7. P. 1456-1467.
- DOI: 10.1016/j.asr.2016.01.012
- Kupriyanova E.G., Melnikov V.F., Nakariakov V.M., Shibasaki K. Types of microwave quasi-periodic pulsations in single flaring loops // Solar Phys. 2010. V. 267. P. 329-342.
- DOI: 10.1007/s11207-010-9642-0
- Kupriyanova E.G., Kashapova L.K., Reid H.A.S., Myagkova I.N. Relationship of type III radio bursts with quasi-periodic pulsations in a solar flare // Solar Phys. 2016. V. 291, iss. 11. P. 3427-3438.
- DOI: 10.1007/s11207-016-0958-2
- Kuznetsov S.N., Kudela K., Ryumin S.P., Gotselyuk Y.V. CORONAS-F satellite: Tasks for study of particle acceleration // Adv. Space Res. 2002. V. 30, iss. 7. P. 1857-1863.
- DOI: 10.1016/S0273-1177(02)00462-3
- Kuznetsov S.A., Zimovets I.V., Morgachev A.S., Struminsky A.B. Spatio-temporal dynamics of sources of hard X-ray pulsations in solar flares // Solar Phys. 2016. V. 291, iss. 11. P. 3385-3426.
- DOI: 10.1007/s11207-016-0981-3
- Lin R.P., Hudson H.S. Non-thermal processes in large solar flares // Solar Phys. 1976. V. 50. P. 153-178.
- DOI: 10.1007/BF00206199
- Lin R.P., Dennis B.R., Hurford G.J., et al. The Reuven Ramaty High-Energy Solar Spectroscopic Imager (RHESSI) // Solar Phys. 2002. V. 210, iss. 1. P. 3-32. DOI: 10.1023/A:1022428818870.
- Loukitcheva M., Solanki S.K., Carlsson M., Stein R.F. Millimeter observations and chromospheric dynamics // Astron. Astrophys. 2004. V. 419. P. 747-756. 10.1051/ 0004-6361:20034159.
- DOI: 10.1051/0004-6361
- Lysenko A.L., Altyntsev A.T., Meshalkina N.S., et al. Statistics of "cold" early impulsive solar flares in X-Ray and microwave domains // The Astrophys. J. 2018. V. 856, iss. 2, id. 111. 29 p.
- DOI: 10.3847/1538-4357/aab271
- Maehara H., Shibayama T., Notsu S., et al. Superflares on solar-type stars // Nature. 2012. V. 485, iss. 7399. P. 478-481.
- DOI: 10.1038/nature11063
- Maehara H., Shibayama T., Notsu Y., et al. Statistical properties of superflares on solar-type stars based on 1-min cadence data // Earth, Planets and Space. 2015. V. 67, id. 59. 10 p.
- DOI: 10.1186/s40623-015-0217-z
- Masuda S., Shimojo M., Kawate T., Ishikawa S., Ohno M. Extremely microwave-rich solar flare observed with Nobeyama Radioheliograph // Publ. Astron. Soc. Japan. 2013. V. 65, N. SP1, id. S1. 6 p.
- DOI: 10.1093/pasj/65.sp1.S1
- McLaughlin J.A., Hood A.W., de Moortel I. Review Article: MHD wave propagation near coronal null points of magnetic fields // Space Sci. Rev. 2011. V. 158, iss. 2-4. P. 205-236.
- DOI: 10.1007/s11214-010-9654-y
- McLaughlin J.A., Nakariakov V.M., Dominique M., et al. Modelling quasi-periodic pulsations in solar and stellar flares // Space Sci. Rev. 2018. V. 214, id. 45, 54 p. 10.1007/ s11214-018-0478-5.
- DOI: 10.1007/s11214-018-0478-5
- Mészárosová H., Karlický M., Rybák, J., Jiřička K. Tadpoles in wavelet spectra of a solar decimetric radio burst // The Astrophys. J. Lett. 2009. V. 697, iss. 2. P. L108-L110.
- DOI: 10.1088/0004-637X/697/2/L108
- Murray M.J., van Driel-Gesztelyi L., Baker D. Simulations of emerging flux in a coronal hole: oscillatory reconnection // Astron. Astrophys. 2009. V. 494, iss. 1. P. 329-337.
- DOI: 10.1051/0004-6361:200810406
- Nagovitsyn Yu.A. A nonlinear mathematical model for the solar cyclicity and prospects for reconstructing the solar activity in the past // Astron. Lett. 1997. V. 23, iss. 6. P. 742-748.
- Nakajima H., Sekiguchi H., Aiba S., Shiomi Y., Kuwabara T., Sawa M., et al. A new 17-GHz solar radio interferometer at Nobeyama // Publ. Astron. Soc. Japan. 1980. V. 32. P. 639-650.
- Nakajima H., Kosugi T., Kai K., Enome S. Successive electron and ion accelerations in impulsive solar flares on 7 and 21 June 1980 // Nature. 1983. V. 305. P. 292-294.
- DOI: 10.1038/305292a0
- Nakajima H., Sekiguchi H., Sawa M., Kai K., Kawashima S. The radiometer and polarimeters at 80, 35, and 17 GHz for solar observations at Nobeyama // Publ. of the Astron. Soc. of Japan. 1985. V. 37. P. 163-170.
- Nakariakov V.M., Melnikov V.F. Quasi-periodic pulsations in solar flares // Space Sci. Rev. 2009. V. 149, iss. 1-4. P. 119-151.
- DOI: 10.1007/s11214-009-9536-3
- Nakariakov V.M., Zimovets I.V. Slow magnetoacoustic waves in two-ribbon flares // The Astrophys. J. Lett. 2011. V. 730, iss. 2, id. L27. 4 p.
- DOI: 10.1088/2041-8205/730/2/L27
- Nakariakov V.M., Foullon C., Verwichte E., Young N.P. Quasi-periodic modulation of solar and stellar flaring emission by magnetohydrodynamic oscillations in a nearby loop // Astron. Astrophys. 2006. V. 452, iss. 1. P. 343-346. :20054608.
- DOI: 10.1051/0004-6361
- Nakariakov V.M., Foullon C., Myagkova I.N., Inglis A.R. Quasi-periodic pulsations in the gamma-ray emission of a solar flare // The Astrophys. J. Lett. 2010a. V. 708. L47-L51.
- DOI: 10.1088/2041-8205/708/1/L47
- Nakariakov V.M., Inglis A.R., Zimovets I.V., et al. Oscillatory processes in solar flares // Plasma Phys. and Controlled Fusion. 2010b. V. 52, iss. 12, id. 124009.
- DOI: 10.1088/0741-3335/52/12/124009
- Nakariakov V.M., Hornsey C., Melnikov V.F. Sausage oscillations of coronal plasma structures // The Astrophys. J. 2012. V. 761, iss. 2, id. 134. 6 p.
- DOI: 10.1088/0004-637X/761/2/134
- Nakariakov V.M., Pilipenko V., Heilig B., et al. Magnetohydrodynamic oscillations in the solar corona and Earth's magnetosphere: Towards consolidated understanding // Space Sci. Rev. 2016. V. 200. P. 75-203.
- DOI: 10.1007/s11214-015-0233-0
- Nakariakov V.M., Kolotkov D.Y., Kupriyanova E.G., et al. Non-stationary quasi-periodic pulsations in solar and stellar flares // Plasma Phys. and Controlled Fusion. 2019. V. 61, id. 014024.
- DOI: 10.1088/1361-6587/aad97c
- Neupert W.M. Comparison of Solar X-Ray line emission with microwave emission during flares // The Astrophys. J. 1968. V. 153. P. L59.
- DOI: 10.1086/180220
- Pascoe D.J., Russell A.J.B., Anfinogentov S.A., et al. Seismology of contracting and expanding coronal loops using damping of kink oscillations by mode coupling // Astron. Astrophys. 2017. V. 607, id. A8. 9 p.
- DOI: 10.1051/0004-6361/201730915
- Penn M., Krucker S., Hudson H., et al. Spectral and imaging observations of a white-light solar flare in the mid-infrared // The Astrophys. J. Lett. 2016. V. 819, iss. 2, Id. L30. 5 p.
- DOI: 10.3847/2041-8205/819/2/L30
- Pugh C.E., Nakariakov V.M., Broomhall A.-M.A Multi-period oscillation in a stellar superflare // The Astrophys. J. Lett. 2015. V. 813, iss. 1, id. L5. 5 p.
- DOI: 10.1088/2041-8205/813/1/L5
- Pugh C.E., Broomhall A.-M., Nakariakov V.M. Significance testing for quasi-periodic pulsations in solar and stellar flares // Astron. Astrophys. 2017a. V. 602, id. A47. 8 p.
- DOI: 10.1051/0004-6361/201730595
- Pugh C.E., Nakariakov V.M., Broomhall A.-M., et al. Properties of quasi-periodic pulsations in solar flares from a single active region // Astron. Astrophys. 2017b. V. 608, id. A101. 23 p.
- DOI: 10.1051/0004-6361/201731636
- Ryutov D.A., Ryutova M.P. Sound oscillations in a plasma with "magnetic filaments" // J. Exper. and Theor. Phys. 1976. V. 43. P. 491-497.
- Reva A., Shestov S., Zimovets I., et al. Wave-like formation of hot loop arcades // Solar Phys. 2015. V. 290, iss. 10. P. 2909-2921.
- DOI: 10.1007/s11207-015-0769-x
- Reznikova V.E., Shibasaki K. Flare quasi-periodic pulsations with growing periodicity // Astron. Astrophys. 2011. V. 525, id. A112. 7 p.
- DOI: 10.1051/0004-6361/201015600
- Reznikova V.E., Nakariakov V.M., Melnikov V.F., Shibasaki K. Diagnostics of MHD-oscillation modes of a flaring loop using microwave observations with high spatial resolution // Proc. 11th European Solar Physics Meeting "The Dynamic Sun: Challenges for Theory and Observations" (ESA SP-600). 11-16 September 2005, Leuven, Belgium. CDROM. id. 140.1. 4 p.
- Saint-Hilaire P., Benz A.O., Monstein C. Short-duration radio bursts with apparent extragalactic dispersion // The Astrophys. J. 2014. V. 795, iss. 1, id. 19. 6 p. 10.1088/ 0004-637X/795/1/19.
- DOI: 10.1088/0004-637X/795/1/19
- Sakai J.I., Nagasugi Y., Saito S., Kaufmann P. Simulating the emission of electromagnetic waves in the terahertz range by relativistic electron beams // Astron. Astrophys. 2006. V. 457. P. 313-318. :20065368
- DOI: 10.1051/0004-6361
- Scherrer P.H., Schou J. Bush R.I., et al. The Helioseismic and Magnetic Imager (HMI) investigation for the Solar Dynamics Observatory (SDO) // Solar Phys. 2012. V. 275, iss. 1-2. P. 207-227.
- DOI: 10.1007/s11207-011-9834-2
- Shibasaki K. High-Beta Disruption in the Solar Atmosphere // The Astrophys. J. 2001. V. 557. P. 326-331.
- DOI: 10.1086/321651
- Shibayama T., Maehara H., Notsu S., et al. Superflares on solar-type stars observed with Kepler. I. Statistical properties of superflares // The Astrophys. J. Suppl. Ser. 2013. V. 209. iss. 1, id. 5. 13 p.
- DOI: 10.1088/0067-0049/209/1/5
- Silva A.V.R., Share G.H., Murphy R.J., et al. Evidence that synchrotron emission from nonthermal electrons produces the increasing submillimeter spectral component in solar flares // Solar Phys. 2007. V. 245. P. 311-326.
- DOI: 10.1007/s11207-007-9044-0
- Simões P.J.A., Hudson H.S., Fletcher L. Soft X-ray pulsations in solar flares // Solar Phys. 2015. V. 290, iss. 12. P. 3625-3639.
- DOI: 10.1007/s11207-015-0691-2
- Stepanov A.V., Kopylova Yu.G., Tsap Yu.T., Kupriyanova E.G. Oscillations of optical emission from flare stars and coronal loop diagnostics // Astronomy Lett. 2005. V. 31, iss. 9. P. 612-619.
- DOI: 10.1134/1.2039972
- Su J.T., Shen Y.D., Liu Y. Extreme-ultraviolet multi-wavelength observations of quasi-periodic pulsations in a solar post-flare cusp-shape loop with SDO/AIA // The Astrophys. J. 2012. V. 754, iss. 1, id. 43. 8 p.
- DOI: 10.1088/0004-637X/754/1/43
- Švestka Z. Optical observations of solar flares // Space Sci. Rev. 1966. V. 5, iss. 3. P. 388-418.
- DOI: 10.1007/BF02653250
- Tajima T., Sakai J., Nakajima H., et al. Current loop coalescence model of solar flares // The Astrophys. J. 1987. V. 321. P. 1031-1048.
- DOI: 10.1086/165694
- Takasao S., Shibata K. Above-the-loop-top oscillation and quasi-periodic coronal wave generation in solar flares // The Astrophys. J. 2016. V. 823, iss. 2, id. 150. 11 p.
- DOI: 10.3847/0004-637X/823/2/150
- Tan B., Yu Z., Huang J., et al. Very long-period pulsations before the onset of solar flares // The Astrophys. J. 2016. V. 833, iss. 2, id. 206. 6 p.
- DOI: 10.3847/1538-4357/833/2/206
- Tapping K.F. A torsional wave model for solar radio pulsations // Solar Phys. 1983. V. 87, iss. 1. P. 177-186.
- DOI: 10.1007/BF00151168
- Thurgood J.O. Pontin D.I., McLaughlin J.A. On the periodicity of linear and nonlinear oscillatory reconnection // Astron. Astrophys. 2019. V. 621, id. A106. 12 p.
- DOI: 10.1051/0004-6361/201834369
- Torrence C., Compo G.P. A practical guide to wavelet analysis // Bull. Amer. Meteorol. Soc. 1998. V. 79. P. 61-78. 2.0.CO;2.
- DOI: 10.1175/1520-0477(1998)079
- Trottet G., Raulin J.-P., Mackinnon A., et al. Origin of the 30 THz emission detected during the solar flare on 2012 March 13 at 17:20 UT // Solar Phys. 2015. V. 290, iss. 10. P. 2809-2826.
- DOI: 10.1007/s11207-015-0782-0
- Tsap Y.T., Smirnova V.V., Motorina G.G., et al. Millimeter and X-ray emission from the 5 July 2012 solar flare // Solar Phys. 2018. V. 293. P. 15.
- DOI: 10.1007/s11207-018-1269-6
- Tsap Yu.T., Stepanov A.V., Kopylova Yu.G., Zhilyaev B.E. Diagnostics of a flare on EQ Peg B from optical pulsations // Astron. Lett. 2011. V. 37, iss. 1. P. 49-54.
- DOI: 10.1134/S1063773710101032
- Van Doorsselaere T., Nakariakov V.M., Verwichte E. Detection of waves in the solar corona: kink or Alfvén? // The Astrophys. J. Lett. 2008. V. 676. P. L73-L75.
- DOI: 10.1086/587029
- Van Doorsselaere T., De Groof A., Zender J., et al. LYRA observations of two oscillation modes in a single flare // The Astrophys. J. 2011. V. 740, id. 90. 8 p.
- DOI: 10.1088/0004-637X/740/2/90
- Van Doorsselaere T., Kupriyanova E.G., Yuan D. Quasi-periodic pulsations in solar and stellar flares: an overview of recent results (Invited Rev.) // Solar Phys. 2016. V. 291, iss. 11. P. 3143-3164.
- DOI: 10.1007/s11207-016-0977-z
- Vaughan S. A simple test for periodic signals in red noise // Astron. Astrophys. 2005. V. 431. P. 391-403. 10.1051/ 0004-6361:20041453.
- DOI: 10.1051/0004-6361
- Wang T., Innes D.E., Qiu J. Determination of the coronal magnetic field from hot-loop oscillations observed by SUMER and SXT // The Astrophys. J. 2007. V. 656, iss. 1. P. 598-609.
- DOI: 10.1086/510424
- Wedemeyer S., Bastian T., Brajša R., et al. Solar science with the Atacama Large Millimeter/Submillimeter Array - a new view of our Sun // Space Sci. Rev. 2016. V. 200, iss. 1-4. P. 1-73.
- DOI: 10.1007/s11214-015-0229-9
- Xu Y., Cao W., Liu C., et al. Near-infrared observations at 1.56 microns of the 2003 October 29 X10 white-light flare // The Astrophys. J. 2004. V. 607, iss. 2. P. L131-L134.
- DOI: 10.1086/422099
- Zaitsev V.V., Kronshtadtov P.V., Stepanov A.V. Rayleigh-Taylor instability and excitation of super-Dreicer electric fields in the solar chromosphere // Solar Phys. 2016. V. 291. P. 3451-3459.
- DOI: 10.1007/s11207-016-0983-1
- Zaitsev V.V., Stepanov A.V., Kaufmann P. On the origin of pulsations of sub-THz emission from solar flares // Solar Phys. 2014. V. 289. P. 3017-3032.
- DOI: 10.1007/s11207-014-0515-9
- Zhdanov D.A., Zandanov V.G. Observations of microwave fine structures by the Badary Broadband Microwave Spectropolarimeter and the Siberian Solar Radio Telescope // Solar Phys. 2015. V. 290, iss. 1. P. 287-294.
- DOI: 10.1007/s11207-014-0553-3
- URL: https://legacy.helioviewer.org/ (дата обращения 11 ноября 2019 г.).
- URL: http://sdc.uio.no/sdc/ (дата обращения 11 ноября 2019 г.).
- URL: http://solar.nro.nao.ac.jp/norh/doc/manuale.pdf (дата обращения 11 ноября 2019 г.).
