Labor satisfaction as an indicator of public administration efficiency (sociological analysis)
")
Author: Leonidova Galina Valentinovna, Popov Andrei Vasilevich
Journal: Economic and Social Changes: Facts, Trends, Forecast @volnc-esc-en
Section: Social development
Article in issue: 3 (33) т.7, 2014.
Free access
Labor satisfaction is an indicator of social wellbeing of the working population. The study of subjective perceptions of labor is an important indicator of public administration efficiency. The article contains the analysis of the population’s satisfaction with labor, particularly, with one of its structural components - labor conditions. It reveals the high correlation of these indicators with the satisfaction with everyday life and labor productivity. It determines the degree of employees’ satisfaction with working conditions in such areas as health and psychological atmosphere at the workplace, equipment capability and security. The study discloses employees’ estimates in socio-demographic and territorial-dimensional aspects. The research demonstrates the interrelation between satisfaction with working environment and implementation of labor potential. The analysis indicates the importance of regular sociological research into the issues of satisfaction with various aspects of labor activity. The article indicates that for the country’s development it is necessary to take into account the labor satisfaction factor (in the narrow sense - working conditions) while developing strategies and approaches for social-economic policy and defining the standards of social responsibility, primarily, of the state and employers.
Labor conditions, injury, job satisfaction, labor productivity, labor potential, public administration efficiency, social policy
Short address: https://sciup.org/147223609
IDR: 147223609 | UDC: 331.41 | DOI: 10.15838/esc/2014.3.33.7
Text of the scientific article Labor satisfaction as an indicator of public administration efficiency (sociological analysis)
Transition to a postindustrial society in Russia challenges the system of social and labor relations, particularly, employees’ labor productivity. This has become one of the priorities of long-term government economic policy. It is no coincidence that the May Decrees of the RF President, signed by V.V. Putin on the day of his inauguration (2012), include the growth of productivity by one and a half times by 2018 (on the average by 5–6% per year) as concrete benchmarks of the Russian economy development.
However, already in October 2013 at the investment forum “Russia Calling!” V.V. Putin noted that the current pace of productivity growth (3% by the end of 2012; fig. 1 ) did “not only reduce the gap to the leaders in terms of efficiency, but actually meant conservation of the onesided economic structure and its material nature” [10].
According to the Organization for Economic Cooperation and Development (OECD), labor productivity in Russia is 24 U.S. dollars per person per hour, it comprises 39% of the U.S. level (Russia ranks the last but one; Mexico – the last) [3, p. 5]. The authorities believe that “new factors of development” can help to overcome this gap. They are the following: high quality professional education, a flexible labor market, favorable investment climate and modern technology [11]. In other words, it is required to transfer from extensive to intensive reserves of this indicator growth. The search of such reserves is the purpose of this article.
Intellectual reserves for increasing labor productivity
The main intensive reserves to boost labor productivity are, on the one hand, increased productivity of job places (introduction of advanced technology,
Figure 1. Dynamics of labor productivity indices in Russia in 2003–2012 (in % to the previous year)
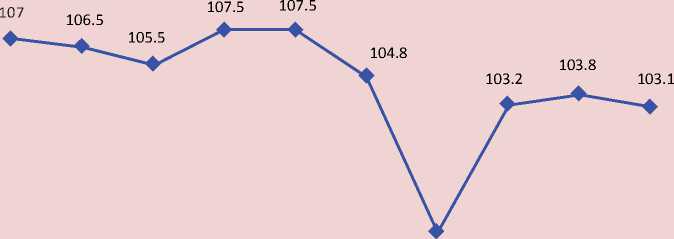
95.9
2003 2004 2005 2006 2007 2008 2009 2010 2011 2012
Source: data of the Federal State Statistics Service.
efficient manufacturing process management), on the other hand, better quality of the labor force (education and skills).
Raised productivity of job places is declared at the highest level. The May Decrees have a target: it is necessary to provide 25 million new high-performance jobs by 2018. However, it remains unclear what kind of jobs can be defined as high-performance. The OECD considers employees’ “innovativeness” as an indicator, which is mainly determined by the level of wages. According to the methodological recommendations of the Federal Statistics Service State, high-performance jobs are all “jobs at the enterprise (organization) where the average monthly wage of employees (for individual entrepreneurs – average earnings) is equal to or exceeds the set value of the indicator (the threshold value)” 1. For Russia, this indicator is clearly insufficient, as people who work not in the most high-tech industries have the highest incomes in the country. According to the experts, the recording of such job places should be carried out on the basis of their certification and assessment of their high-performance [21].
Table 1 demonstrates that the creation or modernization of high-productive job places is slow in Russia. Five federal districts have not experienced any signi-ficant changes for 5 years. Three districts (the Volga, Siberian and Ural federal districts) have a negative trend in this respect.
The study of the state of the population’s labor potential2, carried out by the Institute of Socio-Economic Development of Territories of the Russian Academy of Sciences in the Vologda Oblast since 1997, shows that according to the method of labor behavior identification3 the share of those people who are classified as “innovators” (mostly these are people who support economy modernization), is approximately 27%. When the entire working population in Russia is taken into consideration, the share amounts to about 19.2 million. However, today the number of high-productive jobs, where the “innovator’” potential is applied, is in 5 times less, which is insufficient to realize the existing intellectual potential [9, p. 142]. That is why, it is inadequate to enhance productivity in the required pace.
The monitoring of the labor potential quality, conducted by the ISEDT RAS according to the methodology of the Institute of Social and Economic Studies of Population [13, p. 25-37], measures the following structural components: physical and mental health, cognitive
Table 1. Job places (number of employees) in Russian enterprises implementing technological innovation, million places
|
Territory |
Year |
2012 to 2008, % |
||||
|
2008 |
2009 |
2010 |
2011 |
2012 |
||
|
Russian Federation |
3.84 |
3.50 |
3.38 |
3.75 |
3.85 |
100.2 |
|
Far Eastern Federal District |
0.09 |
0.13 |
0.13 |
0.14 |
0.16 |
177.7 |
|
Northwestern Federal District |
0.28 |
0.32 |
0.27 |
0.34 |
0.36 |
128.5 |
|
Central Federal District |
0.74 |
0.72 |
0.68 |
0.84 |
0.91 |
122.9 |
|
Southern Federal District |
0.19 |
0.19 |
0.19 |
0.19 |
0.19 |
100.0 |
|
North Caucasian Federal District |
0.04 |
0.04 |
0.04 |
0.03 |
0.04 |
100.0 |
|
Ural Federal District |
0.63 |
0.57 |
0.57 |
0.61 |
0.61 |
96.8 |
|
Siberian Federal District |
0.41 |
0.35 |
0.40 |
0.41 |
0.39 |
95.1 |
|
Volga Federal District |
1.19 |
1.15 |
1.06 |
1.17 |
1.17 |
89.4 |
Source: Sait Federal'noi sluzhby gosudarstvennoi statistiki [Website of Federal State Statistics Service]. Available at: free_doc/new_site/business/nauka/%5Cind_2020/
Table 2. Assessment of the labor potential quality of the population in the Vologda Oblast*
According to the monitoring results, in 1997–2012 the general trend of reduction of dynamics of the social capacity index (the integral characteristic of the labor potential quality) was positive: it ranged from 0.655 in 1997 to 0.680 points in 2012. The indices have been growing by almost all basic qualitative characteristics of the labor force. However, the significant scientific results of the study are the following: identification of long-term negative trend of employees’ intellectual development, their cognitive and creative capacities. This confirms the hypothesis that nowadays these qualities are not required in the domestic economy.
Working conditions as a basis for job satisfaction
The creation of high-productive jobs, based on the use of employees’ intellectual potential, involves qualitative transformation of the labor market, and first of all, improvement of working conditions, spread of flexible forms of employment, encouragement of creative activity, etc. Ultimately, this leads to an increase in a healthy life span, growth of human capital, in general, and labor potential, in particular [2, p. 13]. It should be emphasized that the above-mentioned transformations are closely related to job satisfaction, which is another aspect of labor productivity growth.
According to scientists, “it is simply impossible to imagine innovation economy... without such a powerful factor as job satisfaction” [8, p. 74]. This indicator characterizes the state of consciousness that produces positive reaction to the process to meet working life challenges [20, p. 33]. What is more, it provides an employee’s integrated assessment of work situations. Therefore, the concept “job satisfaction” [19] consists of estimates of, for example, the character and conditions of work that are valued negatively or positively by workers.
The interest in job satisfaction, particularly in such a structural component as working conditions, is not accidental. The reason for it lies in the fact that the task to preserve the health of the population is one of the most important in modern Russia. Its possible solution is to ensure workplace safety and to minimize losses from external causes (injuries, occupational diseases and so on). Studies show that labor potential cannot be realized to the full extent, if physical and sanitary conditions of production are unfavorable and people worry about their health and safety. “Economy of health... in Russia has led to huge demographic losses and waste of vital potential of the Russian society” [2, p. 158]. Adverse working conditions, industrial accidents and occupational diseases worsen the demographic situation in the country. Mortality rate among the working age population is excessively high: working-age adults constitute about 1/3 of all deaths during a year; it is, on average, three times higher than in developed countries and two times higher than in developing countries. Most reasons are external (accidents, poisoning, traumas).
The situation is significantly worse in Russia than in developed and developing countries ( tab. 3 ).
The report “On the results of work of the ministry of labor and social protection of the Russian Federation in 2012 and tasks for 2013” marks that today almost one in three people works in harmful conditions.
“Every year about 5.5 thousands of workers have “occupational diseases” [12].
According to the state statistics data, in 2012 the share of the employed population of the Russian Federation, working in conditions that do not meet a sanitary-hygienic standard was 27%. In the Vologda Oblast this index is more than one and
Table 3. Death rates due to external causes, per 100 thousand people
|
Country |
Year |
Relative deviation, % |
How many times is mortality in Russia higher (2010) |
|
|
2000 |
2010 |
|||
|
Russia |
224.0 |
148.2 |
66.2 |
- |
|
South Africa |
159.4 |
131.0* |
82.2 |
1.1 |
|
Brazil |
81.3 |
84.6 |
104.1 |
1.8 |
|
Republic of Korea |
79.5 |
76.2 |
95.8 |
1.9 |
|
USA |
56.1 |
59.8 |
106.6 |
2.5 |
|
Japan |
54.8 |
47.6 |
86.9 |
3.1 |
|
Sweden |
44.2 |
43.1 |
97.5 |
3.4 |
|
Germany |
40.6 |
34.6 |
85.2 |
4.3 |
|
Israel |
41.2 |
31.6 |
76.7 |
4.7 |
|
Spain |
39.4 |
27.5 |
69.8 |
5.4 |
|
* Data for 2009 Source: OECD Database. |
||||
Table 4. Certain indicators that characterize working conditions in the Russian Federation
Despite the gradual reduction, the number of production accidents in the Vologda Oblast remains the highest in the district and amounts to 3.6 people per 1000 employees, exceeding the average national level (1.9 people per 1000 employees) almost twice.
In the aspect of the types of economic activity, the number of injuries, got in the processing industries, agriculture and forestry, is increasing. The greatest number of injuries in 2012 occurred due to the impact of moving, flying apart objects and parts falling from the height, falling, collapse of items, materials, land, etc.
The main causes of severe consequences in the region in 2012 were:
-
• poor management of labor production – 32 cases;
-
• violation of a technological process – 16 cases;
-
• violation of traffic rules – 12 cases;
-
• unsatisfactory technical condition of buildings, structures, territories – 5 cases;
-
• operation of out-of-order equipment – 5 cases;
-
• poor content and shortcomings in the organization of working places – 5 [17, p. 56].
Loss of working hours, caused by temporary disability of people injured at work, involves significant socio-economic consequences. In 2008–2012 the average duration of disability per one injured in production in the Vologda Oblast increased by 19% (44.6 days) [17, p. 105]. The number of lost working days in the case of temporary disability per one injured in Russia increased in two times (from 28.4 days in 2008 to 48.4 days in 2012) [14].
Labor potential of the Russian society has not only qualitative, but also significant quantitative losses. The number of population of working age is declining, and according to the Rosstat forecast, it will decrease by almost 10% by 2030 ( tab. 5 ).
Calculations, carried out by the Institute of Socio-Economic Development of Territories of the Russian Academy of Sciences, show that the similar tendency is observed in the Vologda Oblast: by 2020 the share of this population category will be 5 p.p. less than in 2013 (54% vs. 59%) [23, p. 152].
Job satisfaction: a sociological analysis
In the job satisfaction structure one can identify aesthetic and physical environment (level of safety, noise, pollution); cultural conditions (leisure areas, functionaldomestic premises, catering facilities); mode and schedule of work; distance
Table 5. Forecast of the RF population by age groups (the average; at the beginning of the year)
|
Year |
Younger than working-age |
Of working-age |
Older than working-age |
|||
|
thousand people |
in % of total population |
thousand people |
in % of total population |
thousand people |
in % of total population |
|
|
2013 (fact) |
24110 |
16.8 |
86137 |
60.1 |
33100 |
23.1 |
|
2020 |
26214 |
18.2 |
79659 |
55.4 |
38019 |
26.4 |
|
2025 |
25888 |
18.1 |
77722 |
54.2 |
39641 |
27.7 |
|
2030 |
23871 |
16.8 |
77530 |
54.6 |
40515 |
28.6 |
|
Source: Rosstat. |
||||||
Table 6. Dynamics of answers of European countries and Russia’s respondents on the issue about job satisfaction and life (on a 11-point scale, in points)
|
Country |
Job satisfaction |
Satisfaction with life in general |
GDP per hour of working time in 2012 (U.S. dollars, PPP) |
||
|
2006 |
2012 |
2006 |
2012 |
||
|
Denmark |
7.82 |
8.20 |
8.49 |
8.57 |
45.6 |
|
Norway |
7.45 |
7.98 |
7.80 |
8.17 |
62.7 |
|
Switzerland |
7.71 |
7.97 |
7.98 |
8.23 |
40.6 |
|
Finland |
7.62 |
7.84 |
8.05 |
8.20 |
40.5 |
|
Sweden |
7.40 |
7.80 |
7.93 |
7.97 |
44.3 |
|
The Netherlands |
7.31 |
7.75 |
7.62 |
7.96 |
50.9 |
|
Belgium |
7.50 |
7.65 |
7.53 |
7.56 |
50.8 |
|
Germany |
6.90 |
7.45 |
6.85 |
7.53 |
49.2 |
|
Spain |
7.20 |
7.43 |
7.62 |
7.15 |
41.2 |
|
UK |
6.96 |
7.40 |
7.26 |
7.28 |
42.4 |
|
Poland |
6.90 |
7.55 |
6.79 |
7.15 |
23.6 |
|
Estonia |
6.92 |
7.16 |
6.47 |
6.36 |
22.3 |
|
Portugal |
6.94 |
7.06 |
5.75 |
6.29 |
28.1 |
|
Russia |
6.15 |
6.67 |
5.36 |
5.89 |
15.5 |
Note. Ranked by “Job satisfaction in 2012”.
Sources: Data of the monitoring of purposes, attitudes, values and behavior of the population in Europe (30 countries), European Social Survey, 2006 –2012; OECD Database.
from the place of residence; primary characteristics of labor (severity, intensity, difficulty) and secondary ones (monotony, intellectual or creative intensity, risk, novelty, etc.); appropriate qualification; social climate in the team; prospects of professional growth; wages and others [1, 5].
According to the monitoring of value orientations and lifestyles of the population (the research carried out by the European Social Survey on the example of 30 European countries), the indicator of job satisfaction6 as an integral characteristic of subjective perception of various aspects of employment and manufacturing situations is low (tab. 6). In 2012 the indicator value was 6.67 points, which is by 8% more than in 2006. The top of the list is occupied by Denmark and Norway [24].
The stated above characteristics determine the level of labor management, and consequently, the level of productivity in the enterprise.
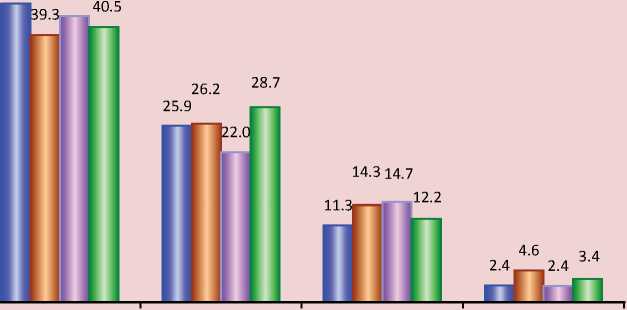
The monitoring of the labor potential quality in the Vologda Oblast indicates that in 2012 only 15% of employees were “quite satisfied” with working conditions, 40% – “rather satisfied than not”, 12% – “rather satisfied”, 3% – “very dissatisfied” and 40% “cannot say, whether they are satisfied or not” (fig. 2) .
In 2012, as in 2008, there was a significant prevalence of positive asses-sments of working conditions: 56% vs. 16% negative ones and 56% vs. 14%, respectively. So, since the crisis, satisfaction with working
Figure 2. Distribution of answers to the question: “Are you satisfied with your working conditions?” (in % of number of employees)
50,0 -1
45,0 -I
40,0 -I
35,0 -I
30,0 1
25,0 -I
18.8
16.5
20,0 1 15.5 15.2
п
15,0
10,0
5,0
0,0
43.9 42.1
15.2
I am fully satistied I am rather satisfied I cannot say whether I I am rather unsatisfied I am completely than unsatisfied am satisfied or not unsatisfied
□ 2008 г. □ 2009 г. II2011 г. □ 2012 г.
Source: hereinafter the data of the monitoring of the labor potential quality in the Vologda Oblast, ISEDT RAS, 1997–2012.
conditions has not undergone major changes: the share of positive answers has remained the same; the share of negative ones has reduced.
Residents of Cherepovets are highly satisfied with working conditions. The group of most loyal employees in the gender aspect consists of male population, in the age aspect persons under 35, in the education aspect – workers with higher and incomplete higher professional education (tab. 7) .
The research assesses working conditions on the basis of answers to the question “Evaluate your working conditions...” by the following directions: sanitary-hygienic and psychological atmosphere at the workplace, equipment capability, security. The answers were recorded using a 5-point scale, where 1 means that conditions are very poor and 5 – very good. During the period under analysis (2008–20117), positive assessment of working conditions dominate in the responses of the working population in the Vologda Oblast, and the share of negative evaluations in different years ranges from 5% to 13% (tab. 8).
The assessment dynamics shows that satisfaction with working conditions depends primarily on sanitary-hygienic conditions in the workplace. The influence of the other factors is less significant and stays approximately on the same level.
In 2011 the values decreased in practically all socio-demographic groups (tab. 9) . According to the estimates, the best conditions are characteristic of the Vologda
Table 7. Distribution of answers to the question: “Are you satisfied with your working conditions?” in different socio-demographic groups of the population (in % of the number of workers)
|
Indicator |
Group |
Answers options |
|||||
|
I am quite satisfied and rather satisfied, than not |
I cannot say whether I am satisfied or not |
I am rather not satisfied and very dissatisfied |
|||||
|
2008 |
2012 |
2008 |
2012 |
2008 |
2012 |
||
|
Territory |
Vologda |
57.6 |
56.2 |
29.5 |
29.7 |
12.9 |
14.1 |
|
Cherepovets |
67.4 |
58.8 |
18.8 |
22.5 |
13.9 |
18.6 |
|
|
Districts |
58.5 |
53.8 |
27.5 |
31.3 |
14.0 |
14.9 |
|
|
Gender |
Men |
59.3 |
58.5 |
27.9 |
28.4 |
12.8 |
13.1 |
|
Women |
61.5 |
53.1 |
23.8 |
28.9 |
14.7 |
18.1 |
|
|
Age |
Up to 35 years |
56.9 |
56.1 |
28.0 |
26.8 |
15.1 |
17.0 |
|
Over 35 years |
63.2 |
55.3 |
24.3 |
30.5 |
12.5 |
14.2 |
|
|
Education |
Pre-secondary and secondary |
46.0 |
44.6 |
34.6 |
33.8 |
19.3 |
21.7 |
|
Vocational secondary education |
64.0 |
57.3 |
20.4 |
30.6 |
15.6 |
12.1 |
|
|
Higher and incomplete higher |
68.0 |
62.1 |
24.1 |
23.7 |
7.8 |
14.1 |
|
Table 8. Distribution of the working population’s estimates of their working conditions, %
|
Answer option |
Sanitary-hygienic atmosphere |
Psychological atmosphere |
Equipment capability |
Security |
||||||||
|
2008 |
2009 |
2011 |
2008 |
2009 |
2011 |
2008 |
2009 |
2011 |
2008 |
2009 |
2011 |
|
|
Good and very good |
48.2 |
46.0 |
50.5 |
48.8 |
49.7 |
45.3 |
50.0 |
49.3 |
46.8 |
49.0 |
48.1 |
44.6 |
|
Satisfactory |
42.6 |
43.9 |
39.6 |
46.1 |
42.1 |
45.6 |
41.0 |
41.3 |
43.0 |
42.8 |
41.2 |
42.8 |
|
Bad and very bad |
9.2 |
10.2 |
9.9 |
5.0 |
8.2 |
9.1 |
9.1 |
9.3 |
10.2 |
8.1 |
10.7 |
12.7 |
Table 9. Evaluation of working conditions of different socio-demographic groups of the working population, the average (a 5-point ordinal scale)
However, inappropriate working conditions are among three most significant reasons to change a job (after low wages and personal circumstances) [9, p. 120].
The results of the monitoring of labor potential quality demonstrate that almost all qualitative characteristics of labor potential are realized most fully in the case, if employees are satisfied with working conditions (tab. 10) .
The only exception is physical health due to combined influence of hard work on the functional systems of a human body. Polls show that the fullest realization of person’s intellectual qualities (indicators of creative and cognitive potentials) and employee’s social claims is possible in favorable working environment.
Respondent mark that when they work by speciality obtained in an institution of vocational education, they are more satisfied (there are twice more people who agree with it).
Some foreign studies indicate that satisfaction (dissatisfaction) with working conditions has a significant impact on life quality of the working population, which is mainly reflected in the satisfaction of everyday life [24, 25]. The correlation analysis confirms the existence of sustainable connection between these indicators (it is known that the closer the value of the correlation coefficient to 1 is, the stronger the relationship between two random variables is). The data, presented in table 11 , shows that people, satisfied with life in general, are more satisfied with their work. The correlation coefficient value between these indices is increasing (from 0.591 in 2008 to 0.622 points in 2011). There is a bit different relation between indicators “satisfaction with life” and “satisfaction with working conditions”: the correlation coefficient value is lower than in the previous case, but the relation between these indicators is also significant.
Table 10. Realization of labor potential components in comparison with satisfaction with working conditions in 2012 (in % of the number of workers)
|
Qualitative characteristics of labor potential |
Quite satisfied and rather satisfied, than not |
Can not say whether I am satisfied or not |
Rather not satisfied and very dissatisfied |
|
Physical health |
80.7 |
78.9 |
82.0 |
|
Mental health |
83.0 |
75.9 |
79.8 |
|
Cognitive potential |
82.4 |
73.6 |
71.9 |
|
Creative potential |
73.9 |
65.2 |
61.2 |
|
Sociability |
85.3 |
77.8 |
80.5 |
|
Cultural level |
83.2 |
75.8 |
75.8 |
|
Moral level |
82.9 |
75.4 |
77.8 |
|
Need for achievement |
75.2 |
67.7 |
74.1 |
Table 11. Relation between satisfaction with working conditions and life in general (correlation coefficient)
|
Component |
Satisfaction with working conditions |
Satisfaction with work |
||||
|
2008 г. |
2009 г. |
2011 г. |
2008 г. |
2009 г. |
2011 г. |
|
|
Satisfaction with life |
0,588 |
0,491 |
0,516 |
0,591 |
0,652 |
0,622 |
|
Source: authors’ calculations. |
||||||
Therefore, employees’ positive perception of working conditions and work in general involves positive changes in the assessments of their own lives.
Thus, the analysis shows the importance of working conditions in the worker’s life. Obviously, skilled labor is possible only when the employee is satisfied with the surrounding environment, sanitary-hygienic and psychological environment, technical equipment and security. The research conducted by American social psychologist F. Herzberg [26] discloses that working conditions are not a motivating factor (along with wages, relationship with the staff, enterprise’s policy, etc.), and serve as a means to avoid dissatisfaction (hygiene factors). Therefore, improving the quality of job places is among the priority tasks to increase workers’ labor contributions.
In developed countries there is a situation when job satisfaction is one of the main motivators for efficient work ahead of career development and higher wages. The main reason for it is that in foreign labor markets there is a great number of highly skilled jobs that provide decent remuneration. Despite the state’s attempts to influence the quality of job places in Russian economy labor has a routine character and low performance.
The importance of human potential increases in modern economy. Moreover, increased attention is paid to social factors of production. There is a growing understanding that man is not only an objective, but also a condition of socio-economic development. Trends of economic development, current structural changes raise the requirements to the quality of labor force and the role of employees. Their qualifications and skills should meet international standards. It results in a different approach to satisfy social needs of the working population. Health protection is in focus due to social (quality of life) and economic (performance) considerations [22].
In recent decades the concept “decent work” is accepted by economists to identify “the quality of working life” that gives a fresh look at the problem of working conditions [15; 16]. “The Concept of decent work”, developed by the International Labor Organization (ILO), defines the safety of a workplace and high labor productivity as key components of social and labor sphere.
Modern realities dictate the necessity to take into account the factors promoting job satisfaction (in the narrow sense – working conditions) when developing the strategies and tactics of socio-economic policy.
Close relations between employee’s health state and working conditions make the employers care about workers’ health. Health care is one of the options of the state and employers’ social responsibility in the context of social policy. Ensuring safe working conditions and preventing occupational injuries requires employers’ unconditional performance of their obligations. They should take stringent control measures on labor protection. Employers should follow certain social standards set both at the national and international level, which, in turn, involves the development of new approaches to social policy. In our opinion, the role of international organizations and agreements, especially the ILO, is crucial, as they guarantee social and labor norms and standards at the international level within their competence and thus promote sustainable development. That is why, the measures, encouraging employers to improve working conditions, can become effective if the Federal Law “On compulsory social insurance against accidents and diseases” is optimized according to specific conditions of production [6]. The study of working population’s satisfaction with work is necessary at the state level to develop the balanced policy of employment and social protection and at the level of individual enterprises to produce programs of attraction, selection, retention and motivation of employees, impact on their loyalty.
The list of critical values [4] of socioeconomic development indicators has such estimative indicators as a level of satisfaction with health services or satisfaction with the level of obtained education. We consider it appropriate to extend this list by the assessments of satisfaction with working conditions, with the extremely critical value being 7–8 points (at the estimate level of developed countries). It should be a target in strategic programs for territorial development, ultimately leading to the greater efficiency of public administration.
Sited works
-
1. Ankudinov A.B., Belyaeva M.N., Lebedev O.V. Satisfaction with Work and its Determinants: Results of Statistical Modelling on Panel Data. Sociological Studies , 2013, no.11, pp. 75-83.
-
2. Veselkova I.N. Health and Labor Potential of the Population of Russia. Population Policy: the Present and the Future: Fourth Valentei Readings: Collection of Reports. Ed. by V.V. Elizarov, V.N. Arkhangel’skii. Moscow: MAKS Press, 2005. Pp. 154-159.
-
3. High-Performance Workplaces in the Regions of Russia: Executive Summary. The Chamber of Commerce and Industry of the Russian Federation, Rating Agency “Expert”. Moscow: TPP-Inform, 2013. 27 p.
-
4. Glaz’ev S.Yu., Lokosov V.V. Assessment of the Critical Values of Indicators of the Russian Society State and their Use in the Management of Socio-Economic Development. Herald of the Russian Academy of Sciences , 2012, no.7, pp. 587-604.
-
5. Il’yasov F.N. Labor Satisfaction (Structure Analysis, Measurement, Connection with Production Behavior) . Ed. by V.G. Andreenkov. Ashkhabad: Ylym (Nauka), 1988. 100 p.
-
6. Kulikova M. A. Working Conditions and their Influence on Quality of Life. Socio-Economic Phenomena and Processes , 2009, no.2, pp. 75-78.
-
7. Leonidova G.V., Chekmareva E.A. Labor Potential of the Region: Final Research Report . Vologda, 2009. 117 p.
-
8. Monusova G.A. Labor Satisfaction: Inter-Country Comparisons. World Economy and International Relations , 2008, no. 12, pp. 74-83.
-
9. Problems of Efficiency of State Management. Human Capital of the Territory: Problems of Formation and Use . Ed. by A.A. Shabunova. Vologda: ISERT RAN, 2013. 184 p.
-
10. Putin V.V. Speech and Answers to the Questions at the Investment Forum “Russia Is Calling”: October 2, 2013 . Available at: http://pda.kremlin.ru/news/19351
-
11. Putin V.V. Annual Address of the President of the Russian Federation to the Federal Assembly, December 12, 2013 . Available at: http://kremlin.ru/transcripts/17118
-
12. E nlarged Meeting of Collegium of the Ministry of Labor “On the Results of Work of the Ministry of labor and Social Protection of the Russian Federation in 2012 and Tasks for 2013 of April 12, 2013 . Available at: www.rosmintrud.ru
-
13. Rimashevskay N.M. Ways of Increasing the Quality of Labor Potential in Modern Russia. Population , 2011, no.1, pp. 25-37.
-
14. Labor Market, Employment and Wages . Available at: http://www.gks.ru/wps/wcm/connect/rosstat_ main/rosstat/ru/statistics/wages/
-
15. Sankova L.V., Pavlova E.A., Esipov A.S. Decent Labor as a New Dimension of the Quality of Working Life: Regional Aspect. The Caspian Region: Politics, Economics, Culture , 2012, no.1, pp. 105-110.
-
16. Somavia Kh. Labor as Means of Fighting Poverty. Man and Labor , 2003, no.7, pp. 16-17.
-
17. State of Conditions and Labor Protection in the Vologda Oblast: Regional Overview . Available at: http:// www.depzan.info/Regionaln_obzor.docx
-
18. Tikhonova G.I., Churanova A.N., Gorchakova T.Yu. Work Accidents as a Problem of Socio-Labor Relations in Russia. Forecast Issues, 2012, no.3, pp. 103-117.
-
19. Labor Satisfaction and Social Satisfaction. Available at: http://www.center-yf.ru/data/stat/ Udovletvorennost-trudom-i-socialnaya-udovletvorennost.php (23.05.2014)
-
20. Kharchenko K.V. Diagnostic of Labor Satisfaction while Regulating Socio-Labor Relations. Sociological Studies , 2009, no.7, pp. 32-38.
-
21. According to the Rosstat, the Higher the Salary is, the more Innovation is . Available at: http://rbcdaily . ru/economy/562949989588992 (26.05.2014)
-
22. Chubarova T.V. Social Responsibility in the Market Economy: Employee, Business, State: Monograph . Saint Petersburg: Nestor-Istoriya, 2011. 318 p.
-
23. Shabunova A.A., Kalachikova O.N., Lastochkina M.A. Demographic Evolution Trends and Prospects in Russia and the Vologda Oblast. Economic and Social Changes: Facts, Trends, Forecast, 2012, no.5, pp. 143-153.
-
24. Delhey J. Life Satisfaction in the Enlarged Europe. Available at: www.eurofound.europa.eu/ pubdocs/2003/108/en/1/ef03108en.pdf
-
25. Drobni c S., Beham B., Pr a g P Good Job, Good Life? Working Conditions and Quality of Life in Europe. Social Indicators Research. An International and Interdisciplinary Journal for Quality-of-Life Measurement , 2010, vol. 99, pp. 205-225.
-
26. Herzberg F. One more time: how do you motivate employees? Harvard Business Review , 1987, vol. 65, pp. 109-120.
References Labor satisfaction as an indicator of public administration efficiency (sociological analysis)
- Ankudinov A.B., Belyaeva M.N., Lebedev O.V. Udovletvorennost’ rabotoi i ee determinanty: rezul’taty statisticheskogo modelirovaniya na panel’nykh dannykh . Sotsiologicheskie issledovaniya , 2013, no.11, pp. 75-83.
- Veselkova I.N. Zdorov’e i trudovoi potentsial naseleniya Rossii . Politika narodonaseleniya: nastoyashchee i budushchee: Chetvertye Valenteevskie chteniya: sb. dokladov/pod red. V.V. Elizarova, V.N. Arkhangel’skogo . Ed. by V.V. Elizarov, V.N. Arkhangel’skii. Moscow: MAKS Press, 2005. Pp. 154-159.
- Vysokoproizvoditel’nye rabochie mesta v regionakh Rossii: analiticheskaya zapiska . Torgovo-promyshlennaya palata Rossiiskoi Federatsii; Reitingovoe agentstvo “Ekspert” . Moscow: TPP-Inform, 2013. 27 p.
- Glaz’ev S.Yu., Lokosov V.V. Otsenka predel’no kriticheskikh znachenii pokazatelei sostoyaniya rossiiskogo obshchestva i ikh ispol’zovanie v upravlenii sotsial’no-ekonomicheskim razvitiem . Vestnik RAN , 2012, no.7, pp. 587-604.
- Il’yasov F.N. Udovletvorennost’ trudom (analiz struktury, izmerenie, svyaz’ s proizvodstvennym povedeniem) . Ed. by V.G. Andreenkov. Ashkhabad: Ylym (Nauka), 1988. 100 p.
- Kulikova M. A. Usloviya truda i vliyanie ikh na kachestvo zhizni . Sotsial’no-ekonomicheskie yavleniya i protsessy , 2009, no.2, pp. 75-78.
- Leonidova G.V., Chekmareva E.A. Trudovoi potentsial regiona: zaklyuchitel’nyi otchet o NIR . Vologda, 2009. 117 p.
- Monusova G.A. Udovletvorennost’ trudom: mezhstranovye sopostavleniya . Mirovaya ekonomika i mezhdunarodnye otnosheniya , 2008, no. 12, pp. 74-83.
- Problemy effektivnosti gosudarstvennogo upravleniya. Chelovecheskii kapital territorii: problemy formirovaniya i ispol’zovaniya . Ed. by A.A. Shabunova. Vologda: ISERT RAN, 2013. 184 p.
- Putin V.V. Vystuplenie i otvety na voprosy na investitsionnom forume “Rossiya zovet”: 2 oktyabrya 2013 goda . Available at: http://pda.kremlin.ru/news/19351
- Putin V.V. Ezhegodnoe Poslanie Prezidenta Rossiiskoi Federatsii Federal’nomu Sobraniyu 12.12.2013 . Available at: http://kremlin.ru/transcripts/17118
- Rasshirennoe zasedanie kollegii Mintruda Rossii “Ob itogakh raboty Ministerstva truda i sotsial’noi zashchity Rossiiskoi Federatsii v 2012 godu i zadachakh na 2013 god” ot 12 aprelya 2013 g. . Available at: www.rosmintrud.ru
- Rimashevskay N.M. Puti povysheniya kachestva trudovogo potentsiala v sovremennoi Rossii . Narodonaselenie , 2011, no.1, pp. 25-37.
- Rynok truda, zanyatost’ i zarabotnaya plata . Available at: http://www.gks.ru/wps/wcm/connect/rosstat_main/rosstat/ru/statistics/wages/
- Sankova L.V., Pavlova E.A., Esipov A.S. Dostoinyi trud kak novoe izmerenie kachestva trudovoi zhizni: regional’nyi aspekt . Kaspiiskii region: politika, ekonomika, kul’tura , 2012, no.1, pp. 105-110.
- Somavia Kh. Trud kak sredstvo bor’by s bednost’yu . Chelovek i trud , 2003, no.7, pp. 16-17.
- Sostoyanie uslovii i okhrany truda v Vologodskoi oblasti: regional’nyi obzor . Available at: http://www.depzan.info/Regionaln_obzor.docx
- Tikhonova G.I., Churanova A.N., Gorchakova T.Yu. Proizvodstvennyi travmatizm kak problema sotsial’no-trudovykh otnoshenii v Rossii . Problemy prognozirovaniya , 2012, no.3, pp. 103-117.
- Udovletvorennost’ trudom i sotsial’naya udovletvorennost’ . Available at: http://www.center-yf.ru/data/stat/Udovletvorennost-trudom-i-socialnaya-udovletvorennost.php (23.05.2014)
- Kharchenko K.V. Diagnostika udovletvorennosti trudom pri regulirovanii sotsial’no-trudovykh otnoshenii . Sotsiologicheskie issledovaniya , 2009, no.7, pp. 32-38.
- Chem vyshe zarplata, tem bol’she innovatsii, schitayut v Rosstate . Available at: http://rbcdaily.ru/economy/562949989588992 (26.05.2014)
- Chubarova T.V. Sotsial’naya otvetstvennost’ v rynochnoi ekonomike: rabotnik, biznes, gosudarstvo: monografiya . Saint Petersburg: Nestor-Istoriya, 2011. 318 p.
- Shabunova A.A., Kalachikova O.N., Lastochkina M.A. Tendentsii i perspektivy demograficheskogo razvitiya Rossii i Vologodskoi oblasti . Ekonomicheskie i sotsial’nye peremeny: fakty, tendentsii, prognoz , 2012, no.5, pp. 143-153.
- Delhey J. Life Satisfaction in the Enlarged Europe. Available at: www.eurofound.europa.eu/pubdocs/2003/108/en/1/ef03108en.pdf
- Drobnič S., Beham B., Präg P. Good Job, Good Life? Working Conditions and Quality of Life in Europe. Social Indicators Research. An International and Interdisciplinary Journal for Quality-of-Life Measurement, 2010, vol. 99, pp. 205-225.
- Herzberg F. One more time: how do you motivate employees? Harvard Business Review, 1987, vol. 65, pp. 109-120.
