LDASpike for Recognizing Epileptic Spikes in EEG

Author: Anup Kumar Keshri, Aishwarya Singh, Barda Nand Das, Rakesh Kumar Sinha
Journal: International Journal of Information Engineering and Electronic Business(IJIEEB) @ijieeb
Article in issue: 4 vol.5, 2013.
Free access
Manual processing of recorded EEG data for characteristics like epileptic spikes is very time consuming since the recording of EEG for a longer duration producing enormous amount of data. Therefore, automated systems are required to speed up the processing. In the current work, a classification method has been proposed for detecting the epileptic spikes in the recorded EEG data by using Linear Discriminant Analysis (LDA) and has been named LDASpike. The prerecorded EEG data files were used as input to LDASpike and the output produced was the total number of spikes present in each EEG file. The proposed method results on an average sensitivity 100% and selectivity 95.38%, when the training and testing data were same. However, with four fold cross-validation applied in this work, the sensitivity and selectivity were achieved as 98.45% and 96.06%, respectively, on an average. Though a little time initially is spent to train the system but the result produced by the system is very promising and can be compared with the existing standard methods. This system can also works with the real time recording and processing for a clinical setup.
Automated classification, Electroencephalogram, Epileptic Spikes, Linear Discriminant Analysis
Short address: https://sciup.org/15013196
IDR: 15013196
Text of the scientific article LDASpike for Recognizing Epileptic Spikes in EEG
Published Online October 2013 in MECS
Epilepsy is a very commonly found chronic neurological disorder. It is the tendency to have recurrent seizure, which tends to occur spontaneously. It affects people of all ages, races, social classes and ability groups. Epilepsy is not only very harmful but delayed treatment may lead to death of the person suffering with it [1] [2]. Moreover, epilepsy cannot be cured completely but it can be controlled. In the brain signal or electroencephalogram (EEG), this disorder is primarily reflected as spike patterns. These spikes are a symptom of abnormal neuronal activity that takes place in the brain. The epileptic spikes are seen as very sharp changes in the EEG amplitude in a short interval of time. So, the recognition of these patterns becomes important for providing a better treatment to the patient suffering with epilepsy.
Manual searching for a particular characteristic like spikes present in EEG records, becomes very time consuming due to voluminous nature of EEG data. Since human errors cannot be ignored therefore, manual inspection is inefficient and inaccurate too. Considering these limitations of manual processing of EEG data, to recognize the spike pattern present in EEG in real time, automated systems are needed. These automated systems helps doctors and clinicians in taking correct and fast decision related to the treatment of the patient of epilepsy. A large number of methods have been developed for the detection of epileptic spikes. Earlier a number of methods based on several statistical approaches had been proposed [3] [4] [5]. The recognition rates of epileptic spike obtained from these statistical methods was not very satisfactory. Fuzzy logic based algorithms was proposed by Inan and co-workers [6] promises a better recognition rate of EEG spike. Time frequency analysis and wavelet transform have been applied successfully for automatic recognition of epileptic spike in EEG [7] [8] [9] [10] [11] [12]. The application of artificial neural network (ANN) along with wavelet transform and genetic algorithm is widely found in epileptic spike recognition procedures [12] [13] [14] [15] [16] [17]. However, application of these soft-computing tools for spike recognition is having there on merits as well as limitation. No doubt they produce better spike recognition rate than the statistical methods used earlier but the ANN based system, initially must be given intensive training. The wavelet transform is applied on a window of specified size of EEG data and need more computation, make it not suitable for using in real time system. Genetic algorithm is one of the best optimization technique found in engineering but there direct application in signal for pattern recognition is difficult.
Recently, some other non-conventional computing approaches have also been demonstrated that shown competitive results compared to the traditional soft computing approaches in recognition of epileptic spikes. Among them, the Deterministic Finite Automata (DFA) based automated epileptic spikes recognition approaches have demonstrated to have very fast and good spike recognition rate[18] [19] [20] [21] [22]. In another approach, a method for spike detection by eliminating the false positive present in the data, instead of concentrating on the characteristics of the spike patterns has also been proposed[23]. The results that were obtained using these methods were impressive and better than those achieved by prior methods. These methods have added advantages of requirement of very less computation make them suitable for application in real time systems. However, the higher recognition rate of epileptic spike pattern is still a big question.
A review of available literature revealed that Linear Discriminant Analysis (LDA) and its variants are widely used to solve the complex classification problems associated with the highly non-linear and dynamic brain signals. With equal covariance matrix for two classes, LDA assumes normal distribution of the data and effectively maximizes the distance between two class means and minimizes the interclass variance. This technique has a very low computational requirement that presents it as a suitable tool for the online and real-time classification problem[24] [25]. Large number of applications of LDA has been observed with EEG signals in the area of Brain-Computer Interfaces (BCI). However, instead of its effective application as event classifier in EEG, the application of LDA in epileptic spike recognition is still very scanty[26] [27] [28].
Considering the merits of LDA in brain-signal classification tasks, in the present work, an LDA based classification method, the LDASpike is proposed for the identification of epileptic spikes.
-
2.1 Data recording and preprocessing
The pre-recorded data were taken from Sinha et al.[15] was used in this study. The brief methodology for EEG spike generation as well as data recording procedure is presented here. The EEG data files containing experimentally generated epileptic spikes were recorded from male Charles Foster rats weighing between 200250 grams. EEG recording electrodes were implanted on the rat’s head under Urethane (Sigma, USA) anesthesia (1.5 gm/kg i.p.). To induce epileptic seizures, 50 units of Benzyl Penicillin in a volume of 10 ml were injected 2
-
2.2 Linear Discriminant Analysis (LDA)
-
2.3 Design of LDASpike
mm below the cortical surface of the parietal region of the brain. The intracerebral injection of the above mentioned dose of Benzyl Penicillin induces spontaneous seizure initiation just after 3-5 minutes of injection. Three stainless steel screw electrodes of 1 mm diameter soldered with flexible radio wires were implanted extradurally. Two electrodes for EEG recordings were placed on the frontal and occipital part of the skull and one reference electrode was placed on the anterior most part of the skull.
The EEG signals were recorded for two minutes in separate data files to the computer hard disk after digitization of the traces at 256 samples/second. The data were collected using the Visual Lab-M software (ADLink Technology Inc., Taiwan). Following the recording, whole data were preprocessed for removal of baseline shift and band pass filtered using an infinite impulse response (IIR) 4th order Butterworth filter with a lower cutoff of 0.25 Hz and a higher cutoff of 35 Hz[29] [30]. For the present work, the data files containing epileptic spike patterns were selected, while the seizure patterns were ignored intentionally. The experimental procedures in this study had been conducted in compliance with the committee for the purpose of control and supervision of experiments on animals, India as well as with internal institutional policies and guidelines.
The LDA is a linear feature extraction method commonly known as ‘Fisher’s Linear Discriminant’[31] [32]. It is a statistical approach for supervised dimensionality reduction and classification. The LDA computes an optimal transformation (projection) by minimizing the within-class distance and maximizing the between-class distance simultaneously, thus achieving maximum class discrimination. The optimal transformation in LDA can be readily computed by applying Eigen decomposition on the so-called scatter matrices[33]. It has been used widely in many applications involving high-dimensional data. It easily handles the cases, where the within-class frequencies are unequal and their performances have been examined on randomly generated test data. This method maximizes the ratio of between-class variance to the within-class variance in any particular data set thereby guaranteeing maximal separability. The main objective of LDA is to perform dimensionality reduction while preserving as much of the class discriminatory information as possible. It is conventionally accepted that the LDA works efficiently with normally distributed data. Hence, the nature of the recorded EEG data was tested and the test sample for one data file is presented in figure 1. It can be observed that the histogram plotting of the data shows the desired bell-shape pattern.
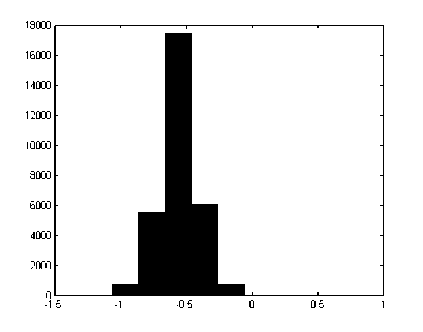
Figure 1: Histogram plotting of a sample EEG data file used in the training and testing of the LDASpike.
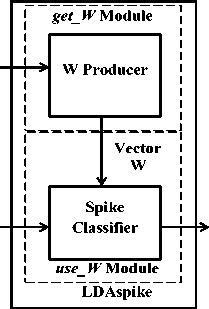
In the current work, a system based on LDA has been designed to recognize the epileptic spikes. For the purpose of classification, LDA finds a vector so that the samples in the classes are best separated. This vector can then be used for classifying other samples as well. In order to design an LDA based classifier, firstly, the direction (or vector) called projection vector (W) must be calculated on which the features in a sample will be projected, and secondly, a threshold value (YT) obtained after projection should be selected that will best distinguish the samples. Therefore, the design procedure of the spike data classifier LDASpike contains the method of obtaining W and YT. The design and functionality of the LDASpike are divided into two modules ‘get_W Module’ and ‘use_W Module’ as shown in figure 2. The complete functionality of the LDASpike has been presented in Appendix – 1.
Training Data (40 samples of spike and nonspike data each)
EEG data
Details of classified Spike data
Figure 2: Block diagram of classifier LDASpike.
-
(a) get_ W Module: In this module, the projection vector ‘ W ’ and the threshold value ‘ Y T ’ are calcu lated. To obtain the ‘ W ’ and ‘ Y T ’, first two classes of EEG data viz. ‘ Spike_EEG ’ and ‘ Non_Spike EEG ’, were created. The class ‘ Spike_EEG ’ contains EEG data with spike pattern and the ‘ Non_Spike EEG ’ class contains EEG background data. By plotting the EEG data in a graph
using any available tool like MS-Excel, Spike patterns can easily be identified. From the observations, it was found that the average duration of a spike pattern contains 36 contiguous data points in it. Therefore, a subset (36 data points) of recorded EEG that lies in a spike pattern was taken as an element for the ‘ Spike_EEG ’ class. Such forty samples of spike patterns for class ‘ Spike_EEG ’ were collected. In a similar manner, forty samples of non-spike EEG data, i.e ., background EEG data of 36 data points each were chosen for the ‘ Non_Spike EEG ’ class.
Four features are selected from each sample to yield a new sample. The features that were chosen are as follows:
-
• Mean Absolute Value is the ratio of sum of the magnitude of EEG amplitude to the number of data points ( i.e. , 36).
-
• Mean Value is the ratio of sum of EEG amplitude to the number of data points ( i.e. , 36).
-
• Positive Slope Change is the total number of lines connecting two consecutive data points in a sample for which the value of slope is greater than ‘tan 85º’[18] [19] [20]
.
-
• Negative Slope Changes is the number of lines connecting two consecutive data points in a sample for which the value of slope is less than ‘-tan 85º’[18] [19] [20]
.
These parameters were selected for epileptic spike recognition as the similar types of statistical parameters have been used earlier [16]. Further, it has been statistically analyzed that, these parameters have significant differences in spike patterns in comparison to the background EEG. For each element of the two classes ‘Spike_EEG’ and ‘Non Spike EEG’, the above mentioned four features were calculated and stored in two 40 × 4 matrices ‘X1’ and ‘X2’ respectively. Each row of ‘X1’ and ‘X2’ matrices contains the four features of corresponding elements of the classes ‘Spike_EEG’ and ‘Non_Spike EEG’. The average of four features stored in matrices ‘X1’ and ‘X2’ was calculated and stored in two 1×4 matrices ‘u1’ and ‘u2’ using the following equations:
u 1 =mean( X 1 ) and (1)
u 2 =mean( X 2 ) (2)
Where, mean ( ) is a function that calculates the average column wise in a matrix for all columns.
In the next step, the calculated mean matrices were subtracted row wise for each sample in classes ‘X1’ and ‘X2’ for zero-error correction as:
X1 = X1 – u1 and(3)
X2 = X2 – u2(4)
After subtracting the average from each sample, transpose of ‘X1’ and ‘X2’ was calculated as follows:
TX1 = transpose(X1) and(5)
TX2 = transpose(X2)(6)
Where, transpose( ) is a function that yields transpose of a matrix. In the next step the scatter matrices ‘S1’ and ‘S2’ of size 4 × 4 were calculated as:
S1 = TX1 × X1 and(7)
S2 = TX2 × X2(8)
Next calculation gives a within class scatter matrix ‘ S w ’ of size 4 × 4.
Sw = S1 + S2(9)
Once ‘Sw’ is obtained, the projection vector ‘W’, which is a 4 × 1 matrix, was obtained using the following equation:
W = inverse(Sw) × transpose(u1 – u2)(10)
Where, inverse( ) function yields the inverse of a matrix.
Such obtained projection vector ‘W’ was then converted to a unit vector by dividing it with its magnitude as shown below:
W = W / norm(W) (11)
Where, norm( ) function gives the magnitude of a vector.
The transpose of matrices is done to ensure that the matrices are comfortable for multiplication. Thus, the calculated unit vector ‘W’ is our projection vector upon which the four calculated features of an EEG sample of 36 contiguous data point will be projected. Next task is to find the value of ‘YT’, which will best separate the spike and non-spike EEG data on ‘W’.
To obtained the value of ‘YT’, now the EEG data from the test data files were projected on the projection vector ‘W’ by taking a window of 36 contiguous data points at a time. The projection values ‘Y’ for a window of 36 contiguous data point of EEG data was obtained by calculating its four features and multiplying it with the transpose of the projection vector ‘W’ as shown below.
Y = transpose( W ) × X (12)
Where, ‘X’ is a 4×1 matrix made up of four features calculated from the widow of 36 contiguous data points of EEG.
In the same manner, entire EEG data of the test data file was projected on the projection vector ‘W’. Different values of ‘Y’ that were considered for ‘YT’ and for each considered value of ‘YT’ the number of recognized spikes by the LDASpike was recorded. The same procedure was applied for all the EEG data files, which were used for training purposes. The 4-fold cross validation method has been applied for training and testing of LDASpike. In this way each data file was tested twice (with different training sets) when they were not used for training. For each test data files, the number of spikes present was also counted manually that are listed in the same table. It was observed that the
LDASpike produces optimized results for spike recognition using value ‘YT’ = 0.9.
Thus, the projection vector ‘W’ and the threshold value ‘YT’ were obtained. These obtained parameters are sent to the use_W Module, where they are used for recognition of the spike present in the EEG data.
-
(b) use_W Module: In this module, the projection vector ‘ W ’ and the threshold value ‘ Y T ’ obtained in the get_W module are used for spike recognition. The input EEG data file is processed and the occurrences of the spike in it are recorded. At the end of processing of the EEG data file, a report is generated that contains information about the recorded EEG spike.
-
2.4 Design of LDASpike
The spike recognition process starts with an objective of obtaining the projection vector ‘W’ that will result in an optimized classification of the inputs. And the threshold value ‘YT’. The method of calculating ‘W’ and ‘YT’ is described above in the design of LDASpike module. After ‘W’ and ‘YT’ were obtained, samples were taken from each EEG data file. The window was positioned at the start of the file and the four features that have been listed before were extracted from the data present in that window. These four features serve as an input sample ‘X’ for the LDASpike. Inside the LDASpike, these four features are projected onto the vector ‘W’. Based upon the threshold value ‘YT’ that was previously chosen, the decision is made whether the input sample ‘X’ represents a spike or a non-spike pattern. If the sample contained a spike pattern, the start and the end index of the window was noted. Then next window from the EEG data file is selected by shifting it 36 data point to the right and same procedure is applied. There is a possibility that a spike was chopped partially into two contiguous windows. In such cases the LDASpike will recognize both the windows as windows containing spike though effectively only one spike is present in the data. In such cases only one of the spikes was counted.
TABLE 1: Confusion Matrix for a sample test data file 2.DAT having ‘spike’ and ‘non-spike’ classes.
|
Predicted Class |
|||
|
spike |
non-spike |
||
|
Actual Class |
spike |
31 |
0 |
|
non-spike |
1 |
3101 |
|
|
Keys: |
|||
|
True positive (tp) |
31 |
||
|
True negative(tn) |
3101 |
||
|
False positive(fp) |
1 |
||
|
False negative(fn) |
0 |
||
-
• True positive (tp) – The number of spikes counted manually is ‘tp’ or the number of spikes counted correctly by the LDASpike
-
• True negative (tn) – The number non-spike window counted by the LDASpike
-
• False positive (fp) – The number of non-spike data counted as spike
-
• False negative (fn) – The number of spike patterns recognized as non-spike data
-
• These parameters are further used for the calculations of following performance indicators[35] [36]:
No. of spikes counted by LDASpike = tp + fp (13)
Sensitivity (Se) = tp / (tp + fn) (14)
Selectivity (Sl) = tp / (tp + fp) (15)
-
III. RESULTS
The LDASpike broadly works in two steps. First, it takes samples of 40 spike and 40 non-spike data from the EEG data files used for training, extracts the required features and finds the projection vector ‘W’ and then, a threshold value ‘YT’ is chosen in the second part. Once these parameters are calculated, EEG data files are given as input to the LDASpike, It counts the number of spikes present in it. In two different ways, the LDASpike was trained and tested.
In the first method, it was trained with the sample taken from all the 10 EEG data files. During the training when the projection vector ‘W’ was obtained, the data from the training set were projected on it and for different value of ‘Y’, taken as ‘YT’ the number of spike recognized by the LDASpike was recorded as presented in the table 2. In the second method, the LDASpike was trained and tested with 4-fold cross validation method, where the different data sets have been used for training and test purposes. During the training, several values of ‘Y’, were considered for ‘YT’ and for each considered value, the number of recognized spike was recorded as given in table 3.
TABLE 2: Details of spike recognized by LDASpike for different values of Y , when the same set of data files was used for training and testing.
|
File Name |
Manually Counted |
LDASpike Count |
||||||
|
Y =0.8 |
Y =0.9 |
Y =1.0 |
Y =1.1 |
Y =1.2 |
Y =1.3 |
Y =1.4 |
||
|
1.DAT |
38 |
39 |
39 |
39 |
38 |
38 |
38 |
38 |
|
2.DAT |
32 |
33 |
33 |
33 |
32 |
32 |
32 |
30 |
|
3.DAT |
23 |
26 |
26 |
24 |
24 |
23 |
23 |
18 |
|
4.DAT |
21 |
22 |
21 |
21 |
21 |
21 |
19 |
15 |
|
5.DAT |
19 |
19 |
19 |
19 |
19 |
19 |
19 |
14 |
|
6.DAT |
19 |
19 |
19 |
19 |
19 |
19 |
19 |
16 |
|
7.DAT |
18 |
19 |
18 |
18 |
18 |
18 |
18 |
14 |
|
8.DAT |
21 |
22 |
21 |
21 |
21 |
21 |
21 |
21 |
|
9.DAT |
16 |
17 |
17 |
17 |
17 |
16 |
16 |
15 |
|
10.DAT |
6 |
7 |
7 |
6 |
6 |
6 |
6 |
6 |
Y T = 0.9 is chosen for the classification purpose
It was observed in the both methods of training of the LDASpike that the value of ‘ Y = 0.9 ’, considered as ‘ Y T ’ produces best classification of spike and non-spike data that matches with the result produced by the manual classification process. Therefore, the threshold value ‘ YT ’ for classification was taken as 0.9. In the case of 4fold cross validation method of training and testing, each file from the test data set was tested twice with different set of training data. The result of testing of each data file has been tabulated in table 4. It can be noted that the sensitivity and the selectivity of spike recognition remains constant in most of the cases for the same test data file, though they were tested by LDASpike trained with different sets of training data. However, exceptions were also found, which have been shown in bold characters in this table.
During the training and testing of LDASpike, a sample of the waveform labeled ‘non-spike’ was wrongly recognized as a spike by LDASpike is presented in figure 3. These waveforms are not considered as spikes because time-interval for the corresponding change in EEG amplitude is much more than those of spikes. The proposed method results on an average sensitivity 100% and selectivity 95.38%, when the training and testing data were same as given in table 5. However, with four fold cross-validation applied in this work, the sensitivity and selectivity were achieved as 98.45% and 96.06%, respectively, on an average as shown in table 6.
Table 3: The training and the testing of the LDASpike was done with 4-fold cross validation method with different values of Y . In this method, the tested data files were not used for the training. This has been achieved by using training data sets (a) 1.DAT – 5.DAT; (b) 6.DAT – 10.DAT; (c) 4.DAT – 8.DAT and (d) 1.DAT, 2.DAT, 3.DAT, 9.DAT and 10.DAT. In this way each data file was tested twice when they were not used for training.
(a) Training data files: 1.DAT – 5.DAT
(b)
|
Tested Files |
Manually Counted |
LDASpike Count |
||||||||
|
Y=0.6 |
Y=0.7 |
Y=0.8 |
Y=0.9 |
Y=1.0 |
Y=1.1 |
Y=1.2 |
Y=1.3 |
Y=1.4 |
||
|
6.DAT |
19 |
21 |
19 |
19 |
17 |
9 |
2 |
1 |
1 |
0 |
|
7.DAT |
18 |
18 |
18 |
18 |
18 |
8 |
4 |
2 |
2 |
0 |
|
8.DAT |
21 |
22 |
22 |
21 |
21 |
18 |
7 |
2 |
1 |
0 |
|
9.DAT |
15 |
18 |
17 |
17 |
16 |
15 |
6 |
3 |
2 |
2 |
|
10.DAT |
6 |
9 |
8 |
6 |
6 |
4 |
1 |
1 |
1 |
1 |
|
Tested Files |
Manually Counted |
LDASpike Count |
||||||||
|
Y=0.6 |
Y=0.7 |
Y=0.8 |
Y=0.9 |
Y=1.0 |
Y=1.1 |
Y=1.2 |
Y=1.3 |
Y=1.4 |
||
|
1.DAT |
38 |
40 |
39 |
39 |
39 |
39 |
38 |
38 |
38 |
38 |
|
2.DAT |
31 |
35 |
34 |
33 |
33 |
32 |
32 |
32 |
32 |
31 |
|
3.DAT |
23 |
31 |
28 |
26 |
24 |
24 |
24 |
24 |
23 |
18 |
|
4.DAT |
21 |
25 |
23 |
22 |
21 |
21 |
21 |
21 |
18 |
15 |
|
5.DAT |
19 |
24 |
20 |
19 |
19 |
19 |
19 |
19 |
18 |
17 |
-
(c) Training data files: 4.DAT – 8.DAT
Tested Files
Manually Counted
LDASpike Count
Y=0.6
Y=0.7
Y=0.8
Y=0.9
Y=1.0
Y=1.1
Y=1.2
Y=1.3
Y=1.4
1.DAT
38
40
40
39
39
39
38
38
38
38
2.DAT
31
37
35
34
33
33
33
33
32
32
3.DAT
23
36
31
28
26
26
24
24
24
24
9.DAT
15
26
22
19
16
16
16
16
16
16
10.DAT
6
20
15
11
9
7
7
7
7
7
-
(d) Training data files: 1.DAT, 2.DAT, 3.DAT, 9.DAT and 10.DAT
Tested Files
Manually Counted
LDASpike Count
Y=0.6
Y=0.7
Y=0.8
Y=0.9
Y=1.0
Y=1.1
Y=1.2
Y=1.3
Y=1.4
4.DAT
21
23
23
22
20
13
6
0
0
0
5.DAT
19
22
19
19
18
12
1
1
1
0
6.DAT
19
21
19
19
17
9
2
1
1
0
7.DAT
18
18
18
18
18
8
4
2
2
0
8.DAT
21
22
22
21
21
18
7
2
1
0
2.DAT.
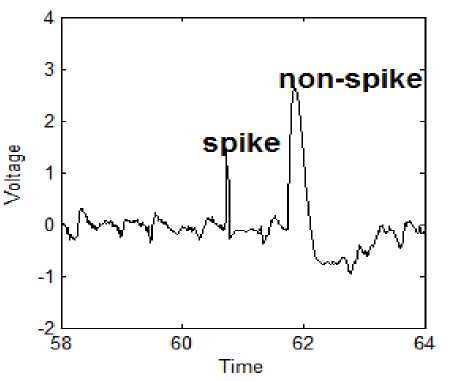
Figure 3: Waveform labeled ‘Not a Spike’ was recognized as a spike in
Table 4: Categorical data analysis of spikes counted for Y = Y T = 0.9, when the LDASpike was trained with 4-fold cross validation method, where different sets of EEG data files were used for training and testing. Each data file was tested twice when they were not used for training.
|
Samples |
Manually Counted |
LDASpike Counted |
tp |
fp |
fn |
tp+fn |
tp+fp |
Sensitivity (%) |
Slectivity (%) |
|
1.DAT |
38 |
39 |
38 |
1 |
0 |
39 |
38 |
100 |
97.44 |
|
1.DAT |
38 |
39 |
38 |
1 |
0 |
39 |
38 |
100 |
97.44 |
|
2.DAT |
31 |
33 |
31 |
2 |
0 |
33 |
31 |
100 |
93.94 |
|
2.DAT |
31 |
33 |
31 |
2 |
0 |
33 |
31 |
100 |
93.94 |
|
3.DAT |
23 |
24 |
23 |
1 |
0 |
24 |
23 |
100 |
95.83 |
|
3.DAT |
23 |
26 |
23 |
3 |
0 |
26 |
23 |
100 |
88.46 |
|
4.DAT |
21 |
21 |
21 |
0 |
0 |
21 |
21 |
100 |
100 |
|
4.DAT |
21 |
20 |
20 |
0 |
1 |
20 |
21 |
95.24 |
100 |
|
5.DAT |
19 |
19 |
19 |
0 |
0 |
19 |
19 |
100 |
100 |
|
5.DAT |
19 |
18 |
18 |
0 |
1 |
18 |
19 |
94.74 |
100 |
|
6.DAT |
19 |
17 |
17 |
0 |
2 |
17 |
19 |
89.47 |
100 |
|
6.DAT |
19 |
17 |
17 |
0 |
2 |
17 |
19 |
89.47 |
100 |
|
7.DAT |
18 |
18 |
18 |
0 |
0 |
18 |
18 |
100 |
100 |
|
7.DAT |
18 |
18 |
18 |
0 |
0 |
18 |
18 |
100 |
100 |
|
8.DAT |
21 |
21 |
21 |
0 |
0 |
21 |
21 |
100 |
100 |
|
8.DAT |
21 |
21 |
21 |
0 |
0 |
21 |
21 |
100 |
100 |
|
9.DAT |
15 |
16 |
15 |
1 |
0 |
16 |
15 |
100 |
93.75 |
|
9.DAT |
15 |
16 |
15 |
1 |
0 |
16 |
15 |
100 |
93.75 |
|
10.DAT |
6 |
6 |
6 |
0 |
0 |
6 |
6 |
100 |
100 |
|
10.DAT |
6 |
9 |
6 |
3 |
0 |
9 |
6 |
100 |
66.67 |
Table 5: Categorical data analysis of spikes counted for Y = Y T = 0.9, when the LDASpike was trained and test with all the 10 EEG data files. The achieved Sensitivity and Selectivity were found 100% and 95.38%, respectively.
|
File Name |
Manually Counted |
LDAspike Count |
tp |
fp |
fn |
tp+fn |
Tp+fp |
Sensitivity (%) |
Slectivity (%) |
|
1.DAT |
38 |
39 |
38 |
1 |
0 |
38 |
39 |
100 |
97.44 |
|
2.DAT |
31 |
33 |
31 |
2 |
0 |
31 |
33 |
100 |
93.93 |
|
3.DAT |
23 |
26 |
23 |
3 |
0 |
23 |
26 |
100 |
88.46 |
|
4.DAT |
21 |
21 |
21 |
0 |
0 |
21 |
21 |
100 |
100 |
|
5.DAT |
19 |
19 |
19 |
0 |
0 |
19 |
19 |
100 |
100 |
|
6.DAT |
19 |
19 |
19 |
0 |
0 |
19 |
19 |
100 |
100 |
|
7.DAT |
18 |
18 |
18 |
0 |
0 |
18 |
18 |
100 |
100 |
|
8.DAT |
21 |
21 |
21 |
0 |
0 |
21 |
21 |
100 |
100 |
|
9.DAT |
15 |
17 |
15 |
2 |
0 |
15 |
17 |
100 |
88.24 |
|
10.DAT |
6 |
7 |
6 |
1 |
0 |
6 |
7 |
100 |
85.71 |
|
Arithmetic Mean |
100 |
95.38 |
|||||||
Table 6: The average Sensitivity and Selectivity calculated for each data file.
|
EEG FILE |
Sensitivity (%) |
Selectivity (%) |
|
1.DAT |
100 |
97.44 |
|
2.DAT |
100 |
93.94 |
|
3.DAT |
100 |
92.15 |
|
4.DAT |
97.62 |
100 |
|
5.DAT |
97.37 |
100 |
|
6.DAT |
89.47 |
100 |
|
7.DAT |
100 |
100 |
|
8.DAT |
100 |
100 |
|
9.DAT |
100 |
93.75 |
|
10.DAT |
100 |
83.33 |
|
AVERAGE |
98.45 |
96.06 |
-
IV. DISCUSSION
Epilepsy is a chronic neurological disorder, which is characterized by the initiation with epileptic spikes and its train. These spikes are sharp changes in the EEG amplitude that occur in a very short time span. Several methods have been proposed for the recognition of epileptic spikes. Among them, the concept of artificial neural networks (ANN), time-frequency based approaches and fuzzy logic techniques are broadly demonstrated to have very good recognition rates. In recent years, the application of DFA as an alternative non-conventional approach in this area has also been reported with high recognition rates[18] [19] [20] [21] [22] as well as the Genetic Algorithm based approaches are also suggested[17] [37]. The sensitivity of spike recognition algorithm achieved by Goelz and coworkers was 84% [38]. Some previously proposed algorithms for spike detection have better sensitivity that has reached to 90% and 97%[39] [40]. Recently in 2009, MLP classifier proposed by Kutlu et. al. produced average sensitivity-selectivity (90.8%) and average sensitivity-specificity (ASenSpe) (94.9%)[41]. However, none of them have reported to achieve more than 99% recognition of epileptic spikes and simultaneously require substantially high computational time.
In this work, the signal data file is given to the designed algorithm, LDASpike, directly for epileptic spike recognition task. It processes the signal in run time by taking a window of 36 data points at a time and extracts the four features from it. These features are then transferred to the recognizer module of the algorithm. Based on the values of the extracted features, the recognizer module takes decision about the presence of spike in the current window. This process of feature extractions involves very simple computational methods having negligible complexity and hence takes very less time for decision making. Therefore, this process can be easily opted in a system designed for online processing. With the presented algorithm, we achieved a very high spike recognition rate. The average sensitivity and the selectivity were achieved as 98.45% and 96.06%, respectively, for the unknown data files, while, the LDASpike presented average 100% sensitivity and 95.38% selectivity with the test data sets used for training as well. These results are highly encouraging when compared with other complex and non-linear methods used earlier for the EEG spike identification.
The result obtained by the LDASpike has been compared with the result produced by the manual inspection for each input EEG data files. However, there can be different opinion among the experts regarding the definition of a specific pattern present in EEG and epileptic spike patterns are not the exception[42]. Also the human error during the manual inspection cannot be ignored. Therefore, a team of four experts together has manually inspected the EEG data files for the present spike patterns in it and thus the result obtained has been used for comparison with system obtained results. In clinical decision making, in which very large size of data files need to be processed at a same time to generate the clinically viable output, a very high recognition rate from the classifier is essentially required. However, apart from this high recognition rate the computational time involved in making the decision is another very important criterion, which cannot be ignored, rather, it has the edged priority over the classification accuracy. In another words, it can be suggested that the faster computation for clinical decision making has an advantage over the marginal enhancement in the classification accuracy by designing a complex classification method.
LDA proves to be very promising and has been used in many works very successfully in the realm of feature classification problems. It is very effective in two class feature classification and widely used in BCI for processing brain signals and is proved as a very good tool for online processing. However, rarely used for the identification of epileptic spikes [26] [27] [28]. In the current work, presence of epileptic spikes in EEG data is detected. This problem is easily mapped to a two class feature classification problem. In a specified size of window, if a spike is present then it is the first class of feature otherwise the background EEG data is treated as the second class of features. In the current work, LDA has been used in the design of epileptic spike recognition system called LDASpike. It is an offline system which works in the laboratorial setup of computer science and engineering. Due to some ethical issues the epileptic people cannot be used for the research methodologies in common computational laboratories for recording, testing and design of epileptic spike recognizers. Thus, the designed LDASpike was tested with the prerecorded and preprocessed EEG data with the pre-recorded signal data files. However, the successful application of LDA in design of online BCI systems is found widely and thus it is believed that if the ethical issues can be resolved, the LDA based spike recognizer LDASpike, which works as an offline recognizer right now, can also be used suitably in clinical setup for the development of fast and accurate online recognition system for the epileptic spikes.
-
V. CONCLUSION
Epileptic Spike recognition has been achieved earlier by various approaches of time-frequency methods. In the present work, the recognition rate is superior to the methods that have been proposed earlier. The system that has been designed uses the concept of LDA, which is a classification method used in dimensionality reduction. Hence, it has been named as LDASpike. Training is an important prerequisite in this work because the classification can commence only after the training has been done. On an average, very high sensitivity and selectivity were achieved in this method that may provide a platform for the development of a smart diagnostic tool for the epileptic spikes.
References LDASpike for Recognizing Epileptic Spikes in EEG
- Ficker, D. M., Sudden unexplained death and injury in epilepsy. Epilepsia. 41(Suppl 2): S7–12, 2000.
- Sperling, M. R., Sudden Unexplained Death in Epilepsy. Epilepsy Currents. 1: 21-23, 2001.
- Gotman, J., and Gloor, P., Automatic recognition and quantification of interictal epileptic activity in the human scalp EEG. Electroencephalogr Clin Neurophysiol. 41:513–529, 1976.
- Gotman, J., Ives J. R., and Gloor, P., Automatic recognition of interictal epileptic activity in prolonged EEG recordings. Electroencephalogr Clin Neurophysiol. 46:510–20, 1979.
- Gotman, J., Flanagah, D., Zhang, J., and Rosenblatt, B., Automatic seizure detection in the newborn: Methods and initial evaluation. Electroencephalogr. Clin. Neurophysiol. 103:356-362 1997.
- Inan, Z. H., and Kuntalp, M., A study on fuzzy C-means clustering- based systems in automatic spike detection. Comput. Biol. Med. 37:1160-1166, 2007.
- Liu, B., and Echauz, J., Prediction of epileptic seizures. Lancet Neurol. 1:22-30, 2002.
- Subasi, A., EEG signal classification using wavelet feature extraction and a mixture of expert model. Expert Systems with Appications. 32:1084 – 1093, 2007.
- Indiradevi, K. P., Elias, E., Sathidevi, P. S., Nayak, S. D., and Radhakrishnan, K., A multi – level wavelet approach for automatic detection of epileptic spikes in the electroencephalogram. Comput. Biol. Med. 38: 805 – 816, 2008.
- Nenadic, Z., and Burdick, J. W., Spike detection using the continuous wavelet transform. IEEE Trans. BME. 52:74-87, 2009.
- Ocak, H., Automatic detection of epileptic seizures in EEG using discrete wavelet transforms and approximate entropy. Expert Systems with Applications. 36:2027 – 2036, 2009.
- Kiymik, M. K., Akin, M., and Subasi, A., Automated recognition of alertness level by using wavelet transform and artificial neural network. J. Neurosci. Methods. 139:231 – 240, 2004.
- Sinha, R. K., Backpropogation artificial neural network to detect hyperthermic seizures in rats. Online J. Health Allied Sci. 4:1, 2002.
- Petrosian, A., Prokhorov, D., Homan, R., Dashei, R., and Wunsch, D., Recurrent neural network based prediction of epileptic seizures in intra- and extracranial EEG. Neurocomputing. 30:201-218, 2000.
- Sinha, R. K., Ray, A. K., and Agarwal, N. K., An artificial neural network to detect EEG seizures. Neurol. India. 52:399-400, 2004.
- Webber, W. R. S., Lesser, R. P., Richardson, R. T., and Wilson, K., An approach to seizure detection using an artificial neural network (ANN), Electroencephalogr. Clin. Neurophysiol. 98:250-272, 1996.
- Kocer, S., and Canal, M. R., Classifying epilepsy diseases using artificial neural networks and genetic algorithm. J. Med. Syst. 35:489-498, 2011.
- Keshri, A. K., Sinha, R. K., Hatwal, R., and Das, B. N., Epileptic spike recognition in electroencephalogram using deterministic finite automata. J. Med. Syst. 33:173-179, 2009.
- Keshri, A. K., Sinha, R. K., Mallick, D. K., and Das, B. N., Parallel algorithm to analyze the brain signals: Application on epileptic spikes. J. Med. Syst. 35:93-104, 2011.
- Keshri, A. K., Sinha, R. K., Singh, A., and Das, B. N., DFASpike: A new computational proposition for efficient recognition of epileptic spike in EEG. Comput. Biol. Med. 41:559 – 564, 2011.
- Lewis, R. A., Shmueli, D., and White, A. M., Deterministic Finite Automata in the Detection of EEG Spikes and Seizures. Advances in Intelligent Data Analysis. 6065: 103-113, 2010.
- Lewis, R. A., Parks, B., Shmueli, D., and White, A. M., Deterministic finite automata in the detection of epileptogenesis in a noisy domain. International Conference Intelligent Information Systems (IIS), in Proceedings of the Joint venture of the 18th International Conference Intelligent Information Systems (IIS) and the 25th International Conference on Matricidal Intelligence, Siedlce. Poland. 207–218, 2010
- Zhanfeng, J., Sugi, T., Goto, S., Xingyu, W., Ikeda, A., Nagamine, T., Shibasaki, H., and Nakamura, M., An Automatic Spike Detection System Based on Elimination of False Positives Using the Large-Area Context in the Scalp EEG. IEEE Trans. BME. 58:2478-2488, 2011.
- Garrett, D., Peterson, D., Anderson, C., and Thaut, M., Comparison of linear and nonlinear methods for EEG signal classi?cation. IEEE Trans.Neural Sys.Rehab. Eng. 11:141-144, 2003.
- Guo, L., Rivero, D., Dorado, J., Rabu?al, J. R., and Pazos, A., Automatic epileptic seizure detection in EEGs based on line length feature and artificial neural networks. J. Neurosci. Meth. 15:101-109, 2010.
- Bermejo-Barrera, P., Moreda-Pi?eiro, A., Moreda-Pi?eiro, J., Bermejo-Barrera, A., and Bermejo-Barrera, A. M., A study of illicit cocaine seizure classification by pattern recognition techniques applied to metal data. J. Forensic Sci. 44:270-274, 1999.
- Ghosh-Dastidar, S., Adeli, H., and Dadmehr, N., Mixed-band wavelet-chaos-neural network methodology for epilepsy and epileptic seizure detection. IEEE Trans. BME. 54:1545-1551, 2007.
- Subasi, A., and Gursoy, M. I., EEG signal classification using PCA, ICA, LDA and support vector machines. Exp. Sys. App. 37: 8659-8666, 2010.
- Sinha, R. K., Artificial Neural Network detects changes in electro-encephalogram power spectrum of different sleep-wake states in an animal model of heat stress. Med. Biol. Eng. Comput. 41:595-600, 2003.
- Sinha, R. K., Electro-encephalogram disturbances in different sleep-wake states following exposure to high environmental heat. Med. Biol. Eng. Comput. 42:282-287, 2004.
- Duda, R. O., Hart, P. E., and Stork, D. G., Pattern Classification. Wiley 2nd Edition. 2001.
- Schalkoff, R. J., Pattern Recognition: Statistical, Structural and Neural Approaches. Wiley India Edition. 2007.
- Press, W. H., Teukolsky, S. A., Vetterling, W. T., and Flannery, B. P., Numerical Recipes: The Art of Scientific Computing. Cambridge University Press, 3rd Edition. 2007.
- Han, J., and Kamber, M., Data Mining: Concepts and Techniques. 2nd Edition, 2006.
- Black, M. A., and Jones, R. D., Sensitivity and selectivity for continuous perception values – a comment. Electroencephalography and clinical Neurophysiology. 106: 457–459, 1998.
- Wilson, S. B., Harner, R. N., Duffy, F. H., Tharp, B. R., Nuwer, M. R. and Sperling, M. R., Spike detection. I. Correlation and reliability of human experts. Electroenceph. clin. Neurophysiol. 98:186–198, 1996.
- Firpi, H., Goodman, E. D., and Echauz, J., Epileptic seizure detection using genetically programmed artificial features. IEEE Trans. BME. 54:212-224, 2007.
- Goelz, H., Jones, R. D., and Bones, P. J., Wavelet analysis of transient biomedical signals and its application to detection of epileptiform activity in the EEG. Clin Electroencephalogr. 31:181–191, 2000.
- Witte, H., Eiselt, M., Patakova, I., Petranek, S., Griessbach, G., Krajca, V., and Rother, M., Use of discrete Hilbert transformation for automatic spike mapping: a methodological investigation. Med Biol Eng Comput. 29:242–248, 1991.
- Gabor, A. J., and Seyal, M., Automated interictal EEG spike detection using artificial neural networks. Electroenceph clin Neurophysiol. 83:271–280, 1992.
- Kutlu, Y., Kuntalp, M., and Kuntalp, D., Optimizing the performance of an MLP classifier for the automatic detection of epileptic spikes. Expert Systems with Applications. 36: 7567–7575, 2009.
- Agarwal, R., and Gotman, J., Computer-Assisted Sleep Staging. IEEE Trans. BME . 48:12:1412 – 1423, 2001.
