Leachability of arsenic by sediments in Boroo area, Mongolia

Author: Bolormaa O., Tsuji M., Murao S., Ochirkhuyag B.
Journal: Вестник Бурятского государственного университета. Философия @vestnik-bsu
Section: Химия
Article in issue: 3, 2012.
Free access
The leachability of arsenic and other constituents was studied by a diphasic distribution technique. Chemical analyses were carried out using particle-induced X-ray emission spectrometry and ion chromatography for aqueous phase. Showed that these sediments contain Hg, Se, As and Pb at different levels along with other metals. A 10-20 ppm level of As (III) was released by one of these samples into aqueous solution at higher pH values.
Arsenic, sediment, heavy metals, leachability, diphase distribution
Short address: https://sciup.org/148180931
IDR: 148180931 | UDC: 544
Выщелачивание мышьяка донными осадками в районе Бороо, Монголия
Изучено вымывание мышьяка и других составляющих методом двуфазного распределения. Химические анализы проводились с использованием рентгено-эмиссионной спектрометрии и ионной хроматографии для водной фазы. Показано, что осадки содержат Hg, Se, As и Pb на различных уровнях наряду с другими металлами. Уровень мышьяка (III) 10-20 ppm был высажен одним из образцов в водном растворе при повышенных значениях рН.
Text of the scientific article Leachability of arsenic by sediments in Boroo area, Mongolia
In the gold mining practiced in several Asian developing countries including Mongolia, mercury is found to form an amalgam with gold. The process of gold purification is mainly performed by small-scale miners with a low level of technical knowledge and skills, with no strict regulation. This leads to serious potential health and environmental risks in the areas of gold mining. Waste streams in mining industry often contain arsenic and other heavy metals. It could migrate through geological structure and might pollute water sources with potential hazardous contamination of drinking water. Discharge of heavy metals such as Hg, As and Pb, associated with gold mining, has been reported. It includes Inner Mongolia [1], Central Portugal [2], Indonesia [3] and USA, Philippines [4, 5], Tangania and Zimbabwe [6]. These heavy metals are redistributed between sediments, depending upon the ion exchange adsorption properties of sediments. Hence, it is important to understand such chemical properties of sediments comprising basically aluminosilicates, and insoluble oxides and/ or hydroxides of metals in order to predict the redistribution behavior. The total As, Sb, and Bi concentrations in surface soil samples were found in the mine dump sites due to mineralization associated with those metalloids, with the average values of 2500, 54 and 436 цд g-1, respectively. The guideline for As of 6.0 iig g-1 in agricultural land has set in Korea [7]. In the area of Boroo Mongolia, which is currently one of the active sites for gold mining industry, test analyses of toxic contaminants were primarily centered at mercury determination since 1994 [8]. The Boroo River that crosses the gold mining area is an important water supply for agricultural activity. The Mongolian Government adopted a Gold Industry Development Program aimed at increasing gold production by more than ten times over the present level and creating a gold refining capability. Particularly, gold production has increased almost by 90% since 1996. Recently, on the basis of geological data more than ten gold mining areas have been delineated within Mongolia.
This paper aimed to study leachability of arsenic by sediments collected at Boroo gold small-scale mining area of Mongolia.
Experimental
Materials. We selected two different areas for sediment sampling site (ID# W-11061100 and W-12061100) at Boroo area. Each other sampling site was divided by two subsamples. These are referred to as the samples A and B, respectively.
Elemental Analysis. The Particle-induced X-ray Emission (PIXE) at Tokyo Institute of Technology Van de Graaff Laboratory, Energy Dispersive Spectrometry (EDS) using an EDAX equipment model DX-95, and ion chromatography carried out chemical analyses for constituents in aqueous and solid phases. For PIXE analyses of solids, a very small portion of sample was taken on a carbon tape to irradiate by a 2.5 MeV proton and emitted X-rays were detected by two Si(Li) detectors. The distances between the target and two detectors were set at 5 cm and 13 cm to get about the same x-ray intensity at the position of the detectors a and b . A 1000 µ m thick polyethylene absorber was used for the detector a to attenuate lower energy X-rays. PIXE analyses of solutions were carried out using both a “Drop & Dry” method and preconcentration PIXE method described previously [9, 10]. The “Drop & Dry” method received its identification from general measurement procedure, which requires an aliquot of sample dropping on the Nuclepore Track-etch Membrane and drying prior to irradiation. Preconcentration method deals formation of insoluble complexes to be irradiated. The complexes are produced with 0.1 w/v% DBDTC. The DBDTC complexes were collected on a Nuclepore Track-etch Membrane using hand pump. The membrane was mounted on a sample holder and irradiated.
Vibrational Spectroscopy. Vibrational spectra of solids were recorded at the range of 4000 to 200 cm-1 using a JASCO Fourier transform infrared spectrometer model FT/IR-420 equipped with a CsI beam splitter. A small portion of sample powder was dispersed in cesium iodide pellet with a 1cm diameter. The quantity of CsI pellet was ca. 150 mg.
XRD. A RIGAKU X-ray diffraction model RINT –TTR II was used for phase identification in the sediments. The Cu target was used for CuK α , at a scanning speed of 1 0/min. XRD analysis is a capable tool to identify the primary crystalline phases in the sample.
pH Titration. A 500 mg portion of sediment samples was equilibrated with 50 mL of 0.01 M (Na-NO 3 +NaOH or HNO 3 ) mixed solution with intermittent shaking at 25oC. It took about two weeks to attain the steady state concentration. Then, the pH of solution was determined using a TOA Electronics pH meter model HM-20S. The aqueous solution was separated using a 0.22 µ m Acrodisc PVDF filter (Gelman Laboratory) to determine cationic and anionic species by a Shimadzu HPLC equipped with an IC-A3 and IC-C3 column, and conductivity meter as the detector. Another portion supernatant solution was analyzed for heavy metals by the preconcentration PIXE method.
Results and Discussion
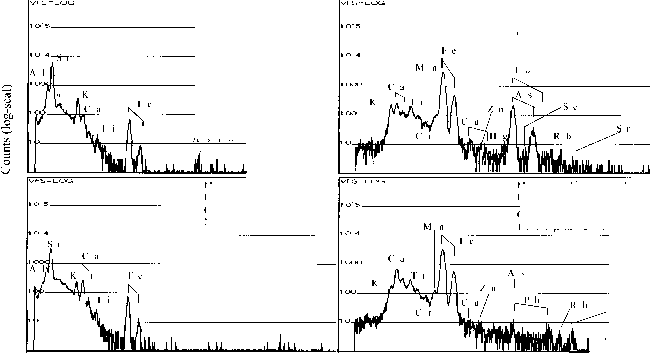
Sediments. The samples A (yellow) and B (brown) were taken at upper layer and at a bottom layer respectively, at the same location. These were air-dried, ground and sieved to obtain >300 mesh (< 50 µm). This fraction was used through out the present study without further treatment. These samples were kept in glass bottles at ambient temperature. PIXE spectra of two samples showed different levels of hazardous heavy metals (fig. 1). Potentially hazardous pollutants (PHPs) detected were Hg, As, Pb, and Se in the sample A. On the other hard, much lower contents of Pb and As were observed in the sample B. This large difference in their contents comes from in homogeneity of geological specimen, as the case often occurs. Table 1 represents the contents of major elements in two sediments determined using an EDS (from the surface). The sediment A was found to have a rather high content of As, 6.36%, while other sediment B showed only 0.33%. It is not known if these sediments are of primary origin, or they were originated in the mining process. It is worthwhile to mention that the sample B contains more Ca and Fe than the sample A. The major constituent of the samples considered as aluminosilicates with higher content of Fe. As well known, alu- minosilicates show the cation exchange property [11]. Hence, lower valent metals such as K+, Mg2+, Ca2+ and Sr2+ can be expected to be replaced by other cations.
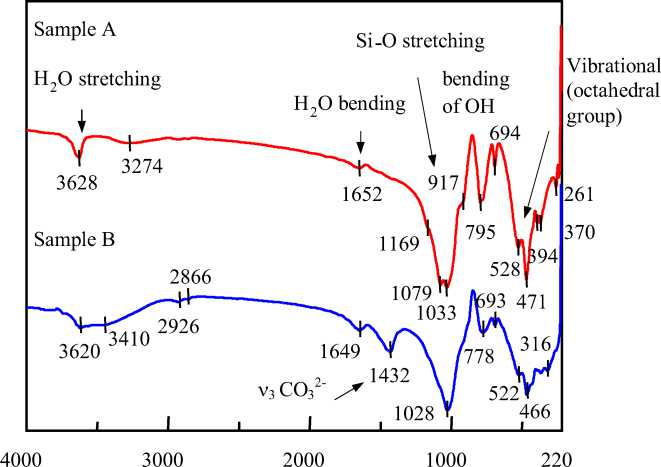
The FTIR spectra of two samples showed basically the same pattern of IR spectra (fig.2). They showed the stretching and bending modes of H 2 O at the wave number of ca. 3600 cm-1 and 1650 cm-1, respectively. A Si-O stretching mode, bending mode of hydroxyl group and vibrational mode of the octahedral group were observed at 1000-1170 cm-1, 700-950 cm-1, 400-600 cm-1, respectively.
Additional band at 1432 cm-1 observed on the sediment sample B is assigned to the ν 3 mode of CO 3 2-[12]. PHPs easily form metal complex and oxyanionic species at alkaline media. Hence it can be assumed that these in the sample B could form such species to be leached out into solution phase in alkaline media. In all cases, XRD patterns of both sediments showed that the presence of quartz (ICDD card # 46-1045) and muscovite (ICDD card # 06-0263) minerals (fig 3). Sample A reveals the saponite (ICDD card # 13-0305) and dickite (ICDD card # 10-0446), while in sample B albite (ICDD card # 19-1184), calcite (ICDD card # 47-1743), clinochlore (ICDD card #24-0506), cordierite (ICDD card # 13-0294) and anorthite (ICDD card # 18-1202) were identified. Unfortunately, XRD technique cannot indicate any amorphous compounds. Both samples possibly contain amorphous iron oxide, hydroxides and iron arsenide.
Charge= 1.08 µ C N o ab sorb er
M ongo lian soil ID# W -11061100
M ongo lian soil ID# W -11061100
Charge=1.08 µ C
1 0 00 µ m ab sorb er
Pb
A s/P b
Sr
IijkUJiLl
Channel
Fig. 1. PIXE spectra of two Mongolian sediments
M ongolian soil
ID # W -12061 100
C harge= 2 .0 2 µ C
N o ab sorb er
M ongo lian soil ID# W -12061100
Charge=2.02 µ C
1 0 00 µ m ab sorb er
Table 1
Relative contents of major elements in Mongolian sediments
|
Element |
Content in weight % |
|
|
Sample A |
Sample B |
|
|
Mg |
<0.05 |
0.82 |
|
Al |
9.71 |
8.22 |
|
Si |
53.56 |
40.97 |
|
S |
<0.05 |
0.25 |
|
K |
11.02 |
6.85 |
|
Ca |
2.46 |
14.28 |
|
Ti |
0.93 |
2.48 |
|
Cr |
0.10 |
0.13 |
|
Mn |
0.09 |
0.45 |
|
Fe |
15.59 |
24.54 |
|
Cu |
0.18 |
0.18 |
|
As |
6.36 |
0.33 |
|
Sr |
<0.05 |
0.51 |
Wavenumber [cm-1]
Fig. 2. FTIR spectra of two Mongolian sediments

Sample A
2 θ
Sample B
Fig. 3. XRD patterns of two Mongolian sediments
Table 2
Amounts of cations and anions released by sample A
|
Equilbrium pH |
Anion released ( µ eq/g) |
Sum ( µ eq/g) |
Cation released ( µ eq/g) |
Sum (μeq/g) |
||||
|
Cl- |
SO 4 2- |
CO 3 2- |
K+ |
Mg2+ |
Ca2+ |
|||
|
a-2.52 |
3.2 |
4.1 |
0.0 |
7.3 |
10.0 |
52.6 |
312 |
375 |
|
b-3.08 |
3.4 |
1.1 |
0.0 |
4.5 |
9.1 |
41.6 |
270 |
320 |
|
c- 8.86 |
3.3 |
3.1 |
0.0 |
6.4 |
4.1 |
15.0 |
81.4 |
100 |
|
d-10.86 |
3.1 |
2.0 |
0.0 |
5.1 |
3.7 |
0.0 |
27.0 |
30.7 |
|
e-11.22 |
2.9 |
6.0 |
0.0 |
8.9 |
3.6 |
0.0 |
33.8 |
37.4 |
Leachabity test. The leachability and/or exchangeability of these elements with ionic constituents in ground water and other electrolyte solutions are expected to effect the aqueous environments. These samples were studied using the pH titration technique. The pH titration curve indicated that the sample A has a small buffer region at both acid and alkaline solutions. This suggests that the specimens contain a low extent of exchangeable ionic spices, because the buffer action of inorganic solids is limited by the amount of exchangeable ions with H+ or OH- added. K+ though content of the sample A is larger; K+ was less exchangeable with H+ and/or Na+ at the pH regions studied. K+ ions in the sample A will be strongly bound by solid, as is the case of clay minerals. The cations release was 375 цeq/g at pH 2.52 and decreased inversely with to pH increase (table 2). The major cation in the equilibrated solution was Ca2+. The cation – exchange reaction is a major process in the sample A. It can be expressed at low pH by the following equation.
(K+, Mg2+, Ca2+) sediment + Na+ +H+ → (Na+, H+) sediment + K+ +Mg2+ + Ca2+ (1)
At higher pH, release of Mg2+ and Ca2+ decreased considerably due to increase affinity of sediment for these cations. Hence, H+ ions will take major role of this exchange process. On the other hand, the total amount of anions released into aqueous solution was only 5-9 µ eq/g in the pH range studied.
The pH titration curve of sample B was very different from that of sample A. It showed a large buffer region at both acidic and alkaline regions. This can be interpreted by release was and/or exchange of cations and anions respectively as described below. A considerable amount of CO 3 2- was released into the aqueous solution, reaching 288 µ eq/g at pH 6.19 (table 3). At pH 2.22, released CO 3 2- was neutralized to form CO 2 , and hence was not detected by the ion chromatography. At the alkaline pH region, amounts of anions released were nearly in the same level as those of the sample A. On the contrary, a large amount of cations was released. At pH 2.22, the total amount of cations reached 1447 µ eq/g. This amount is the same as that determined on the pH titration curve, assuming cation exchange with H+ ions. The most part of cations released was Ca2+. Hence, Ca2+ in the sample B was very exchangeable with H+. This behavior of CO 3 2- release is not easy to interpret by terms of sample dissolution of carbonate, although CO 3 2- was evidenced by the FTIR spectra. The Cl- and F- ions were observed at nearly all pH values. These processes could be described by using both cation and anion – exchange reactions. These are represented by the above Eq (1) and Eq (2).
(Cl-, F-, SO 4 2-, CO 3 2-) sediment + NO 3 - → (NO 3 -) sediment + Cl- + F- +SO 4 2- + CO 3 2- (2)
Amounts of cations and anions released by sample B
Table 3
Divalent carbonates were not replaced by monovalent NO 3 - at alkaline pH values. Very striking finding was release of considerable concentration of As (table 4). It was determined by the preconcentration PIXE method, while As (V) was determined by the ion chromatography using a mixed solution of 3.2 mM Bis-Tris and 8mM p-Hydroxybenzoic acid as an eluant. At alkaline solution, As (III) release considerably increased and the total concentration level attained 10-20 ppm. This suggests that this sediment will keep to discharge As (III) and As (V) upon contact with rain and ground water. Especially As(III) is toxic and needs to be immobilized.
Table 4
Arsenic released by the sample A
|
Equilibrium pH |
Concentration (ppm) |
||
|
Total As |
As (V) |
As (III) |
|
|
2.52 |
2.70 |
2.62 |
0.08 |
|
3.08 |
2.82 |
2.10 |
0.72 |
|
8.86 |
2.35 |
1 |
1.35 |
|
10.86 |
24.79 |
3.13 |
21.66 |
|
11.22 |
11.47 |
4.71 |
6.76 |
Conclusion
Sediments collected at Boroo area have been heavy polluted by arsenic (III) and arsenic (V) as well as Hg used for amalgamation process of gold mining. The level of As content reaches several percent, depending on the location of sediment layer, while Hg ranges in an order of 10 ppm. Since this arsenic is chemically fired in sediments and hence is not mobile, it will be never released. The present study showed clearly that a portion of As was highly mobile and released in 0.01 M NaNO 3 solution. Ion chromatographic and PIXE analyses showed that more As (III) was released at higher pH values. The As (III) concentration in an equilibrated solution in the diphasic distribution attached an order of 10 ppm. It exceeds of 103 orders higher than the WHO standard.
These sediments showed also cation and anion – exchange processes. The lower valent cations and anions such as alkali and earth metal ions, chloride, and sulfate and fluoride process. Hence, As (III) and As (V) in sediments are needed to be fired chemically otherwise the compounds being discharged into aquatic environment will pollute ground and river waters. For better understanding the above chemical properties of sediments, in- site speciation for As is essential using appropriate proves such as MAS-NMR, ESCA or µ -XANES.
