Leveling regional differences in the living standard of the population in the Russian Federation: Estimates and factors

Author: Ivanova E.I.
Journal: Economic and Social Changes: Facts, Trends, Forecast @volnc-esc-en
Section: Regional economy
Article in issue: 3 т.18, 2025.
Free access
From 2021 to 2024, Russia has been witnessing a growth in citizens’ living standard, which can be traced by the dynamics of poverty, real income and real disposable income indicators. The aim of the study is to identify trends in leveling regional differences in the indicators of standard of living in constituent entities of the Russian Federation for the period of 2005–2023. The estimations of inequality in standard of living of the population of constituent entities of the Russian Federation and its changes over time are based on the analysis of dynamics of the certain indicators. They are as follows: the share of the population with monetary incomes below the subsistence level, the ratio of average per capita monetary incomes of the population to the subsistence level and to the cost of a fixed set of goods and services. The author uses variation analysis and the index method to identify the nature of the regional asymmetry in the indicators’ values; a new indicator has been developed – the total regional index of monetary incomes of the population. Regional differences in the ratio of average per capita monetary incomes to the subsistence level have tended to decrease since 2021, while the ratio of average per capita monetary incomes to the cost of a fixed set of goods and services has tended to increase. The distribution of constituent entities of the Russian Federation by total regional income index value groups shows a steady increase in the share of regions with high and medium index values, and a decrease in the share of regions belonging to low-income groups. The author considers socio-economic and socio-governance factors as the major ones that determine the direction of regional differentiation; she also focuses on changing the methodology for calculating the subsistence level starting from 2021.
Standard of living, average per capita income, regional differentiation, subsistence level, differentiation factors
Short address: https://sciup.org/147251531
IDR: 147251531 | UDC: 369.011.4+ 314.145 | DOI: 10.15838/esc.2025.3.99.6
Text of the scientific article Leveling regional differences in the living standard of the population in the Russian Federation: Estimates and factors
Improving the standard of living of the population of the Russian Federation not only remains a pressing issue in the field of socio-economic policy aimed at overcoming social inequality, but also acquires socio-political significance as a social criterion for ensuring the safe state of the Russian economy and its regions.
The dynamics of macroeconomic indicators in Russia as a whole demonstrate contradictory trends. The period of GDP growth in 2000–2007 was followed by a period of stagnation and partial decline during the years of crises (2009, 2015– 2016, 2020). The values of real GDP per capita in the 2010 consumer prices1 increased in 2010–2014, decreased in 2015–2017 and returned to the level of 2010. The upward trend recovered in 2018; the indicator declined again during the crisis of 2020; and from 2021 to 2023, real GDP per capita was steadily increasing ( Fig. 1 ).
The real monetary incomes of the population were also increasing until 2013, while their growth rates decreased. From 2014 to 2017, there was a decrease in the indicator, the cumulative value of which was 9.1%. In 2018 and 2019, there was a slight increase, which was followed by a decline in the crisis year of 2020. The dynamics of the values of the indicator of real disposable incomes of the population repeated the trajectory of the values of real income of the population. Since 2021, the values of the indicators have been increasing annually, and in 2024, compared with 2023, the first indicator increased by 8.4%, the second by 7.3% ( Fig. 2 ).
The trend toward an increase in real incomes of the population is an important incentive for Russia’s economic development and the preservation of social stability. V.V. Ivanter regarded stagnation of living standards as a major threat to Russia2. However, the marked growth may be caused by the
Figure 1. Gross domestic product per capita and GDP per capita in consumer prices in 2010 in the COICOP grouping
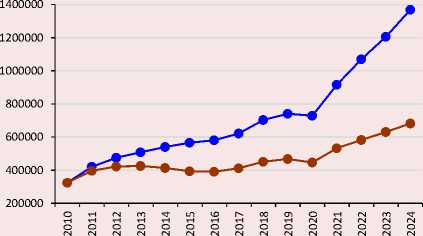
I ♦ GDP per capita —о— GDP in 2010 prices (COICOP)
Figure 2. Real monetary incomes and real disposable monetary incomes of the population, 2005–2024, % compared to the previous year
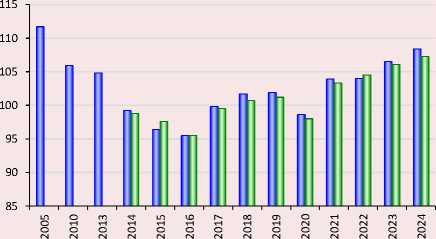
□ Real monetary incomes п Real disposable incomes
Sources: Rosstat data. Available at: ru/statistics/accounts (accessed: 15.02.2025); (accessed: 15.02.2025); own calculation.
Source: Rosstat data. Available at: folder/13397 (accessed: 15.02.2025).
influence of temporary factors, such as an increase in salaries and income from property (primarily due to high rates on deposits in banks and an increase in cash receipts from placing money on deposits), observed in 2023–2024. The trend toward rising incomes of the population is opposed by modern socio-economic and political conditions: a shortage of personnel, lagging labor productivity from wage growth rate, and the special military operation.
A significant factor in the stagnation of living standards is the persistence of regional socioeconomic inequality. Regional differences in the level and pace of socio-economic development, quality of life and standard of living of the population are viewed as modern challenges and threats to economic security3.
Modern research uses various indicators to assess the differentiation of the standard of living of the population, depending on the composition of the qualitative characteristics allocated for analysis. The indicators are presented both in official documents and in scientific literature.
The Economic Security Strategy for the period up to 2030, among the indicators assessing the social criteria of economic security, highlights the share of citizens with monetary incomes below the subsistence level, the decile coefficient, and the share of workers with wages below the subsistence level of the working-age population4. A number of indicators are contained and updated in a special section of Rosstat5.
Poverty of the population is the most common qualitative indicator of the standard of living in modern scientific research. When defining boundaries that classify a population or household as poor, researchers use such approaches as absolute, relative, subjective, and deprivation (Ovcharova, 2008; Karabchuk et al., 2013).
Speaking about evaluation criteria for differences in income (including interregional ones), experts point out that they should reflect the economic provision of the standard of living, assessments of regional socio-economic inequality from the perspective of maintaining or overcoming the problem of focal poverty of the population (Bauer et al., 2018, p. 207). Specific indicators include the ratio of social expenditures of the consolidated budget per capita to the subsistence level (SL), the growth rate of consumer spending and real incomes of the population (Bauer et al., 2018; Mityakov, Nazarova, 2023), indicators of income differentiation, housing affordability (Novikova, Krasnikov, 2010), the ratio of price dynamics and income (Lev, 2017).
Experts take into account the impact of regional differences in the socio-demographic structure and the state of the population’s living potential, which affect the size and structure of household income and expenses (Elizarov, Sinitsa, 2018; Ivanova, 2023). A special group of indicators consists of indicators of the standard of living of households based on data from sample surveys and sociological surveys: the results of a sample survey of household budgets, the NRU-HSE Economics and Health Monitoring, selective monitoring of income and participation in social programs, comprehensive monitoring of living conditions. V.N. Bobkov and co-authors evaluate the standards of monetary income and housing security in a monitoring study of living standards, and propose a two-criterion model of stratification of Russian society by income and housing security (Bobkov et al., 2018).
Regional estimates of the differentiation of the standard of living of the population take into account a different set of indicators. The most common classification is of constituent entities of the Russian Federation and municipalities of the region according to the structure and level of income and consumer spending of the population. Methodological recommendations have been developed to assess the impact of differences in the subsistence level on income inequality (Surinov, Luppov, 2021). (Fokin, 2015) investigates the combination of sources of income of the population, the influence of the size and structure of income on the turnover of retail trade. When assessing the interregional differentiation of the average per capita income of the population, the ratio of the subsistence level and the cost of a fixed set of consumer goods and services is studied (Tolmachev et al., 2017).
In the world, the problem of regional differentiation of living standards is studied both in individual countries to identify internal differences, and in macro regions to identify differences between countries. Studies of differences in the standard of living of the population of countries that are members of a supranational political and economic union (for example, members of the European Union) are conducted in line with the analysis of the results of macroeconomic changes and comprehensive assessments of regional differences in socio-economic indicators. To better understand inequality, experts assess household disposable income, employment levels, and regional GDP per capita (Palasca, 2015), distribution of personal income within regions (Longford et al., 2012; Fixler et al., 2019), and determine the dependence of the population’s standard of living on the quality of government and the size of government spending (Negri, 2022).
Regional differences in poverty levels are estimated by identifying the relationship between self-assessment of poverty, socio-economic characteristics of a household, and social capital (Guagnano et al., 2015). Using a model that determines the dependence of poverty parameters, economic growth and income inequality, the relationship between economic growth and poverty reduction is proved, as well as the relationship between increased income inequality and increased poverty. When conducting cross-country comparisons in the European Union, a typology of countries is carried out according to these indicators: the authors identified four groups of countries with similar characteristics (Michalek, Vybostok, 2019).
Topical studies show that regional differences do not smooth out with economic growth; on the contrary, economic growth exacerbates regional inequality (Martin, 2005, Zubarevich, 2010, p. 11). In 2015, OECD experts presented data on the growth of inequality in the countries leading in economic development. World Bank data, on the contrary, show that regional income inequality is gradually smoothing out. According to the World Bank data on the ratio of the four segments of the population with different income levels in Europe and Central Asia in 2023, the share of the population with incomes below the average level was only 3% (in 2010 – 7%), the share of the population with high incomes – 40% (in 2010 – 35%). In 2023, there was no low-income group; in 2010, its share was 2%6.
Studies of the differentiation of the standard of living of the population within individual countries also consider the degree of income concentration in different segments of the population, from the richest to the poorest, taking into account regional differences. For example, in the regions of Italy, there are significant differences in income, growth, capital accumulation and well-being7. In their estimates of the degree of income concentration in various segments of the population by intra-national districts, experts take into account the classification of districts depending on the availability of basic public services to citizens (Guzzardi, Morelli, 2024).
Our aim in this article is to identify the trend of differentiation of regional differences in the standard of living of the population of constituent entities of the Russian Federation in 2005–2023. The assessment of the standard of living is based on the calculation of indicators, which include the “subsistence level” category. The subsistence level is a socially recognized minimum income level necessary to ensure a person’s livelihood and basic needs, used to measure the standard of living of the population in the regions. The indicators, which include the SL, make it possible to assess both the social living conditions of people and their economic opportunities, and to identify the adequacy of monetary income to the guarantees of improving the standard of living of the population in Russia contained in official documents. The results of the analysis of changes in indicators of the income level of the population, which include the SL, are interdisciplinary in the regional context.
Research methods
Among the indicators characterizing regional inequality in the standard of living of the population, we will focus on the indicators that include the “subsistence level” category: the first indicator is the proportion of the population with incomes below the subsistence level, the second is the ratio of average per capita income to the subsistence level (APCI/SL ratio). The indicator of the share of the population with incomes below the SL estimates the share of the poor population, the level of poverty
(until the end of 2020, from 2021, the poverty level is estimated based on the poverty line8). The indicator of the APCI/SL ratio characterizes the purchasing power of the population.
The proportion of the population with incomes below the SL is a general relative value that estimates the proportion of the poor in the entire population. The APCI/SL ratio compares two calculated values having a qualitative content. Both indicators depend on changes in the methodology for determining the values of average per capita income and the subsistence minimum, as well as on changes in the size and age structure of the population.
The methodology for calculating the SL in the Russian Federation is not constant. Calculations of the SL until 2021 were based on the sum of the cost of the consumer basket, mandatory payments, and fees for a specific period of time. The composition and cost of the consumer basket were reviewed and adjusted. Calculations for 2005 and 2013 present the assessment of the SL taking into account the composition of the consumer basket, based on Law 134-FZ, dated October 24, 1997 and the “Rules for calculating the subsistence minimum per capita and for the main socio-demographic groups in the Russian Federation as a whole” (approved by RF Government Resolution 56, dated January 29, 2013). Since 2022, fundamental changes have taken place in the calculation methodology: the subsistence level is determined at 44.2% of the median per capita income9.
The calculation of the median per capita income is based on the methodology determined by the federal executive authority. The value of the average per capita monetary income of the population up to and including 2012 is calculated in accordance with the Methodology for calculating the balance of monetary income and expenses of the population (Resolution 61 of the State Statistics Committee of Russia, dated July 16, 1996); since 2013 – in accordance with the Methodological Provisions for calculating indicators of monetary income and expenses of the population (Rosstat Order 465, dated July 2, 2014, as amended November 20, 2018)10.
Changes in the SL calculation methodology affect the values of the indicators that it is included in the calculation of. Thus, estimates of the SL using the new methodology from 2022 may lead to a change in the direction of the dynamics of the maximum and minimum values of the indicators of the APCI/SL ratio. This is a subjective factor that limits the quality of the assessment and affects the comparability of indicators over time. Therefore, as a comparison, the dynamics of another indicator of the purchasing power of APCI are presented – the ratio of APCI to the cost of a fixed set of consumer goods and services.
Taking into account the trend toward an increase in real incomes of the population, it can be assumed that the main direction of interregional differentiation in the standard of living of the population for the period 2005–2023 is to equalize differences. To confirm the hypothesis, a comprehensive assessment of the population’s income indicators (the proportion of the population with incomes below the SL and the APCI/SL ratio) for the period under consideration is carried out based on an index approach. The initial indicators were converted into indices using min-max normalization11:
I ( n) =
N - N min
Nmax Nmin
where I(n) – value of the private regional income index;
N – actual value of the indicator;
Nmax – maximum value of the indicator;
Nmin – minimum value of the indicator.
The values of Nmax and Nmin were determined based on empirical estimates for each of the two indicators. The greater the gap between the values of indicators for each region and their minimum estimates among constituent entities of the Russian Federation, the higher the index, respectively, this region occupies a higher position in the ranking relative to others.
The final value of the index, let us call it the “total regional income index”, was obtained by summing two private indices. The index allows for a comprehensive assessment of changes in two indicators of living standards, taking into account both the social component (the proportion of the population with incomes below the SL in the total population of the region) and the economic component (the purchasing power of the population of the region).
The total income indices were calculated for 2005, 2013, 2021, 2022 and 2023. The values of the indicators for 2021–2023 characterize the state and changes in the standard of living of the population of the regions in the modern period. The year 2005 was taken as the initial year for comparison as a relatively favorable period in reducing regional differentiation in terms of income levels. The disparity in the APCI between regions has been gradually decreasing since the early 2000s. In the mid-2000s, transfers to the regions increased dramatically, and the trend toward income equalization across the regions of the Russian Federation increased. After the crisis of 2008–2009, transfers began to decrease, and inequality began to increase (Aganbegyan, 2017, p. 73). The year 2013 preceded 2014, which saw a significant decrease in real monetary incomes of the population (the decline continued until 2016, see Fig. 2). In 2013, fundamentally new management approaches were introduced to ensure balanced socio-economic development of constituent entities of the Russian Federation, reducing the level of interregional differentiation in the quality of life of citizens: the state program “Regional policy and federal relations”12 was adopted for eight years, including 2013. The effectiveness of its implementation and the activities of the executive authorities of constituent entities of the Russian Federation was assessed according to the main indicators of the socio-economic development of the territories, including the indicator “real disposable incomes of the population”13.
Constituent entities of the Russian Federation were grouped according to the index values for each year and seven groups of regions were identified: the first with the highest index values, the seventh with the lowest index values. Accordingly, the population of the regional groups can be characterized as rich (group I), wealthy (group II), well-off (group III), middle-income (group IV), low-income (group V), poor (group VI), poverty threshold (group VII). The fourth (middle) group has a borderline character between groups of regions with relatively rich and relatively poor populations. This approach is based on the results of an expert assessment of population categories based on the values of the APCI/SL ratio14.
The analysis of the dynamics of the indices in the context of the identified seven groups of RF constituent entities makes it possible to conduct a comprehensive assessment of the indicators of the income level of the population, which include the SL, as well as to present the change in regional differentiation over different periods.
The degree of intensity of regional variation is determined for each indicator, including the indices. The coefficients of variation in the share of the population with incomes below the SL and the APCI/SL ratio, as well as the total regional income index, are calculated using the formula:
’ - Д(М ■ where Х[ — value of the indicator for the constituent entity of the Russian Federation i, x — constituent entities of the Russian Federation: calculated as the arithmetic mean for the regions,
N – number of regions.
The coefficient of variation makes it possible to compare the average deviations of the values of indicators and indices for RF constituent entities from their average values (the greater the deviation, the greater the value of the coefficient of variation). The degree of variation intensity was assessed according to the scale presented in scientific publications: weak if v < 10%, moderate at 10% < v < 25%, significant at 25% < v < 33%, strong at v > 33%15. In statistics, it is generally assumed that the higher the value of the coefficient of variation, the relatively greater the spread and less alignment of the values in question. If the coefficient of variation is greater than 33%, the data set is heterogeneous.
Research results
Assessment of the degree of regional differentiation of constituent entities of the Russian Federation in terms of monetary income, taking into account the subsistence level
During the period 2005–2023, there was a significant decrease in interregional differences in the APCI of the population: the differences between the maximum and minimum values of the indicator decreased from 10.2 to 5.7 times. The change in the ratio of the maximum and minimum regional values of the SL is also significant: in 2005, the ratio was 7.5 times, in 2023 – 3.1 times.
Over the period 2005–2023, the share of the population with monetary incomes below the subsistence level in Russia as a whole has more than doubled, from 17.8% to 8.5%. During the same period, the minimum value for constituent entities of the Russian Federation decreased 4.5-fold, to 3.6% (Yamal-Nenets Autonomous Area), the maximum value decreased 3.6-fold, to 27.7% (Republic of Ingushetia). With a noticeable decrease in both the maximum and minimum values of the indicator over 18 years, the gap between them has remained significant and tends to grow: in 2019, it was at the level of 2005 (6.2 times), and increased to 7.7 times over the period 2019–2023.
Some growth in the share of the population with incomes below the SL occurred in 2013–2016 ( Fig. 3 ), the proportion of the poor population increased in the Republics of Kalmykia and Tyva.
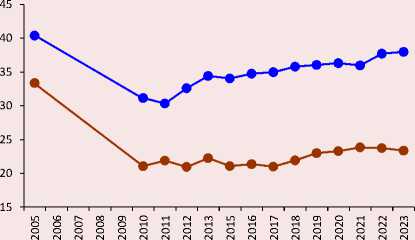
The APCI/SL ratio increased from 262% to 370% in 2005–2023, but the growth was uneven. During this period, the indicator changed in two directions in Russia as a whole ( Fig. 4 ).
Figure 3. Proportion of the population with incomes below the SL in the Russian Federation as a whole, maximum and minimum values of the indicator for RF constituent entities, 2005–2023, %
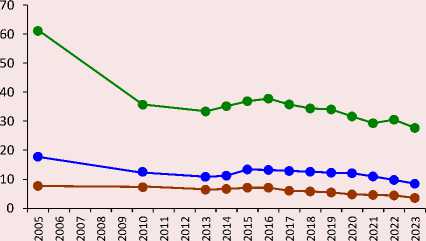
[ • - Pop. below SL —•— Min —•— Max
Figure 4. APCI/SL ratio in the Russian Federation as a whole, maximum and minimum values of the indicator f for RF constituent entities, 2005–2023, %
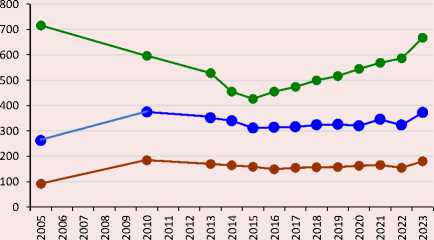
L^ APCI/SL —•— Min —•— Max
Source: Rosstat data. Available at: (accessed: 15.02.2025).
In 2005–2010, there was an increase in the minimum values and a decrease in the maximum values, as a result of which there was an equalization of interregional differences in the purchasing power of the APCI of the population. In 2005, the minimum value of the APCI/SL ratio was 135.4% in the Irkutsk Region (if we take into account the composition of RF constituent entities in 2005, the minimum value of APCI was lower than SL – in the Ust-Ordynsky Buryatsky Autonomous Okrug it was 91.7%; since January 1, 2008, this constituent entity of the RF is part of the Irkutsk Region). The maximum values were recorded in Moscow – 716.5%. By 2010, the maximum value of the ratio decreased to 596.6% (the population of Moscow retained the leadership), the minimum value increased to 184.8% (Republic of Kalmykia).
The decrease in the maximum values of the ratio of APCI to SL continued until 2015, the minimum values also decreased from 2010 to 2016 (to 149.4% in the Republic of Tyva). As a result of the parallel decrease in the indicators, the gap between them decreased to 2.7 times, which is the lowest level in the period under consideration. From 2016 to 2023, the gap between the values increased due to an increase in the value of the indicator in the leading regions: from 454.8% in 2016 to 667.5% in 2023 (since 2015, the Yamal-Nenets Autonomous Area has been the leader in terms of the indicator).
When assessing the values of the coefficient of regional variation (CRV) of the share of the population with incomes below the SL for 2005– 2023, two directions of changes are noticeable ( Fig. 5 ). In 2005–2011, differences between regions tended to decrease and smooth out. The CRV value in 2005 was 40% and reflected a high degree of heterogeneity in the indicator. By 2011, the CRV had decreased to 30%, which is the lowest value of the indicator for 2005–2023; however, this degree of coefficient heterogeneity remained significant. During 2012–2021 the coefficient had a stable upward trend, reflecting the asymmetric nature of changes in the share of the population with incomes
Figure 5. Coefficients of regional variation in the values of the share of the population with incomes below the subsistence level and the APCI/SL ratio
—•— Share below SL —•— APCI/SL
Source: own calculation.
below the SL in the regions. The trend toward an asymmetric change in indicators for RF constituent entities has significantly increased by 2022.
The direction of the dynamics of the values of the CRV of the APCI/SL ratio generally follows the trajectory of changes in the indicator of the level of poverty of the population. The most significant changes were also observed in the period 2005–2010. However, the trend toward smoothing the values of the regional variation of the indicator in the regions in 2005–2010 was more significant: the value of the CRV decreased from 33 to 21% due to the equalization of differences between the largest and smallest APCIs in RF constituent entities: they decreased from 10.2 to 6.1 times. In 2005–2010, money transfers to the regions increased (during this period, the federal target program “Reducing differences in the socio-economic development of the regions of the Russian Federation (2002–2010 and up to 2015)” was in effect16); respectively, the disparity in the size of the APCI between regions decreased.
The subsequent variability of the variation series is less pronounced compared to the poverty indicator series. Since 2011, fluctuations in the values of the CRV have been trending upward. From 2011 to 2017, there was a neutral type of dynamics, with minor changes relative to the level of 2010. Subsequently, the nature of the changes in the CRV of the APCI/SL ratio is closer to the asymmetric type. Over the period from 2011 to 2021, the CRV values increased from 22 to 23.8%, and decreased slightly from 2022 to 23.3% in 2023.
The dynamics of the coefficient of regional variation in the values of the share of the population with an income below the SL and the APCI/SL ratio allow us to conclude that their asymmetry persists in the regions of Russia. The spread of the indicators by 2023 was 38 and 23.3%, respectively. The high values of the CRV reflect a strong (the share with income below the SL) and significant (APCI/SL ratio) degree of heterogeneity of the territories of Russia according to these indicators.
Due to the transition to a new methodology for calculating the SL from 2021–2022, the value of the indicators that include the SL value differs from the values of previously calculated indicators. Experts’ calculations show that estimates of the level of absolute poverty in terms of the subsistence level, established on the basis of the new official methodology for calculating the “poverty line” in 2021–2022, were underestimated by 1.7–2.1 percentage points compared with estimates under the rules of 2013–2020 (Bobkov et al., 2024).
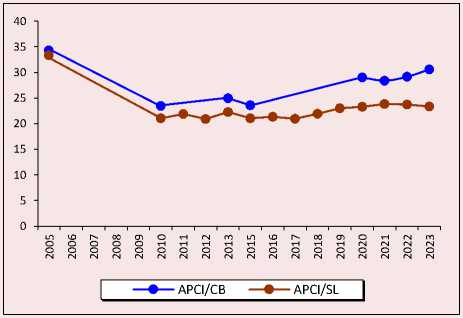
According to our comparisons of the SL for 2020 using official Rosstat data (the calculation procedure is the same) and the new methodology (44.2% of the median APCI), the discrepancies are clear: in relatively rich regions, when calculated according to the new rules, the SL increases, while in poor regions, on the contrary, it decreases. As a result, an underestimation of the SL can lead to an increase in the estimates of the APCI/SL ratio, and an overestimation of the SL can lead to a decrease in the values of the APCI/SL ratio (see Appendix, Fig. 1).
Estimates of the SL using the new methodology may also contribute to a change in the direction of the dynamics of the indicator from 2022; therefore, it is necessary to assess the purchasing power of the APCI by comparing it with another indicator characterizing differences in the standard of living of the regions’ population. As such an indicator, we use the ratio of APCI to the cost of a fixed set of consumer goods and services.
Dynamics of the ratio of the average per capita income of the population and the cost of a fixed set of consumer goods and services
Estimates of the cost of a fixed set of consumer goods and services (consumer basket, CB) when conducting interregional comparisons of the purchasing power of the population make it possible to determine the standard of living of the population based on data on the consumption of food, nonfood products and paid services. The indicator characterizes the features of consumer behavior of the regions’ population, expressed in terms of value.
A set of consumer goods and services is formed on the basis of a study of the consumer market of RF constituent entities, conducted by territorial bodies of the Federal State Statistics Service. The set comprises 83 items of goods and services, including 30 types of food products, 41 types of non-food products and 12 types of services)17.
Figure 6. Dynamics of the ratio of the APCI to the cost of a fixed set of consumer goods and services in the Russian Federation as a whole, minimum and maximum values of the indicator in RF constituent entities, 2005–2023
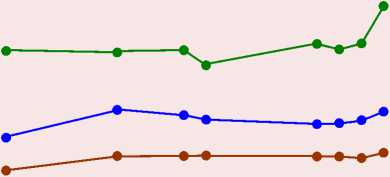
Figure 7. Dynamics of the coefficient of regional variation in the ratio of the APCI to the subsistence level (APCI/SL) and the ratio of the APCI to the cost of a fixed set of consumer goods and services (APCI/CB)
Sources: EMISS data. Available at: (accessed: 15.02.2025); Rosstat data. Available at: (accessed: 15.02.2025); own calculation.
The dynamics of the APCI/CB ratio for the period 2005–2023 is shown in Figure 6 . Comparing it with the value of the APCI/SL ratio, we see that the trajectory of change in the two indicators is unidirectional. The highest value of the APCI/ CB ratio was noted in 2010 – 254%, by 2020 it decreased to 212% and increased again to 249% by 2023.
The upward trend in 2005–2013 was determined by an increase in the well-being of the population of poor RF constituent entities: the minimum values were observed in the Republic of Kalmykia in 2005, amounting to 77%; and then they increased to 119% in 2010–2013. By 2015, a lower ratio was observed in the Republic of Altai – 120%, from 2020 – in the Republic of Ingushetia (by 2022 it decreased from 118% to 113%), by 2023 it amounted to 129%, and this is the most significant increase in 2005–2023.
The maximum values have decreased slightly since 2005 (427%) and in 2010 amounted to 422% (Moscow); in 2013 their value recovered to 428% (YaNAA). After a brief decline in 2014–2015, the highest values continued to rise in 2020 to 447% and then to the highest value of 558% in 2023. (YaNAA). As we see in Figure 6, the gap between the minimum and maximum values has widened in 2023.
The dynamics of the coefficient of regional variation in the APCI/CB ratio calculated for RF constituent entities for 2005–2020 repeat the trend typical for the APCI/SL ratio. However, the CRV values for the first indicator exceed the values of the second indicator throughout the entire period.
Differences between regions in the APCI/CB ratio decreased most noticeably in 2005–2010. The downward trend, despite fluctuations, persisted in 2010–2015, then it reversed to an increase, and in 2020 the CRV was 29% ( Fig. 7 ).
Since 2021, the dynamics of the CRV of the two indicators of the purchasing power of the population has taken on a different direction. As we see in Figure 7, the degree of variation of deviations between the APCI/CB ratio from its average value by 2023 exceeded 30%. The high values of the CRV reflect a significant degree of heterogeneity of the indicator values in RF constituent entities. Comparing the directions of change in the two indicators of the purchasing power of household incomes allows us to draw another conclusion – the change in the methodology for calculating the SL since 2021 has affected the prospective values of the indicator itself and the indicators that take into account the value of the SL, including the APCI/ SL ratio. The comparison showed that regional differences in the purchasing power of the average per capita income of the population, calculated as the APCI/CB ratio, tend to increase.
Differentiation of income levels of the population according to the values of the calculated total regional income index
The values of the total regional income index were divided into seven groups in descending order: the first group contains the highest index values, the seventh contains the lowest ( Tab. 1 ). Depending on the index values, RF constituent entities were divided into groups. The classification was carried out for 2005, 2013, 2021, 2022 and 2023.
Table 1. Groups of constituent entities of the Russian Federation according to the calculated total income index
|
Group |
Index value |
Group |
Index value |
|
1 |
1.400 and higher |
5 |
0.900–0.999 |
|
2 |
1.200–1.399 |
6 |
0.700–0.899 |
|
3 |
1.100–1.199 |
7 |
0.699 and lower |
|
4 |
1.000–1.099 |
||
|
Source: own calculation. |
|||
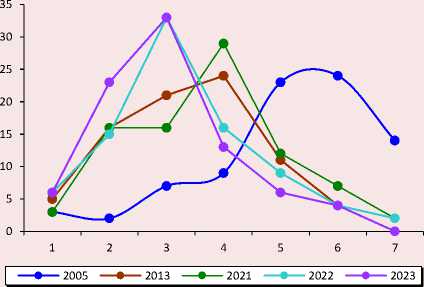
The distribution of RF constituent entities by groups of values of the total regional income indices of the population for the specified years is shown in Figure 8.
According to the values of the total index in 2005, 61 of the 82 RF constituent entities for which the index was calculated were classified into the fifth, sixth and seventh groups with low income indices. An assessment of regional social resources of innovation processes conducted in 2005 showed that out of 84 RF constituent entities, 21 regions with average and high social indicators of quality of life could be identified (Ivanova, 2007).
By 2013, a larger number of regions – 45 out of 83 – are observed in the third and fourth groups, with an average index value; groups 5–7 include 17 RF constituent entities. In 2021, the maximum number of regions (29) belonged to the fourth group. By 2022, the index values in constituent entities of the Central, Northwestern, and Far Eastern federal districts have increased significantly, and 33 regions have already been included in the third group.
The number of RF constituent entities included in the groups with a low index value decreased 4-fold by 2022 and amounted to 15 (61 in 2005). The distribution of regions by group of values of complex income indices of the population showed a steady increase in the number of RF constituent entities with high and average values of the indicator, a decrease – with low ones. In 2022, relatively high income levels were observed in 54 RF constituent entities, which were included in the first three groups within the framework of the classification carried out. In 2005, there were 12 RF constituent entities in these groups.
Figure 8. Distribution of RF constituent entities according to the groups of values of the total regional income indices of the population in 2005, 2013, 2021, 2022, 2023
Source: own calculation.
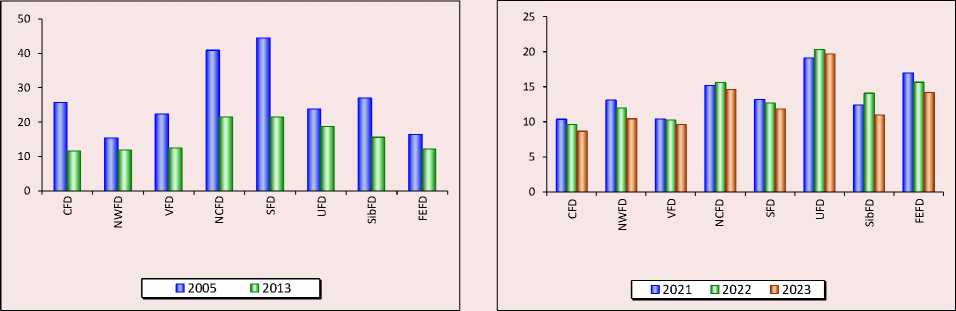
Figure 9. Coefficients of regional variation of total income indices in the subjects of RF federal districts in 2005, 2013, 2021, 2022, 2023.
Source: own calculation.
The distribution of regions by group of the total income index, which takes into account the values of two indicators, for 2023 indicates that the structure is dominated by regions with the high and highest index values – in 62 of the 85 RF constituent entities, the indices exceeded the average values. The number of regions with values below the average was 10, of which four RF constituent entities were included in the poorest group: the republics of Kalmykia, Ingushetia, Tuva and the Karachayevo-Circassian Republic.
The trend toward income equalization in 2021– 2023 is clear and affects not only relatively rich regions, but also regions that were relatively poor.
However, the dynamics of the CRV values of the share of the population with an income below the SL and the APCI/SL ratio show that the degree of their asymmetry in all regions of Russia remains significant: in 2023, the CRV was 23.3% and 38%, respectively. The high degree of differences in indicators suggests further analysis of the uneven income levels across more homogeneous groups of regions, across constituent entities of federal districts, which will reduce the spread of values of indicators obtained in calculations for all RF constituent entities.
The dynamics of differentiation of total income indices for 2021–2023 had a levelling character in five federal districts: Central, Northwestern, Volga, Southern, and Far Eastern (Fig. 9). The levelling of the values of the indicators occurred due to the gradual approximation of the index values to the average values of constituent entities of federal districts where the level of population’s income was low. By 2022, all regions in the Central Federal District had achieved a high level of the indicators: Moscow remained the leader, while high rates corresponding to the second group were observed in the Moscow, Belgorod, Lipetsk, Voronezh, Kursk, and Yaroslavl regions. The remaining regions were included in the third group.
In the Southern Federal District in 2013–2021, the gap in the index values decreased 1.6-fold, mainly due to an increase in the indicator in the bottom region, the Republic of Kalmykia. The composition of the groups remained virtually unchanged by 2023: the second group included the Krasnodar Territory, in 2021–2023 – the Republic of Adygea and the Rostov Region; the Volgograd Region and Sevastopol were included in the third group. The indices for the Republic of Crimea and the Astrakhan Region are lower than the average values, but even here their gradual increase is noted: by 2023, the values of the indices of the regions of the district corresponded to those in group 4 (see Appendix, Tables 1, 2).
In the Northwestern and Far Eastern federal districts, the minimum values of regional variation were observed in 2013. By 2021, there was a slight increase in asymmetry in the Northwestern Federal District due to a decrease in income indicators for the population of the Kaliningrad and Novgorod regions and the Republic of Komi. In 2022, the CRV decreased due to an increase in the income of the population in the Arkhangelsk and Vologda regions, as well as in the republics of Karelia and Komi. In the Novgorod and Kaliningrad regions, by 2023, indicators have increased to the level of the middle, third classification group. Values below the average income level were observed only in the Pskov Region (group 4).
In the Far Eastern Federal District, the growth of asymmetry was noticeable in 2013–2021. It is explained by the increase in the number of regions with the lowest and highest rates for the federal district. In 2021, the sixth group with low income values included the Trans-Baikal Territory, the Republic of Buryatia, and the Jewish Autonomous Region, whereas in 2013 it consisted only of the Jewish Autonomous Region. In 2021, the second group included three subjects of the district – the Chukotka Autonomous Area, the Sakhalin and Magadan regions, whereas in 2013 – only the first two regions. The situation in the Trans-Baikal Territory and the Republic of Buryatia has worsened – according to the value of the income index, the subjects of the district have moved from the fourth to the sixth group. But by the next year (2022), the indicators in these subjects had increased and only the Jewish Autonomous Region remained in the lagging group. Income indices have also increased in high-income regions – the Sakhalin and Magadan regions, and by 2022 these subjects of the district have taken leading positions in the first group. In 2023, the downward trend in the income index values continued due to an increase in the indicator in the Jewish Autonomous Region, the Trans-Baikal Territory, and Yakutia.
The value of the regional variation in the total income index in the North Caucasus Federal District decreased intensively during 2005–2013, almost halving from 41% to 21.5%. By 2021, the decline in the income index in the district continued, but mainly due to a decrease in the values of income indices in the richer subjects of the district – the Republic of Dagestan and the Stavropol Territory. None of the regions of the district was included even in the third classification group. The decrease in regional asymmetry was also caused by a parallel decrease in the index values in the republics with the lowest income levels – Kabardino-Balkaria and Ingushetia. In 2022, the CRV increased slightly due to a decrease in the index value in Ingushetia. Next year, in 2023, the CRV decreased: the index values increased in Ingushetia and Kabardino-Balkaria. Among the subjects of the district with relatively high values of the income index, the Republic of Dagestan came out on top.
By 2021, the trend toward a reduction in the CRV in the subjects of the Siberian Federal District was mainly due to an increase in the minimum values of the indicator in the subjects of the district (in the republics of Tyva and Altai). The decrease in the maximum values was not so pronounced. By 2022, the CRV increased due to a decrease in the minimum value (in the Republic of Tuva), as well as an increase in values in the richer subjects of the district – the Omsk and Kemerovo regions. In 2023, the income indicator increased in most of the subjects of the district: it reached the values of the second classification group for the Novosibirsk Region, and the values of the third group for the Krasnoyarsk Territory, Kemerovo, Omsk, and
Tomsk regions. In the groups with the lowest income indicator, growth was observed in the republics of Altai and Tyva, which moved to higher classification groups. In general, the direction of changes in the differentiation of the subjects of the Siberian Federal District is closer to the neutral type.
In the Ural Federal District in 2005, the CRV value was low compared to the that in the Southern and North Caucasus federal districts. During the period 2005–2013, the coefficient values decreased from 23.9% to 18.8%. In 2021 and 2022 it changed direction – there was an increase in values to 19% and 20.3%, in 2023 the CRV decreased slightly. The composition of the subjects of the district with high and low income index values is stable: the Yamal-Nenets Autonomous Area (in 2005 also the Khanty-Mansi Autonomous Area) is in the lead, the Kurgan Region remains a lagging region. The Ural Federal District retains the asymmetric nature of differences in the values of population income indices, the variability of a number of indicators is average, but in comparison with other federal districts it is the highest.
Analysis of the obtained results. Conclusions
The results of the assessment of the differentiation of RF constituent entities by income level, obtained on the basis of the calculated total regional income index, indicate the predominance of the levelling nature of the dynamics of regional variation in income indicators. The differences are levelled due to an increase in income index values both in regions with a relatively high level of well-being, and due to an increase in minimum values in lagging regions of the Russian Federation. Significant deviations from the average values for federal district remain only in the Ural Federal District.
The absence of pronounced asymmetry in the values of income indicators is proof of the levelling of regional differences in the income level of the population. This conclusion is important from the point of view of evaluating the effectiveness of the implementation of a number of federal and regional programs aimed at improving the quality of life and well-being of citizens. It is also important to draw a conclusion from the perspective of assessing the impact of income growth in the regions, reducing inequality in their level as a social factor in the economic development of the country, and increasing activity in consumer behavior of the population.
A significant degree of heterogeneity of Russia’s territories remains in the two indicators of the purchasing power of the population. Regional differences in the indicator, calculated as the ratio of the APCI to the cost of a fixed set of consumer goods and services, have tended to increase since 2015, and it continued in 2021–2023. By 2023, the index’s value margin exceeded 30%, which is greater than the degree of regional differences calculated based on the APCI/SL ratio (23%).
The trend toward leveling interregional differences in the income level of the population is quite stable. The fluctuations that have been occurring since 2015 are related to the impact of crisis factors, as they overcome which the trend is recovering. When studying the social structure of modern Russian society, taking into account its dynamism and exposure to external factors, the importance of setting and analyzing problems related to the processes of formation of social structures increases.
The reduction in regional differentiation of key indicators of the income level of the population is a consequence of the response to a set of public policy measures. Socio-managerial and socio-economic factors influence the maintenance of a steady trend toward levelling the key indicators of the standard of living, creating favorable conditions for the population in many regions. The formation of outstripping socio-economic development territories and the introduction of new management mechanisms aimed at creating favorable business conditions stimulate the development of regions, create new jobs, increase the profitability of enterprises and organizations, and contribute to the growth of real incomes of the population. Current socio-economic measures include tax reform, which takes into account the level of income of citizens; an increase in the minimum wage, and an increase in wages.
Along with socio-managerial, socio-economic factors, socio-demographic factors, the availability of high-quality social infrastructure, as well as latent behavioral factors affecting the characteristics and structure of spending and consumption of the population are important in reducing the income differentiation of the regions’ population.
