Leveraging Deep Learning Approach for the Detection of Human Activities from Video Sequences

Author: Preethi Salian K., Karthik K.
Journal: International Journal of Image, Graphics and Signal Processing @ijigsp
Article in issue: 6 vol.17, 2025.
Free access
Using deep learning approaches, recognizing human actions from video sequences by automatically deriving significant representations has demonstrated effective results from unprocessed video information. Artificial intelligence (AI) systems, including monitoring, automation, and human-computer interface, have become crucial for security and human behaviour analysis. For the visual depiction of video clips during the training phase, the existing action identification algorithms mostly use pre-trained weights of various AI designs, which impact the characteristics discrepancies and perseverance, including the separation among the visual and temporal indicators. The research proposes a 3-dimensional Convolutional Neural Network and Long Short-Term Memory (3D-CNN-LSTM) network that strategically concentrates on useful information in the input frame to recognize the various human behaviours in the video frames to overcome this problem. The process utilizes stochastic gradient descent (SGD) optimization to identify the model parameters that best match the expected and observed outcomes. The proposed framework is trained, validated, and tested using publicly accessible UCF11 benchmark dataset. According to the experimental findings of this work, the accuracy rate was 93.72%, which is 2.42% higher compared to the state-of-the-art previous best result. When compared to several other relevant techniques that are already in use, the suggested approach achieved outstanding performance in terms of accuracy.
Categorization, CNN-LSTM, Deep Learning, Detection, Human Activities, Stochastic Gradient Descent, Video Sequence
Short address: https://sciup.org/15020033
IDR: 15020033 | DOI: 10.5815/ijigsp.2025.06.05
Text of the scientific article Leveraging Deep Learning Approach for the Detection of Human Activities from Video Sequences
Human Activity Recognition (HAR) is a technique for identifying human activities in a video stream. When utilizing an executable script for video interpretation, it might be challenging to distinguish between commonplace activities like jogging, running, and walking. During the past ten years, HAR has seen an increase in interest, and numerous scholars are currently exploring its potential. The field of HAR has grown significantly with notable applications in areas such as human movement evaluation, familiar person and gender categories verification, the capture of movement and animated footage, unusual behaviour identification, video examination, and indexed (important for TV manufacturing, recreational activities, educational research, and safety), video2text (auto-scripting), video annotating, and video mining [1]. Based on the platform, human activity recognition aims to identify the physical actions performed by an individual or collection of people. Running, leaping, walking, and sitting are just some of these activities that one person may perform by altering their complete body [2]. HAR may additionally refer to any unusual behaviours, such as unexpected falls. Ambient assisted living facilities, nursing facilities, monitoring of health, rehabilitative tasks, monitoring, and interaction between humans and computers are some of the most widely used uses of HAR [3].
Recognizing the actions of humans in videos has several uses, including intelligent surveillance footage, the interaction between humans and computers, robotic vision, analytics of video, healthcare evaluation, recreational activities, training, educational digital archives, film or image annotating, safety and defense-related applications. The human action identification system aims to automate the video surveillance system so that human operators may recognize odd occurrences of interest [4]. Despite tremendous improvements over a decade, this sector is still challenging to investigate for various reasons like complicated background structure and noise, the camera's movement, abrupt changes in lighting, cluttered backgrounds, object obstruction, modifications in perspective, intra-class variants, and the reduction of detail brought on by rendering scenes from a 3D environment on a 2D plane [5,6]. In numerous cases, an electronic device is sufficient to notify humans whenever an action occurs rather than explain what and how it occurred. This may be used for a variety of things, such as assisting individuals with the tiresome task of monitoring involved surveillance footage and content-driven video retrieval. It is observed from human living nature that senior citizens want to live freely in comfortable environments such as their residences, making it difficult for their carers to offer high-quality care. The creation of computerized systems to keep track of older people's everyday activities has become an important research topic in consumer electronics. The emphasis is instantly recognizing human behaviors and interactions with consumer devices like smartphones, tablets, smart speakers, or smart home appliances[7].
Although video capture may be significantly impacted by light, accessibility, size and position, comprehensive action identification utilizing computer vision requires an extremely high computational expense [8]. Considering that the behaviour identification system operates primarily online and must be evaluated in real time, the system should be capable of effectively identifying the subject's behaviours dependent on limited input to lower the computational expenses. As a result, valuable framing and frame index data may be utilized; in the case of human posture calculation, the body attitude is expressed by a collection of directed rectangles. Every frame's condition description is defined by a histogram that combines the orientations and locations of rectangles [9]. The performance of video-based activity identification systems may be improved by combining approaches like the Histogram of Oriented Gradients (HOG), Histogram Of Optical Flows (HOF), and Movement Boundaries Histogram (MBH). Background Subtracting Methods (BGS) utilize the backdrop as a reference point. In addition, using skeleton modeling makes it possible to record the locations of human body parts, such as the arms and hands, which may subsequently be used to categorize human activities [10].
HAR often falls into two distinct groups: sensor-based HAR and vision-based HAR [11]. Although a sensor-based approach analyses the data from the sensors in a time sequence structure, a vision-based approach analyses the camera information in an image or video structure [12]. Because of its affordability, mobility, and compact size, the accelerometer is the most commonly utilized sensor for HAR [13]. According to studies, sensor-based HAR is more straightforward to use and upholds greater security than vision-based HAR [14]. Additionally, though being less costly to build, vision-based HAR is more impacted by ambient factors such as filming perspectives, illumination, and individual overlapping [15]. Vision-based human-activity identification approaches employ visual-sensing technologies, including surveillance footage, to keep an eye on both the actions of characters and modifications in the environment. Digitized visual information or video footage makes up the sensor's produced information. Technologies in this field include computer vision methods such as structural modeling, extraction of features, motion segmentation, motion monitoring, and activity separation to analyze visual input for recognition of patterns [16].
Human Postural Processing (HPP)is the first stage in identifying human activities. It is problematic because of variations in people's looks, modifications to clothing's ability to reflect light, or the variety of characteristics and volume of information produced. Intrusive and non-intrusive procedures are the two main methods of recognizing human position. Conversely, non-intrusive approaches collect information using remote sensing tools like webcams [17]. In today's world, the mobile phone is increasingly important in providing many services and tools, including health monitoring, early illness identification, human inspection, well-being monitoring, and conducting research. In addition to having built-in sensors, cell phones are adaptable and have powerful processing ability in an actual situation for HAR, combined with strong interaction capabilities that include tracking, monitoring well-being and health, home recovery, and early problem diagnosis [18].
Techniques for deep learning have recently gained popularity due to their capacity to automatically extract attributes from vision or imagery in addition to time-series information, making it possible to quickly learn a high degree and relevant characteristics [19]. Utilizing a mix of layering and filter-based convolutional neural networks (CNNs), a form of deep neural networks, successfully categorizes human re-identification [20]. A few of those works are highlighted as a summary in Table 1. This research aims to classify and recognize various human behaviours from video surveillance information sources. The recommended technique, significantly distinct from the method that called for in-depth information and its collection of video clips, could explore preventive human behavior tendencies and categorize them from complex scenarios paired with sounds.
The remaining part of this work is structured as follows: Section 2 examines the most pertinent research in human activity recognition. The dataset details and proposed technique are explained in section 3. Section 4 will analyze the experimental and assessment outcomes and contrast them with current approaches before the final portion. The study is concluded in section 5, which also suggests a few inputs for further research.
2. Related Works
Several computerized vision-based techniques have been created in recent years to identify human behaviour in RGB and depth camera footage. These techniques encompass depth movement maps, skeletal connections, time and space occupation trends, key posture extraction, movement encoded and time and space trajectories. These camerabased methods, nevertheless, are only relevant to a small range of views and are impacted by background clutter and lighting variations. Wearable inertial measuring devices offer a workable answer to these problems, yet they have several drawbacks, including position and orientation sensitivities. The use of several sensing modalities for precise human action detection is rapidly growing owing to the complementary nature of the information collected from cameras and inertial devices. In this research, a practical multifunctional feature-level fusing method for reliable human action identification is presented. This method makes use of information from a variety of sensors, comprising an RGB camera, depth sensors, and wearing inertial measurements.The study's information from the RGB-D camera footage and inertial sensors in the body was removed to yield computationally effective characteristics. These aspects comprise statistical signal properties from wearable sensor information as well as efficiently obtained histogram of orientated gradients (HOG) characteristics derived from RGB/depth films. A heterogeneous human behaviour database called UTD-MHAD that includes 27 distinct human activities is used to evaluate the suggested human action recognition (HAR) system. The suggested fusing approach for HAR is trained and tested using SVM and K-nearest neighbour classifications. The results of the study show that the suggested technique outperforms current techniques in terms of recognizing outcomes. Considering an accuracy percentage of 97.6%, RGB's feature-level integration and passive metrics provide the best overall performance of the proposed technique. This approach is ineffective because it does not use multi-view HAR, and the orientation of the subject whose activity is being detected by the camera remains unchanged [21].
For numerous applications involving computer vision, such as video monitoring, investigations into crimes, and sporting uses, human motion detection, and video summarising constitute difficult issues. It might be challenging to identify inside a video a certain action and/or persons in extended recordings. The ways of recognizing human activity that is typically discussed in literature address videos that just have one person in them and can identify that individual's behaviour. The method for numerous human action identification, recognition, and summarising proposed in this research is efficient. The various activity recognition approach captures the silhouette of human beings before creating a distinct sequence for every one of them utilizing movement recognition and tracking techniques. The similarities among every set of frames are then used to partition each of the retrieved sequences into shots that reflect the sequence's uniform activities[22]. In this work, the Temporal Differential Mapping (TDMap) for every shot's frame is used to construct the Histogram of Oriented Gradients (HOG), which is used in the action detection procedure. The comparison among the produced HOG and the existing HOGs acquired throughout the training stage is done to determine the action. These training HOGs are based on a collection of instructional movies and cover a broad spectrum of movements. Additionally, utilizing the TDMap images and a suggested CNN approach, the study identifies the activity. A summary of every identified individual's conduct is done. The outcomes obtained for primarily multi-action identification and detection demonstrate the effectiveness of the suggested technique.
The area of computer vision has recently paid a lot of interest in human activity identification from video footage because of the broad variety of uses it can be put to in areas like monitoring, medical care, home automation, and teleimmersion, to mention several others. But it still has to deal with issues like human variances, obstruction, shifting lighting, and complicated backgrounds [23]. This research, study uses a unique statistically weighting segmented and ranking correlation-based selection of features strategy to examine the issues associated with multiple-person detection and categorization. In order to make the foreground as distinguishable from the backdrop as possible and to eliminate any disturbances that may already be there, a group of frames is first subjected to preprocessing. In advance of the extraction of features, a unique weighted segmented technique is developed for human separation. Color, form, and smoothness are used as ternary characteristics that are then fused utilizing the serial-based characteristics fusing approach. The ranked correlation-based selection of features strategy, which serves as an attribute enhancer and improves the accuracy of classification, is used to eliminate duplication.Six databases, comprising KTH, UCF sports, WVU, Weizmann, MSR actions and Muhavi, are used to verify the suggested approach, which is further verified using seven indicators of performance. The importance of the suggested methodologies as compared to other approaches is demonstrated by a fair comparison with previous work that is also included. For massive data, this approach is ineffective.
In the field of computer vision, the recognition of human actions using skeletal information is regarded as a viable study topic. Due to its efficient and effective outcomes, three-dimensional HAR using skeletal information has been widely employed. For understanding spatiotemporal properties from skeletal patterns, numerous approaches have been devised. Yet, there are two major issues: first, older skeleton sequencing was produced by linking various joints in a static order; second, past techniques were ineffective enough to ignore essential joints. This research especially focused on demonstrating how Multi-Task Training Networks (MTLNs) may integrate the outcome of all frames produced by various actions taken by humans and fit in the spatial arrangement of data required for action detection. CNN were shown to be able to gather spatiotemporal characteristics of skeleton patterns from various frames of human action [24].
By applying the suggested framework to the SBU Kinetic Interaction dataset, the SYSU dataset, and the NTU RGB+D dataset, the findings were greatly enhanced when compared to those of current approaches. On noisy anticipated postures from subsets of the Kinetics datasets and the UCF101 dataset, the investigation additionally developed the approach[25]. The trial outcomes demonstrated a considerable improvement utilizing the suggested methodology. This approach is ineffective because its characteristic was not tested on a larger sample size of sequencing to guarantee its resilience. It only recognizes a single action out of a sequence at the moment.
A human activity It is difficult to recognize unfamiliar perspectives. Researchers suggest a unique combination of movement and shaped temporal circumstances, two crucial action signals, into a deep view-invariant structure for human action detection. The movement streaming contains the activity's movement content in the form of RGB Dynamic Images, which are produced employing Approximation Ranking Pooled (ARP) and analysed with the help of the InceptionV3 framework. The shape-based temporal structure streaming employs a series of LSTM and Bi-LSTM learning frameworks to teach long-term view-invariant form patterns of activity.The structurally equivalent index matrix-based key depths individuals’ position frames are produced by the Human Posture Modelling and contain viewinvariant information. The three kinds of subsequent fusing techniques—maximum (max), averaging (avg), and multiplication (mul)—applied to the results of each stream—are used to determine the action's eventual prognosis. Several publicly accessible benchmarks—the NUCLA multi-view information set, the UWA3D-II Activities dataset, and the NTU RGB-D Activities dataset—are used in the studies to verify the effectiveness of the innovative system that has been suggested. In terms of identification accuracy, the ROC curve, and the Area Under the Curve (AUC), the suggested approach performed noticeably better than the current state-of-the-art. This approach was unsuccessful because it did not increase the action recognition's resistance to intra-class fluctuations across an extensive amount of examples [26].
The majority of the HAR structures that have been previously suggested have emphasized leveraging hand-crafted image attributes. These characteristics, nevertheless, only address a portion of the issue and exhibit a performance decrease when applied to big and intricate datasets. The study thus offers a unique HAR technique in this study that combines deep features and traditional hand-crafted features utilizing a histogram of directed gradients. At first, a saliency-based approach that is applied in two stages is used to gather a person's silhouette. Movement and geometrical characteristics are obtained from the channel that was selected in the initial stage, and the Chi-square separation among the retrieved and threshold-based minimum separation characteristics is calculated in the subsequent stage. The recovered deep CNN is then combined with manually created features to get a resulting vector. Additionally, an entropy-based selection of features method is suggested to find the most discriminating characteristics for categorization utilizing Multi-Class Support Vector Machines (M-SVM) in order to combat the curse of dimensions. Five openly available comparison datasets, comprising UCF Sports, IXMAS, Weizmann, UT-Interaction, and UCF11 (YouTube) are used for all computations [27]. A comparative analysis is also provided to demonstrate that the suggested model outperforms a few existing approaches.
Table 1. Summary of HAR based works on UCF dataset
|
Authors |
Method |
Advantages |
Limitations |
|
Yadav et al. (2016)[29] |
Motion Boundaries |
Used temporal localization information for interest point detection and showed the importance of temporal localization for video representation |
Improvement is needed to make more robust to scale and view invariance |
|
Cho et al.(2014) [30] |
Robust action recognition |
Local consistent group sparse coding integrates motion and group sparsity |
Robust sparse representation for action recognition was required |
|
S. Sharmaet al. (2015) [31] |
Soft attention |
Model was trained using back propagation to consider dynamic variation in video sequence. |
Improvements in the model framework to consider scale invariance and robust actions is a need |
|
Wang et al. (2011)[32] |
Dense Trajectories |
Action recognition based on interest points characterized by their detectors, descriptors and fusion methods. |
Unique properties of temporal dimension such as object persistence and smoothness was not considered |
Within the field of computer vision, it continues to be difficult to identify human beings in a video clip. Up until this point, a number of methods have been put forth, including silhouette identification, local space-time characteristics, and optical flow algorithms. In order to solve the issue, a supervision approach is first suggested in this study, which is subsequently followed by unsupervised instruction utilizing the auto-encoder concept. In this article, the study provides a brand-new foreground identification framework that depends on data taken from the Gaussian Mixture Model (GMM) and combined with the uniform Movement of Optical Flows (MOF). Therefore, the computational expense of silhouette separation may be reduced by using a quick dynamical frame-skipping strategy to exclude frames that include unneeded movement. In addition, a novel representational approach that relies on the superposition of individual silhouettes to generate a descriptive notion for recognising human actions is described. This strategy was described in an investigation as the History of Binaries Movement Imagery (HBMI). The Sparce Stacking Auto-encoder (SSAE), a method for deep learning, for example, is offered for effective human behaviour recognition and the Softmax (SMC) for categorization in order to assess the technique on the Ixmas, KTH datasets, and Weizmann. This classification system uses deep learning to develop functional hierarchies, placing functions that are more complex at smaller-scale operations offering an adaptable, reliable, and straightforward technique. The outcomes demonstrate the effectiveness of the suggested approach with regard to the inconsistency in the execution of a task, shape deformation, shifting perspective, and major variations in scale [28]. Other than these a few notable works on HAR is summarized in Table 1, each of these work are closely comapred with the proposed work.
3. Dataset and Methodology 3.1. Dataset Details
UCF11 is a challenging dataset for video-based movement detection because of variations in lighting, a crowded background, and camera movements. It contains 150 video clips with a dimension of 640 x 480 gathered from various activities, including standing, walking, working, sleeping, eating, and sitting. The collection of action videos focused on everyday activities comprises footage from broadcasting channels, including ESPN and the BBC. These films show realistic and authentic activities from various angles and settings. The video collecting window was 640 pixels in dimensions, and the frame rate for the gathering was 30 frames per second. Each video clip lasted about three seconds ( i.e., 30 frames per sec x 3 sec of each clip = 90 frames) under two different lighting conditions—normal and low light—and captured five different human actions: sitting, walking, bending, squatting, and falling.
-
3.2. Method
Appearance, motion designs, pace, and execution-style of human activity can vary significantly in recognizing human activity. The system must consider these variances and generalize well across various instances of a similar action to identify and categorize activities [33] accurately. Human activity frequently occurs in congested settings with obstacles and complicated backdrops in everyday situations. As a result, it might be difficult to reliably identify and follow individuals, particularly when other people or things entirely or partially obscure them. The problem is that there is no precise method for broadly inferring human behaviors from sensor data. The technological issue is brought on by the vast amount of data generated by the sensors and the usage of these attributes to create algorithms. The discovery of substantial data from many low-level measurements has advanced significantly using conventional techniques for recognizing patterns. However, only a few actions and information gathered in controlled circumstances make such recognition models effective. The lack of domain expertise and crude techniques for extracting features make it challenging to complete complicated HAR jobs. The shallow features collected compromise the effectiveness of unsupervised learning algorithms and associated activity. Deep learning techniques are capable of learning higher-order characteristics. Developing these models opens up the possibility of learning from human activity to enhance the prediction of models' effectiveness. The three computational elements of the framework are input data gathering, subimage formation, extraction of features, and outcome fusion and activity identification. This study aims to create a framework that can forecast various human behaviors, such as sitting, standing, walking, working, and sleeping. A systematic process, including sensor engineering, information processing, and deep learning approaches, usually occurs when creating human activity identification systems. A 3D-convolution network with 10 layers was utilized for learning implicit motion features achieve high representational capacity for human action recognition [34]. A composite feature vector from the Discriminant of Guassian (DoG) and Difference of Wavelet (DoW) with Linear Discriminant Analysis (LDA) was used to eliminate the duplicate data that boosted in recognizing human action and the performance were compared with respect to different motions [35].
Video segmentation entails breaking the movie into relevant segments or shots to organize and analyze the data efficiently. The study used FFmpeg software to turn the video data into separate image sequences, which were then scaled and normalized to fit the deep neural network input requirements. Each image had a base resolution of 640 x 480 pixels. After scaling, the image dimensions were changed to 224 x 224 pixels. After preprocessing, the next step involves feature extraction using pre-trained CNN models such as VGG16, ResNet, and Inception. Three-dimensional deep convolutional neural networks (3D-DCNN) were used to recognize human actions and color instructions. Convolution is the blending of information derived from the initial input information and the resulting data representation that could accurately portray the properties of the input training data. The feature map results from convolution might vary based on the kernel filter employed during convolution. When convolution is performed on the image information, a 2D kernel is used on each image's color channel. Reducing the geographical dimensionality of each hidden layer's feature map is the main objective of the pooling process. The pooling operation, or sub-sampling, is a simple procedure that involves selecting the highest or average value within the defined kernel's length and width. The DCNN's activation function is significant because it chooses whether or not to engage a neuron based on the applicability of the information it receives. The data for multiplying the neuron's input by the proper kernel weight and adding the bias number serve as the input for the function of activation, which is shown in the following layer's subsequent layer, while the output of the activation functional acts as the input, the output feature map F at position (t,h,w) for the c-th output channel is computed by convolving the input volume V with a 3D filter W ∈ RCin×Cout×Dk×Hk×Wk (where D k , H k , W k are the kernel dimensions for depth, height, and width). The following hyperparameters are managed during the training process detailed in Table 2.
Table 2. Hyperparameter Specifications
|
Hyperparameter |
Description |
Value/Details |
|
Input Clip Size |
Dimensions of the input volume |
3×90×224×224 |
|
Optimizer |
Algorithm for weight updates |
SGD with momentum |
|
Initial Learning Rate (η) |
Starting step size |
0.01 (SGD) |
|
Batch Size |
Number of samples processed per update |
32 (limited by GPU memory) |
|
Epochs |
Total training passes over the dataset |
30 epochs |
|
Weight Decay (λ) |
L2 regularization |
10-4 |
|
Momentum (ρ) |
Used with SGD |
0.9 |
|
Dropout Rate |
Regularization applied to final layers |
0.4 |
The activation characteristic of the Rectified Linear Unit (ReLU), which generates 0 when u < 0 and is linear with slopes 1 when u> 0, is used in the mechanism under consideration. The stochastic gradient descent technique updates the weights of the kernel matrix over every layer. The error between the network outcome and the anticipated output is computed in which the error value is denoted as E value , network output is denoted as (X 0 ) and the anticipated output is denoted as X a,0 :
E
Eualue ла,о ла
The module takes the feature maps from the CNN block and generates a spatial attention mask. This mask is then multiplied element-wise with the original feature maps, enhancing relevant regions. The 3D CNN outputs a sequence of frame-level features. A temporal attention module can be inserted here to generate a weighted average of these features before they are input to the LSTM. Instead of simply inputting the CNN features X=[x 1 , x 2 , ... , x 90 ] into the LSTM, an attention layer calculates a context vector ct based on the input sequence and the current LSTM state. This context vector weights the input sequence.
C t =∑ T. ОС:
t i=l
hi ti
where, α ti is the attention weight for frame i at time t and hi is the hidden state (or feature) of frame i.
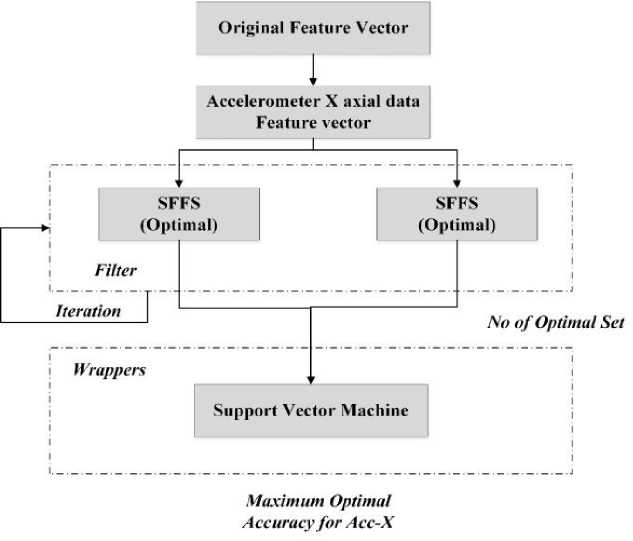
Fig. 1. Optimal Feature Selection (SFFS)
The learning algorithm must concentrate on the pertinent subset of features while ignoring unimportant ones. The specific learning method chooses the best efficiency feature subset from the training set for testing. This study used a hybrid feature selection method to reduce the dimensionality of the first feature space and provide a superior classification output. Two components make up the proposed solution: a filter-based Sequential Forward Floating Search (SFFS), in which a feature subset assessment procedure acts independently of the categorization technique, and a wrapper-based strategy, which assesses the best feature collection out of all the feature pairs that emerged from the filter-based strategy. By using a continuous procedure, SFFS performs the filter-based evaluation of features. A random procedure divides the training and testing dataset into two equal sections. The initial equal portion is separated into two pieces and applied using a filter-based strategy. The wrapper technique uses the second equal component for the test. The algorithm iterates five times and produces the ten best optimum sets before applying SFFS in the first identical section. SFFS acts as an evaluation value (fitness metric) to choose the less desirable qualities. The wrapper technique is applied to these ideal feature sets, using a support vector machine to examine many optimum sets and determine the best features. Figure 1 shows this entire procedure.
The optimal features are selected using SFFS in the filter-based method, one of the best feature selection schemes. The initial step is to create several feature subsets using SFFS. A discriminating feature set contender is found, which has the potential to be indifferent to outliers. In other words, accurately evaluating the feature set's quality is crucial in effectively discriminating the feature subset candidate. It can precisely produce a series of high-quality subsets of characteristics. Support Vector Machine (SVM) is used in the wrapper-based technique on the second identical portion for testing purposes. Therefore, the SVM is fed into the ten optimal sets obtained from the filter-based technique. Out of the ten ideal sets, the best feature set must be measured using SVM. Table 3 displays the outcomes for 1, 2, or 3 feature characteristics found using Brute Search, Lite Search, and SFFS feature search parameters.
Table 3. Recognition Rate Comparison
|
Feature |
Brute Search |
Lite search |
SFFS |
|||
|
Feature |
Rate |
Feature |
Rate |
Feature |
Rate |
|
|
1 |
8 |
83.8% |
7 |
84.8% |
14 |
45.6% |
|
2 |
9 17 |
94.6% |
7 26 |
90.9% |
14 19 |
60.1% |
|
3 |
3 8 22 |
95% |
7 19 26 |
93.2% |
14 19 24 |
56.2% |
Each method was applied to a set of features, and the rates indicate the percentage of features selected by each method. In the Brute Search approach, eight features were selected, accounting for 83.8% of the available features. On the other hand, Lite Search selected seven features with a rate of 84.8%. Lastly, SFFS selected 14 features at a rate of 45.6%. Moving on to the second row, Brute Search selected 9, 17 features, resulting in a selection rate of 94.6%. Lite Search chose 7, 26 features with a rate of 90.9%, and SFFS selected 14, 19 features at 60.1%. In the last row of the table, Brute Search selected 3, 8, and 22 features, representing a total selection rate of 95%. Lite Search selected 7, 19, and 26 features with a rate of 93.2%, while SFFS selected 14, 19, and 24 features at 56.2%. Overall, these results demonstrate the varying effectiveness of the three feature selection methods. Brute Search tended to select more features with lower rates, while Lite Search had slightly lower feature counts but higher rates. SFFS, on the other hand, had a moderate feature count with varying rates across different sets of features.
It has been observed from past works that feature selection affects both the difficulty of data modeling and recognition rates. A feature will be incorporated into the selection set if it works well. Each classifier will now handle a reduced number of features. Additionally, rather than using the same feature set for all classes, different feature characteristics are utilized for various classifiers and classifications. One such hierarchical classifier is displayed in Figure 2. The recognition of the five various human activities is divided into four separate categorization tasks, each yields a binary choice. Using a collection of features chosen, the first classifier distinguishes between the meta-classes "Active, Inactive" and "Walking, Running, Fighting". Then, other classifiers will make an effort to differentiate between "Active" and "Inactive," and so on. With this flexibility, the method can utilize different features for each tier of the hierarchical classification and specialize characteristics for each subset of categories. Table 3 displays the recognition percentage attained using the hierarchical classifier with one, two, or three characteristics chosen by the feature selection as in Table 2.
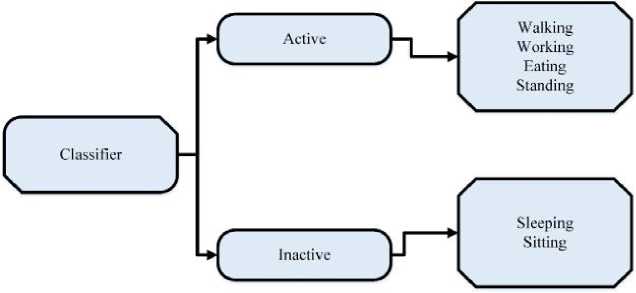
Fig. 2. Classification with Error Percentage
With the exception of classifier 2, all classifiers used three features that lowered the single layer classification's 6% percentage of errors to 1.5%.
Table 4 provides the results of three different feature selection methods: Brute Search, Lite Search, and SFFS Search, where Class 1 - standing, Class 2 - sitting, Class 3 - Sleeping, Class 4 - walking, Class 5 - working, Class 6 – Eating activities. Each method was applied to other classes of features, and the rates indicate each class's feature inclusion percentage. In Class 1, both Brute Search and Lite Search selected feature 19 with a high regularity rate of 98.5%, while SFFS Search also chose feature 19 with a slightly lower regularity rate of 91.5%. For Class 2, Brute Search and Lite Search selected feature 18 with a regularity rate of 96.6%. Similarly, SFFS Search included feature 19 with a slightly lower regularity rate of 93.2%. In Class 3, Brute Search achieved a high regularity rate of 99.6% by selecting features 15, 8, and 18. Lite Search also had a high regularity rate of 99.8% by choosing features 19, 8, and 15. However, SFFS Search included features 13, 24, and 26 with a regularity rate of 90.7%. The table illustrates the performance of the three feature selection methods across different classes and features. Brute Search and Lite Search generally achieved higher regularity rates, while SFFS Search sometimes demonstrated a more conservative approach with lower regularity rates.
4. Results and Discussion
The experiment involved setting up a powerful computer with an Intel Xeon Workstation @3.31 GHz and 16 GB of memory installing the necessary software libraries. A diverse dataset of video sequences depicting various human activities was collected, ensuring a representative distribution of activities considering 10 frames per 0.15 seconds during test time. A deep learning model, such as a Convolutional Neural Network (CNN) or a Recurrent Neural Network (RNN), was developed and trained using the dataset, with careful consideration given to model architecture and transfer learning techniques. The model's performance was evaluated using metrics such as accuracy, precision, recall, and F1 score are shown in Table 5 and additional experiments were conducted to assess its robustness under different conditions. Furthermore, a comparison was made with baseline methods to highlight the advantages of the deep learning approach. The experimental evaluation provided insights into the model's performance, strengths, limitations, and its superiority over traditional methods, showcasing the potential of utilizing deep learning for human activity detection in video sequences.
Table 4. Recognition Rate Comparison
|
Feature |
Class |
Brute Search |
Lite Search |
SFFS Search |
||||||
|
Feature |
Reg Rate |
Feature |
Reg Rate |
Feature |
Reg Rate |
|||||
|
1 |
1 |
19 |
98.5% |
89.7% |
19 |
98.5% |
91.5% |
15 |
90.3% |
92.3% |
|
2 |
18 |
96.6% |
18 |
96.6% |
19 |
93.2% |
||||
|
3 |
6 |
95% |
6 |
95% |
24 |
85.8% |
||||
|
4 |
8 |
72.2% |
8 |
99.2% |
10 |
86.6% |
||||
|
5 |
10 |
80.5% |
15 |
67.7% |
14 |
99.6% |
||||
|
6 |
12 |
70.7% |
20 |
89.9% |
17 |
98.5% |
||||
|
2 |
1 |
8 19 |
97.4% |
87.2% |
19 8 |
97.4% |
91.2% |
15 24 |
90.9% |
93.6% |
|
2 |
1 18 |
98.4% |
16 2 |
98.4% |
19 16 |
92.3% |
||||
|
3 |
3 20 |
96.8% |
6 20 |
96.8% |
24 19 |
93.9% |
||||
|
4 |
120 |
65.6% |
120 |
79.8% |
2420 |
98.7% |
||||
|
5 |
78 |
70.3% |
320 |
80% |
1213 |
95.5% |
||||
|
6 |
6 8 |
94.8% |
5 7 |
94.8% |
12 19 |
90.4% |
||||
|
3 |
1 |
15 8 18 |
99.6% |
82.38% |
19 8 15 |
99.8% |
84.6% |
13 24 26 |
90.7% |
94.2% |
|
2 |
11 4 5 |
90% |
17 1 12 |
65.8% |
19 18 15 |
92.5% |
||||
|
3 |
11 19 22 |
90.7% |
5 20 16 |
81.8% |
23 19 15 |
96.3% |
||||
|
4 |
13 16 21 |
70% |
3 33 1 |
80.4% |
14 |
99.6% |
||||
|
5 |
11 8 15 |
60.8% |
5 8 16 |
80.8% |
17 |
98.5% |
||||
|
6 |
8 24 25 |
83.2% |
8 5 3 |
99.4% |
12 19 24 |
87.8% |
||||
The heat map graphs in Figures 3 and 4 for both the training and test sets provide valuable insights into the distribution and patterns of data in a machine-learning model. The training set heat map graph depicts the relationships and correlations among the features used to train the model, showcasing high and low-concentration areas. It helps identify any biases, outliers, or clusters within the data that could impact model performance. On the other hand, the test set heat map graph showcases how well the trained model generalizes to new, unseen data. By comparing the two heat maps, we can assess whether the model has overfitted or underfitted the training data and if it has captured the underlying patterns and relationships in the test set. These heat map graphs are essential for evaluating the model's performance, understanding its strengths and limitations, and making informed decisions for further model improvement or deployment.
Table 5. Performance Evaluation
|
Performance Metrics |
% Value |
|
Accuracy |
93.72% |
|
Precision |
90.61% |
|
Recall |
76.69% |
|
F1-Score |
82.76% |
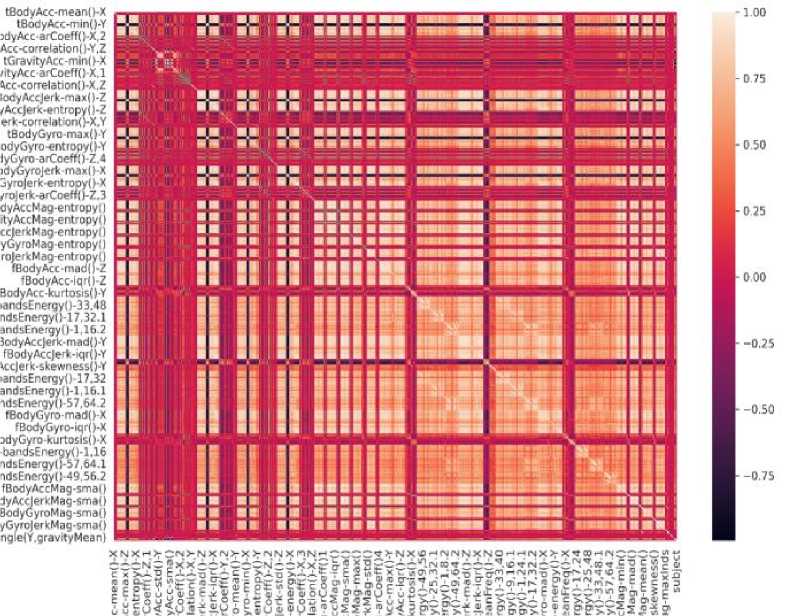
Fig. 3. Training set heat map
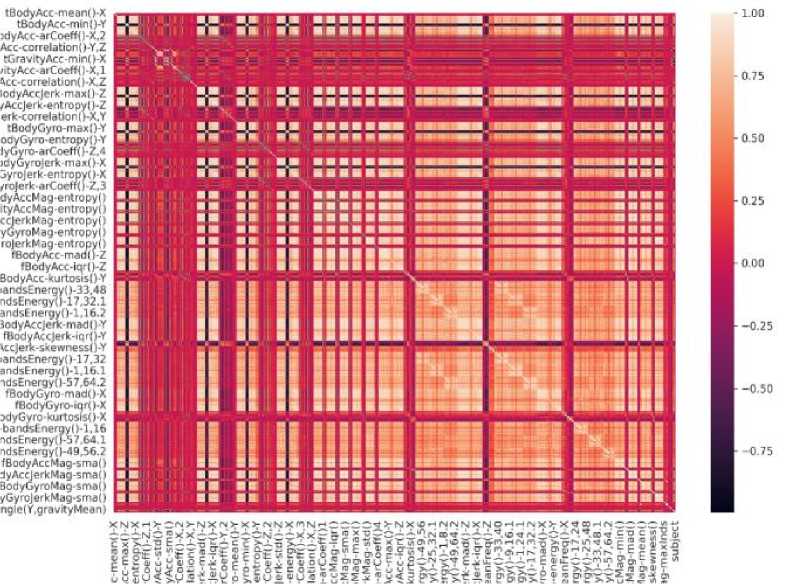
Fig. 4. Test set heat map
Figure 5 displays the distribution of data points across different activities: standing, sitting, sleeping, walking, working, and eating. Among these activities, the highest number of data points is associated with sleeping, reaching 1400. This graph provides a visual representation of the dataset, highlighting the varying frequencies of each activity and providing useful information for analyzing activity patterns or building predictive models related to human behavior.
Figure 6 illustrates the accuracy rates of two distinct activity categories: stationary and moving. Standing, sitting, and sleeping exhibit high accuracy rates within the stationary activities, indicating that these activities can be reliably detected and classified using the measured data of t_bodyAccMag mean and density. The peaks of these accuracy rates highlight the successful identification and differentiation of these stationary activities with a significant level of precision. On the other hand, the moving activities, including walking, working, and eating, display lower accuracy rates than the stationary activities. The classification of these moving activities suggests that based on t_bodyAccMag mean and density data, it is relatively more challenging or prone to errors.
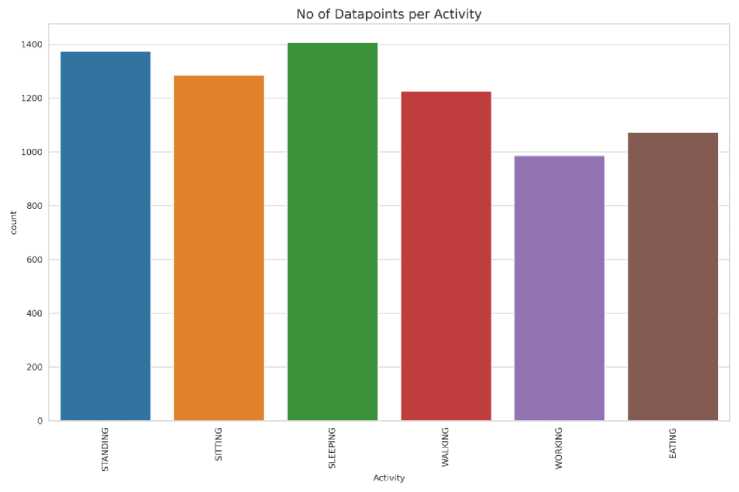
Fig. 5. Datapoint per Activity
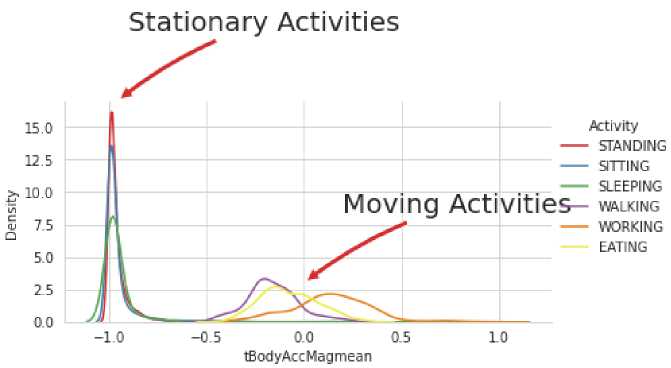
Fig. 6. Activity Representation
Figure 7 shows the frequency of user data graphs of various activities. These activities were repeated for a total of 30 times, with each activity occurring anywhere between 20 to 80 instances. Walking had the highest count, accounting for 80% of the recorded activities. Walking emerged as the predominant activity in the dataset, indicating its significance in the user's daily routine. The remaining activities occurred in varying frequencies, suggesting a balanced mix of rest, productivity, and sustenance throughout the recorded period. The prominence of walking in the dataset highlights its importance in maintaining an active lifestyle and signifies its potential impact on overall health and wellbeing.
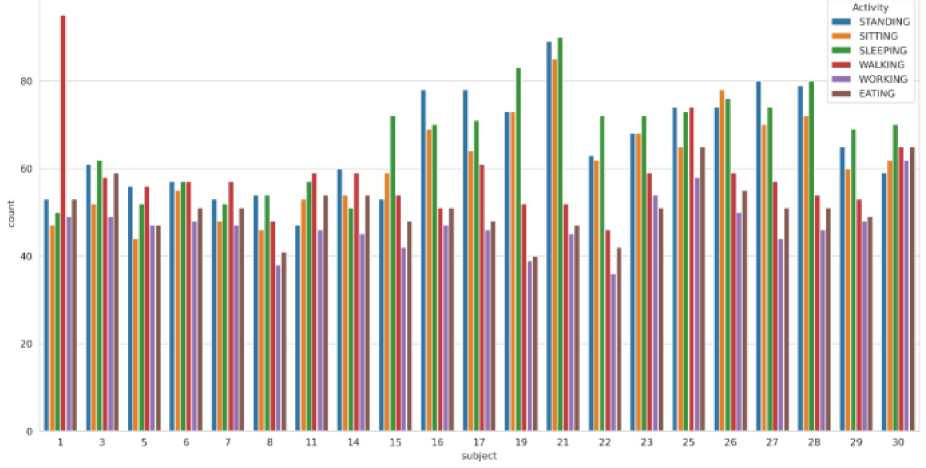
Fig. 7. Data Provided by each user
The experimentation and results discussion concludes by comparing our approach with state-of-the-art methods. According to Table 6, our approach surpasses the accuracy of other referenced methods in the UCF11 dataset. However, compared to other state-of-the-art outcomes, our suggested framework is more precise, boasting an accuracy of 93.72%, which is 2.42% higher than the previous best result.
Table 6. Comparison of the average accuracy of the proposed method with state-of-art methods on the UCF11 dataset
