Life expectancy in Russia's regions

Author: Skipin Dmitrii L., Yukhtanova Yuliya A., Kryzhanovskii Oleg A., Tokmakova Elena G.
Journal: Economic and Social Changes: Facts, Trends, Forecast @volnc-esc-en
Section: Social and economic development
Article in issue: 2 т.15, 2022.
Free access
Life expectancy at birth is used as a comprehensive indicator of public health and socioeconomic development. The impact of the quality of healthcare, reginal economic development and people’s welfare on life expectancy at birth in Russia requires more detailed and system-wide scientific substantiation at the level of RF constituent entities. The novelty of the study consists in identifying the impact of various factors on the increase in life expectancy by constructing panel vector autoregressions in groups of Russian regions identified with the help of clustering and showing similar rates of increase in life expectancy. The results of the obtained models in the context of the formed clusters demonstrate that the increase in life expectancy in all clusters correlates with the positive dynamics of economic development in the region and the increase in average per capita income. Factors contributing to the organization of the healthcare system in the regional context are poorly related to life expectancy indicators due to the underfunding of this area, orientation toward a decrease in the provision of beds in hospitals due to the optimization of the healthcare system and the cumulative nature of the impact. The conclusions obtained in the course of our study can be used in the practice of managing the quality of life and socio-economic development in Russia’s regions.
Life expectancy, factors, region
Short address: https://sciup.org/147238037
IDR: 147238037 | UDC: 332.1 | DOI: 10.15838/esc.2022.2.80.10
Text of the scientific article Life expectancy in Russia's regions
Life expectancy (LE) at birth is a generally recognized indicator of public health at the state and regional levels, which is among the main factors contributing to the quality of human resources (Marmot, 2005; Alam et al., 2015; Wilson et al., 2020). LE also acts as a broad social indicator that covers a number of fundamental aspects of social well-being (Wilkins, Adams, 1983). LE is also actively used in the calculations of integral development indicators: the Human Development Index (HDI) (Stanton, 2007), the Gender-Related Development Index (GDI) (Klasen, Schuler, 2011), the Physical Quality of Life Index (PQLI) (Morris, 1980).
LE is studied in relation to the state of health of the nation, quality of life, and human capital. To this end, scientists analyze the results of governmental socio-economic policy and its impact on the health of the population as a whole and individuals, taking into account clinical, epidemiological and environmental developments.
Constructing models of various levels of complexity and detail helps to shed light on the possibilities of managing LE indirectly through major drivers of its dynamics.
It is interesting to point out a study by A. Bergh and T. Nillson, which analyzes the relationship between the economic, social, and political dimension of globalization, and life expectancy on the basis of panel data from 92 countries for 1970– 2005. The authors found out a positive impact of economic globalization on life expectancy and also assessed the effect of such factors as income, consumption, quality of nutrition, the possibility of obtaining education and health services, etc. on life expectancy (Bergh, Nillson, 2010).
The work of R. Desbordes analyzes the relationship between life expectancy and gross domestic product (GDP) per capita in 47 countries in 1940 and 1980, in some of them a nonlinear relationship between life expectancy and per capita income was revealed (Desbordes, 2011). The statistical dependence of life expectancy on the economic situation of the country was confirmed on the basis of observations in 1940, 1980 and 2000. It is concluded that LE has a generally positive impact on economic growth and people’s income, but this impact is not direct and largely depends on the prevailing social conditions (Cervellati, Sunde, 2011a; Cervellati, Sunde, 2011b).
M. Biyase and M. Malesa investigated the causal relationship between life expectancy and economic growth in a sample of 10 member states of the Southern African Development Community for the period from 1985 to 2017. The scientists have come to the conclusion that LE has a positive effect on economic growth. The stability of the results was confirmed by adding the variables such as inflation, openness of trade, government spending (Biyase, Malesa, 2019). Another team of authors conducted a study on 16 African countries for 1970–2012. Using nonparametric methods, they found out that improving the health infrastructure and economic growth can play a decisive role in increasing the level of LE (Shahbaz et al., 2019). L. He and N. Li found a bidirectional relationship between life expectancy and economic growth for 65 countries according to the data for the period from 1980 to 2014 (He, Li, 2020). As part of the analysis of the data for 1992—2016, T. Govdeli confirmed a twoway causal relationship between economic growth and life expectancy using the example of the E7 countries (China, India, Brazil, Mexico, Russia, Indonesia and Turkey) (Govdeli, 2019).
Socio-economic inequality among various population strata on the basis of an integrated indicator, including average per capita income and LE, was estimated by M. Pandey and J. Nathwani (Pandey, Nathwani, 1996). M. Gurler and O. Ozsoy investigated the long-term relationship between per capita monetary income and life expectancy based on panel data from 56 developing countries in North Africa, the Middle East and Southeast Asia for the 1990–2015 period. As a result, they show that economic growth according to Granger causes an increase in life expectancy only for panel data, but not for cross-sectional data (Gurler, Ozsoy, 2019). The results of a study by A. Sirag and colleagues indicate the existence of a non-linear relationship between LE and economic growth. In particular, an increase in LE has a positive effect on economic growth, but only up to a certain threshold level, any further increase in LE has a negative impact (Sirag et al., 2020).
When addressing the task at hand, we consider it important to look at F. Halicioglu’s research on life expectancy in Turkey in 1965–2005 in relation to certain social, economic and environmental factors. Empirical results have shown that the quality of nutrition, its availability and healthcare costs are the main conditions for increasing life expectancy, while smoking causes many diseases and shortens life (Halicioglu, 2011).
A team of scientists analyzed the factors that determine life expectancy in the United States. For example, along with socio-demographic, economic factors, provision of medical facilities and health services, a favorable environment positively affects life expectancy (Poudyal et al., 2019).
H. Mahyar, using the 1966–2013 data on Iran as an example, found that economic growth had a positive statistically significant impact on life expectancy (Mahyar, 2016). The Preston model is also of interest, it reflects the relationship between LE and gross domestic product per capita, given in comparable prices (Preston, 1975; Edwards, 2016).
The World Bank’s World Development Report 2018 (WDR 2018) – LEARNING to Realize Education’s Promise notes that almost a quarter of children around the world are stunted and this hinders their cognitive development1. Meanwhile, half of the world’s population is not covered by basic health services, and 80% of poor people in low-income countries do not have social protection.
Nevertheless, simple cross-country comparisons of healthcare systems turn out to be unreliable due to a significant difference in indicators. Developed, developing and poor countries face not only underfunding of healthcare, but also significant distortions associated with mismanagement in the system (Merson et al., 2006). We agree with V. Mau who noted that effective systems that meet modern challenges, including those in the healthcare system, simply do not exist in the world (Mau, 2013).
In Russia, there still remain significant differences between regions, despite huge efforts undertaken to improve the situation. The task of optimization in the Russian healthcare system has turned from an economic problem into a large-scale social issue (Shabunova et al., 2017). G.F. Romashkina and colleagues, studying health capital at the meso-level, which includes LE, found out that according to this indicator, the regions of the Arctic zone lag significantly behind the all-Russian level and the dynamics remain negative. The decline is due not only to differences in the development of territories and the quality of healthcare, but to other factors as well (Romashkina et al., 2020).
Empirical research on LE based on Russian data in the context of regions are mainly focused on studying the dependence of LE on economic and social factors (Prokhorov, 2011; Lokosov et al., 2018; Chistik, Blinova, 2018; Lavrinenko, Rybakova, 2015; Kossova et al., 2017; Kostromina, 2017; Zhukova et al., 2016; Shkol’nikov et al., 2014; Andreev, Shkol’nikov, 2018; Kolosnitsyna et al., 2019; Kossova, 2020).
A team of specialists under the guidance of B.B. Prokhorov was studying life expectancy in the framework of the quality of public health in the regional context, according to the data from 1991 to 2007. According to B.B. Prokhorov, the quality of public health can be assessed using the following indicators: LE, standardized mortality rates, infant mortality, general morbidity. The scientists pay special attention to the dynamics of socio-economic reform in Russia and its results in the context of medical and demographic indicators (Prokhorov, 2011).
The sphere of scientific interests of V.V. Lokosov, E.V. Ryumina, and V.V. Ulyanov is connected with the research on the population quality in conjunction with regional economic indicators. By clustering regions and conducting a regression analysis, the authors studied the influence of population quality factors (one of which is life expectancy) on the indicator of sustainable development of territories – GRP per capita. As a result, it was found that the factors characterizing population quality were not among the significant ones’ however it does not diminish the importance of these indicators for studying regional and global socio-economic problems (Lokosov et al., 2018).
P.A. Lavrinenko and D.A. Rybakova conducted a comparative analysis of regional differences in public health, ecology and healthcare. At the same time, they assess public health using indicators of average life expectancy and general morbidity due to all reasons with the use of econometric methods (Lavrinenko, Rybakova, 2015). The scientists drew attention to the dependence of life expectancy in men and women on a number of factors, such as per capita income, unemployment rate, Gini coefficient, alcohol consumption, as well as mortality due to external causes, from 2008 to 2013 in Russia and by region (Kossova et al., 2017). E.V. Kostromina analyzed the prospects for economic growth and development of certain Russian regions connected with improving the quality of healthcare (Kostromina, 2017).
A.K. Zhukova, A.M. Silaev, and M.V. Silaeva studied the influence of a number of socio-ecological indicators on life expectancy in certain regions of Russia from 2000 to 2014, taking into account spatial effects. The authors divided all the regions geographically into western and eastern, and name the specifics of the influence of factors typical of these RF territories (Zhukova et al., 2016).
E.M. Andreev and V.M. Shkol’nikov confirm the need to study the dependence of LE on the economic situation in the region. The authors came to the conclusion that life expectancy in Russia is significantly lower than the level that, according to the Preston model, corresponds to the domestic gross domestic product, noting that the task of protecting health and prolonging life in modern Russia has not yet received proper priority (Shkolnikov et al., 2014; Andreev, Shkolnikov, 2018).
We agree with T.V. Kossova and co-authors who point out that life expectancy in Russia is lower than in countries with a comparable level of economic development. The study demonstrates the unequal influence of various factors, including the development of the economy and the health system, on public health, depending on the countries’ belonging to different clusters in terms of life expectancy (Kolosnitsyna et al., 2019; Kossova, 2020).
Identifying groups of countries or regions with similar characteristics by conducting cluster analysis helps to identify the influence of factors on LE in the selected groups (Lokosov et al., 2018; Lavrinenko, Rybakova, 2015; Kostromina, 2017; Kolosnitsyna et al., 2019). Most scientists assume that LE largely depends on a set of factors specific to individual countries or regions. In order to study the influence of factors on LE, the least squares method (LSM) is traditionally used for panel data (Bergh, Nillson, 2010; Desbordes, 2011; Cervellati, Sunde, 2011a, 2011b; He, Li, 2018; Govdeli, 2019; Sirag et al., 2019; Halicioglu, 2011; Poudyal et al., 2019; Edwards, 2016; Acemoglu, Johnson, 2007, Zhukova et al., 2016), a two-stage LSM (Biyase, Malesa, 2019; Halicioglu, 2011; Acemoglu, Johnson, 2007), random and fixed effects models (Bergh, Nillson, 2010; Biyase, Malesa, 2019; Gurler, Ozsoy, 2019; Kossova et al., 2017; Kostromina, 2017), spatial modeling: SAR (Spatial Autoregressive Model), SEM (Spatial Error Model), SDM (Spatial Durbin Model) (Zhukova et al., 2016).
Over the past decades, important advances have been made in the study of dynamic panel data models with fixed effects for typical conditions when the cross-section size (N) is large and the time size (T) is small. Classical regression methods based on LSM are inapplicable due to the Nickell bias, which does not disappear asymptotically if N → ∞ and T is stable (Nickell, 1981). One of the solutions to this problem is to apply the generalized method of moments estimation popularized by L. Hansen in economics (Hansen, 1982). The work of D. Holtz-Eakin, W. Newey and H. Rosen evaluates and tests the coefficients of vector autoregression on panel data. Vector autoregressions are a standard part of the toolkit of applied econometrics (Holtz-Eakin et al., 1988). It is impractical to apply standard methods for estimating vector autoregressions to panel data; therefore, modern models allow non-stationary individual effects and are evaluated by applying instrumental variables to quasidifferential autoregression equations.
The purpose of our work is to make a comparative assessment of how the changes in the factors contributing to organizing health and wellbeing influence the indicator of LE growth, taking into account the specifics of formation of LE in the selected groups of regions with similar characteristics of its growth. Tasks: to identify clusters of RF constituent entities according to the growth rates of life expectancy due to strong interregional differentiation; to assess the influence of healthcare and well-being factors in the selected clusters reflecting regional features in the formation of LE; to discuss the results of testing the interrelation of factors on LE in the context of the formed clusters.
The novelty of our study consists in identifying the features of the influence of factors on the growth of LE by constructing panel vector autoregressions in selected groups of RF regions with similar rates of increase in life expectancy.
Materials and methods
Based on the regional panel data of Rosstat for 1995–2017, time series clustering using DTW (Dynamic Time Warping) is carried out according to the growth rates of life expectancy in one calendar year. DTW time series clustering is a dynamic programming algorithm that tries to find the optimal transition path between two series. Within the framework of the selected clusters, panel vector autoregressions (Sigmund, Ferstl, 2021) of the increase in LE depending on the drivers of development of the healthcare system and people’s well-being were constructed. The PVAR (Panel Vector Autoregression) model is a combination of a dynamic panel model (DPM) with one equation and a vector autoregression model (VAR) for p lags of m endogenous variables (matrix of coefficients At (m x m)), к predefined variables (matrix of coefficients and strictly exogenous variables (matrix of coefficients C(m x n)):
y i,t = - i + Е^ЛУ^ -г + Bx i t + Cs i t + € l>t . (1)
Its main advantage consists in the use of all values of all independent variables as tools, which allows us to get closer to the true estimate of the coefficient. The task of such an analysis is to find and prove a statistically significant influence of a factor on a dependent variable.
The popularity of the PVAR model in empirical economics is confirmed by the high citation of the work of I. Love and L. Zicchino (Love, Zicchino, 2006). They represent an unofficial STATA code, which was expanded by M. Abrigo and I. Love (Abrigo, Love, 2016), using the Generalized Method of Moments (GMM), an estimation method of the first generation proposed by T. Anderson and C. Hsiao (Anderson, Hsiao, 1982) to cope with the Nickell bias (Nickell, 1981). The panelvar package used in the work implements a direct extension of the method of T. Anderson and C. Hsiao, the method for the first difference GMM estimation (Holtz-Eakin et al., 1988; Arellano,
Bond, 1991) and a more complex GMM system (Blundell, Bond, 1998) for the PVAR model.
The choice of indicators is based on the experience of many empirical works (Alam et al., 2015; Bergh, Nillson, 2010; Desbordes, 2011; Cervellati, Sunde, 2011a, 2011b; Biyase, Malesa, 2019; Shahbaz et al., 2019; He, Li, 2020; Govdeli, 2019; Pandey, Nathwani, 1996; Gurler, Ozsoy, 2019; Sirag et al., 2020; Halicioglu, 2011; Poudyal et al., 2019; Mahyar, 2016; Preston, 1975; Edwards, 2016; Chistik, Blinova, 2018; Kossova et al., 2017; Kostromina, 2017; Zhukova et al., 2016; Kolosnitsyna et al., 2019; Kossova, 2020) and the availability of data in Rosstat’s statistical reporting. The sample consists of 1,580 observations in 83 regions for 1995–2017. Panel data analysis increases the reliability and stability of conclusions. Analyzing modern research, it is possible to identify factors considered as determinants of life expectancy, the main of which are economic factors, health organization, urbanization, food consumption, living conditions: provision of hospital beds per 10,000 people (availab_hosp); capacity of outpatient clinics per 10,000 people (power_clinics); population per doctor (popul_doc); number of mid-level practitioners (doc_middle_level); real gross regional product per capita (grp_real); average per capita real monetary income in rubles (income_real); number of deaths broken down by stratum and individual causes of death per 100,000 people per year, cause of death – homicide (mdk); number of own light motor vehicles per 1,000 people (cars); total area of residential premises, on average per inhabitant (living_space); consumption of meat and meat products (including by-products of category II and raw fat) per capita (consume_meat); share of urban population in the total population (share_urban).
In the present study, we put forward the following hypothesis: the trend of changes in LE in the selected clusters is not equally related to the dynamics of welfare, health organization, urbanization, food consumption, and living conditions.
Results
Based on Rosstat data, we designed maps of life expectancy at birth in RF constituent entities in 1995 and 2017. During the period under consideration, life expectancy at birth tended to increase (Fig. 1, 2) .
The average life expectancy was the highest (more than 73 years) in the North Caucasian Federal District, namely in the Republics of
Dagestan and Ingushetia. The smallest average value of life expectancy (58.6 years) was demostrated by the Republic of Tyva (Siberian Federal District). The maximum life expectancy (81.59 years) was recorded in the North Caucasus Federal District, the minimum (53.76 years) – in the Siberian Federal District. The distribution of life expectancy by region shows the greatest
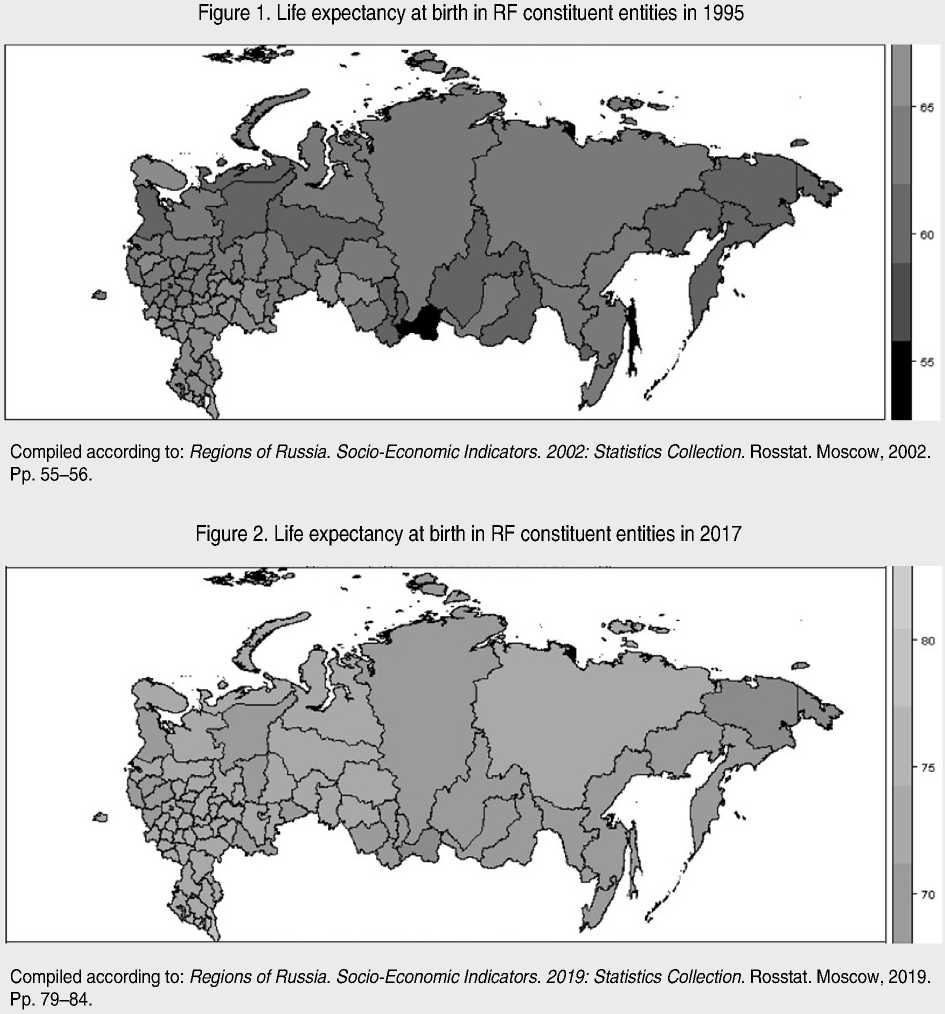
variation in life expectancy in the regions of the Northwestern, Ural and Siberian federal districts, with a relatively small variation in this indicator in the Southern, Volga and Far Eastern federal districts.
Due to the fact that life expectancy in all the observed RF constituent entities has increased significantly over the studied period and is showing an upward trend, the generated data panel was checked for stationarity. The extended Dickey– Fuller test for life_expectancy with a constant and trend revealed the absence of stationarity for all analyzed regions in terms of life expectancy. Therefore, in addition to the fact that monetary variables are taken in constant prices for the construction of econometric models, dependent and explanatory variables are taken in logarithm differences (percentage increments year to year, the prefix dlog_ is introduced for all variables subject to this procedure (Alam et al., 2015; Bergh, Nillson, 2010; Desbordes, 2011; Cervellati, Sunde, 2011a, 2011b; Shahbaz et al., 2019; He, Li, 2020; Govdeli, 2019; Gurler, Ozsoy, 2019; Halicioglu, 2011; Poudyal et al., 2019; Preston, 1975; Edwards, 2016; Zhukova et al., 2016; Kolosnitsyna et al., 2019; Kossova, 2020), the suffix _lag1 is used to denote lag variables (for the previous year) (Bergh, Nillson, 2010; He, Li, 2020; Govdeli, 2019; Halicioglu, 2011; Mahyar, 2016).
The extended Dickey–Fuller test for life_ expectancy with a constant and trend indicates the presence of stationarity for all the analyzed regions according to the difference in the logarithms of life expectancy.
Changes in life expectancy over the analyzed period in the regions have a general positive trend, but the growth rates vary significantly. We carry out the clustering of DTW time series according to the growth rate of life expectancy for one calendar year.
As a result of clustering, we identified eight clusters (Tab. 1, Fig. 3) .
The first cluster includes the following regions: Adygea, Astrakhan Oblast, Republic of Bashkortostan, Belgorod Oblast, Republic of Chuvashia, Saint Petersburg, Republic of Dagestan, Khanty-Mansi Autonomous Okrug, Krasnodar Krai, Kurgan Oblast, Kursk Oblast, Lipetsk Oblast, Republic of Mordovia, Moscow, Moscow Oblast, Nizhny Novgorod Oblast, Novosibirsk Oblast, Omsk Oblast, Oryol Oblast, Orenburg Oblast, Rostov Oblast, Ryazan Oblast, Yakutia, Samara Oblast, Saratov Oblast, Stavropol Krai, Republic of Tatarstan, Tyumen Oblast (without the autonomous okrugs), Ulyanovsk Oblast, Volgograd Oblast, Voronezh Oblast. This cluster is characterized by a low average annual increase in life expectancy, the lowest variance, that is, changes from year to year are the least volatile compared to other clusters (Fig. 4) .
Table 1. Descriptive statistics for life expectancy growth rate in RF constituent entities for 1995–2017
|
Cluster |
I |
II |
III |
IV |
V |
VI |
VII |
VIII |
|
Minimum |
-2.66 |
-2.84 |
-3.97 |
-8.49 |
-2.66 |
-4.52 |
-2.08 |
-4.10 |
|
Maximum |
4.05 |
5.64 |
4.82 |
6.86 |
5.00 |
7.17 |
12.39 |
4.21 |
|
Standard deviation |
0.87 |
1.17 |
1.34 |
3.35 |
1.91 |
2.90 |
2.84 |
2.05 |
|
Arithmetic mean |
0.46 |
0.53 |
0.53 |
0.46 |
0.96 |
0.85 |
1.14 |
0.84 |
|
Median |
0.48 |
0.60 |
0.62 |
0.89 |
0.88 |
0.56 |
0.47 |
0.97 |
|
Number of regions |
32 |
22 |
24 |
1 |
1 |
1 |
1 |
1 |
|
Regions |
In the text |
In the text |
In the text |
Chukotka AO |
Ingushetia |
Nenets AO |
Sakhalin Oblast |
Tyva |
|
Proportion of RF population in 2017, % |
59.72 |
15.97 |
23.35 |
0.03 |
0.34 |
0.03 |
0.34 |
0.22 |
|
Calculated according to: Regions of Russia. Socio-Economic Indicators. 2002– |
2019: Statistics Collection. Rosstat. Moscow, 2002–2019. |
|||||||
Figure 3. Clustering RF constituent entities by growth rate of life expectancy at birth
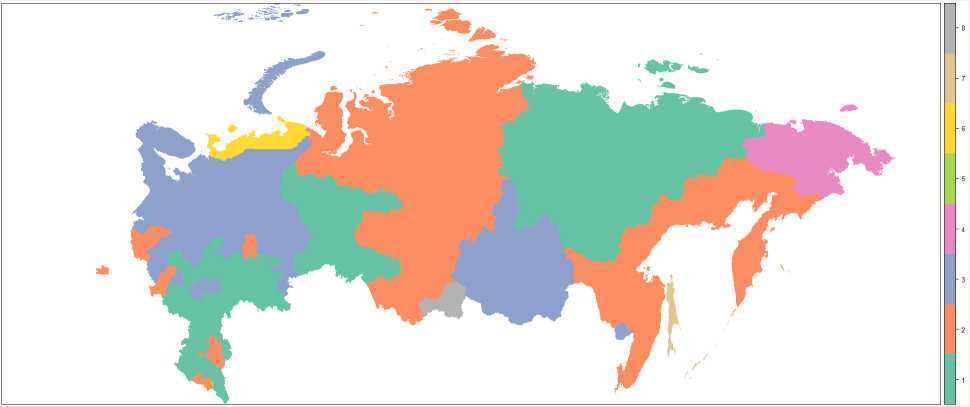
Compiled according to: Regions of Russia. Socio-Economic Indicators. 2002–2019: Statistics Collection. Rosstat. Moscow, 2002–2019.
Figure 4. Dynamics of the increase in life expectancy at birth, broken down by cluster
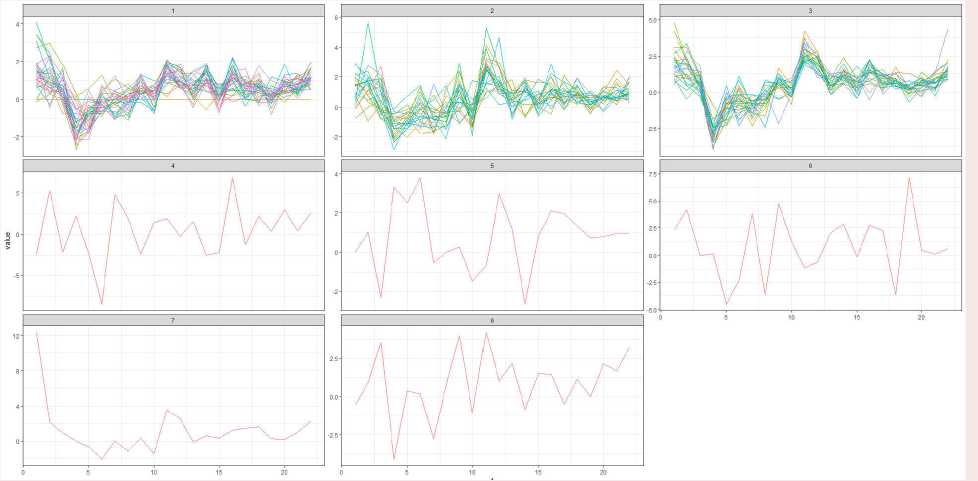
Compiled according to: Regions of Russia. Socio-Economic Indicators. 2002–2019: Statistics Collection. Rosstat. Moscow, 2002–2019.
The second cluster includes the following regions: Altai Krai, Amur Oblast, Bryansk Oblast, Altai Republic, Kabardino-Balkaria, Kaliningrad Oblast, Republic of Kalmykia, Kaluga Oblast, Kamchatka Krai, Karachay-Cherkessia, Kemerovo Oblast, Khabarovsk Krai, Republic of Khakassia, Krasnoyarsk Krai, Magadan Oblast, North Ossetia, Novgorod Oblast, Primorsky Krai, Pskov Oblast, Tomsk Oblast, Republic of Udmurtia, Yamalo-Nenets Autonomous Okrug. The cluster is characterized by a higher average annual increase in life expectancy, while there is a large variance, that is, changes from year to year compared to the first cluster.
The third cluster includes the following regions: Arkhangelsk Oblast, Republic of Buryatia, Chelyabinsk Oblast, Irkutsk Oblast, Ivanovo Oblast, Republic of Karelia, Kirov
Oblast, Republic of Komi, Kostroma Oblast, Leningrad Oblast, Republic of Mari El, Murmansk Oblast, Penza Oblast, Perm Oblast, Smolensk Oblast, Sverdlovsk Oblast, Tambov Oblast, Tula Oblast, Tver Oblast, Vladimir Oblast, Vologda Oblast, Yaroslavl Oblast, Jewish Autonomous Oblast, Zabaykalsky Krai. This cluster is characterized by approximately the same average annual increase in life expectancy as the second cluster, while there is an even greater variance, that is, changes from year to year compared to the first cluster.
The fourth, fifth, sixth, seventh and eighth clusters each consist of one region. They are outliers (the dynamics of the analyzed indicator in these cluster regions is very different from all other clusters). We will exclude them from further analysis.
Figure 5. Correlation matrix for life expectancy at birth and regressor factors dlog_life_expectancy dlog_life_expectancy_lag1
dlog_mdk_lag1
dlog_popul_doc_lag1
dlog_power_clinics_lag1
dlog_income_real_lag1
dlog_availab_hosp_lag1
dshare_urban_lag1
dlog_grp_real_lag1
dlog_living_space_lag1
dlog_consume_meat_lag1
dlog_doc_midlevel_lag1
1.0 0.2 -0.0 0.0 -0.0 0.3 -0.1 0.0 0.2 -0.1 0.2 0.0
0.2 1.0 0.0 -0.1 0.0 -0.1 -0.1 -0.0 -0.1 -0.1 0.0 0.0
-0.0 0.0 1.0 -0.0 -0.0 0.1 -0.0 0.0 0.0 0.0 -0.3 -0.0
0.0 -0.1 -0.0 1.0 -0.0 -0.0 -0.1 -0.0 -0.1 -0.0 -0.1 -0.3
-0.0 0.0 -0.0 -0.0 1.0 0.0 0.1 0.0 0.0 0.1 -0.0 0.1
0.3 -0.1 0.1 -0.0 0.0 1.0 0.1 -0.0 0.7 0.0 0.2 -0.0
-0.1 -0.1 -0.0 -0.1 0.1 0.1 1.0 0.0 0.1 0.1 -0.0 -0.0
0.0 -0.0 0.0 -0.0 0.0 -0.0 0.0 1.0 -0.0 -0.0 -0.0 0.0
0.2 -0.1 0.0 -0.1 0.0 0.7 0.1 -0.0 1.0 0.0 0.2 -0.0
-0.1 -0.1 0.0 -0.0 0.1 0.0 0.1 -0.0 0.0 1.0 -0.0 0.0
0.2 0.0 -0.3 -0.1 -0.0 0.2 -0.0 -0.0 0.2 -0.0 1.0 -0.0
0.0 0.0 -0.0 -0.3 0.1 -0.0 -0.0 0.0 -0.0 0.0 -0.0 1.0

0.5
-0.5
-1
To select the parameters, we designed a correlation matrix for life expectancy at birth and regressor factors (Fig. 5) .
The correlation coefficients are relatively low, the factors with near-zero correlation coefficients were excluded from further analysis. As a result of the study, we constructed panel vector autoregressions (Sigmun, Ferstl, 2021) for life expectancy at birth: the dependent variable is the change in life expectancy in the first differences of logarithms (dlog_life_expectancy), regressors – change in life expectancy (dlog_life_expectancy_ lag1), change in the population per doctor (dlog_ popul_doc_lag1), change in the capacity of outpatient clinics per 10,000 people (dlog_power_ clinics_lag1), change in the provision of hospital beds per 10,000 people (dlog_availab_hosp_ lag1), change in the real gross regional product per capita (dlog_grp_real_lag1), change in per capita real monetary income (dlog_income_real_ lag1), change in consumption of meat and meat products (including by-products of category II and raw fat) per capita (dlog_consume_meat_lag1). All built models use 11,277 tools. All regressors are represented in the first differences of logarithms, the values are given for the previous year. The study of life expectancy was carried out for each cluster (Tab. 2).
Discussion
Empirical studies of the nature of the influence of factors on LE sometimes show contradictory results at the regional level. Traditionally, an increase in LE is associated with an increase in the level of well-being of the region and its population, as well as with the organization of the healthcare system. We made an attempt to reveal the existing relationships at the regional level on the basis of Rosstat panel data.
At the meso-level, there is a positive LE in all RF constituent entities for the period under consideration, but the growth rates in the regions vary greatly. Clustering RF constituent entities
Table 2. Panel vector autoregressions of the increase in life expectancy in RF constituent entities, 1995–2017
|
Indicator |
Cluster 1 |
Cluster 2 |
Cluster 3 |
|
dlog_life_expectancy_lag1 |
0.3136 *** (0.0284) |
0.1903 *** (0.0550) |
0.3907 *** (0.0214) |
|
dlog_popul_doc_lag1 |
0.0208 ** (0.0073) |
0.0224 * (0.0114) |
0.0061 (0.0138) |
|
dlog_power_clinics_lag1 |
0.0068 (0.0064) |
0.0090 (0.0096) |
0.0033 (0.0123) |
|
dlog_availab_hosp_lag1 |
-0.0221 ** (0.0082) |
-0.0257 * (0.0119) |
-0.0334 * (0.0131) |
|
dlog_grp_real_lag1 |
0.0105 ** (0.0040) |
0.0039 (0.0035) |
0.0102 (0.0053) |
|
dlog_income_real_lag1 |
0.0128 *** (0.0028) |
0.0190 *** (0.0041) |
0.0332 *** (0.0054) |
|
dlog_consume_meat_lag1 |
0.0142 *** (0.0045) |
0.0105 (0.0065) |
0.0111 (0.0081) |
|
Const |
0.0010 *** (0.0003) |
0.0023 *** (0.0005) |
-0.0001 (0.0004) |
|
Number of observations |
600 |
420 |
480 |
|
Number of groups |
32 |
22 |
24 |
|
Observations per group |
20 |
20 |
20 |
|
Number of tools |
11277 |
11277 |
11277 |
|
*** p < 0.001; ** p < 0.01; * p < 0.05. |
|||
according to LE growth rates revealed regional specifics of the formation of LE. The first cluster is characterized by a low average annual increase in life expectancy with the lowest variance, that is, changes from year to year are the least volatile in the first cluster compared to others. The second cluster is characterized by a higher average annual increase in LE and a greater variance compared to the first cluster. The third cluster has an average annual increase in life expectancy similar to the second one and an even greater spread of values.
As a result of further analysis based on autoregression models in the context of the formed clusters, a significant impact with a positive vector was demonstrated by an increase in real per capita income and GRP per capita in the previous year. The impact of changes in average per capita income on the growth of LE manifests itself in different ways. In clusters with a smaller spread of fluctuations in the LE growth rate, the impact of the factor is reduced, compared with clusters in which the spread is significant. This effect can be explained by the growth of income differentiation in the regions, most clearly manifested in the third cluster, when people with greater wealth can afford better medical care and food. A significant factor in the growth of LE in regions of the first cluster is the consumption of animal protein per capita, which is indirectly associated with more stable per capita incomes and the level of regions’ welfare.
GRP per capita had the most significant impact in the first cluster, which includes regions where 59.72% of the population of the Russian Federation lives. These are more attractive territories with positive development dynamics. The positive impact of this factor is due to the availability of infrastructure facilities, including healthcare institutions.
The study revealed the positive impact of the growth of the number of residents per doctor, that is, there are faster rates of population growth compared to the dynamics of the number of doctors.
This can be explained by the intensification of the doctor’s work associated with the standardization of medical services, aimed at providing maximum assistance during one visit, reducing unproductive time spent on repeated visits due to the introduction of lean technologies that are an integral part of the quality management system in medical organizations.
The influence of the factor “provision of hospital beds per 10,000 people” (avail_hosp) on the target variable has a negative sign. This effect demonstrates that the quality of medical services, rather than the number of hospital beds, significantly affects the growth of LE. Provided that comparable healthcare costs are maintained and the number of hospital beds per 10,000 people is reduced, the quality of services and the ability to provide highly qualified and high-tech medical care are improved. Thus, positive results of standardization of medical services are manifested.
It is important to note that the provision of hospital beds per 10,000 people in all clusters showed a negative impact with a simultaneous stable positive effect of the capacity of outpatient clinics per 10,000 people on the dependent variable, which explains the tendency to reduce therapeutic hospital beds in the hospital and increase the volume of outpatient care. Inpatient care provides round-the-clock medical supervision and is provided mainly for severe or emergency diseases. The coverage of inpatient care is several times less than the volume of outpatient care. Medical care provided in a hospital does not imply a mass long stay. All this confirms the importance of strengthening the outpatient link in terms of early disease detection, as well as subsequent timely and effective treatment, which should lead to an increase in life expectancy.
Conclusion
Thus, the results of modeling demonstrate that LE growth is more influenced by inertia – the increase in LE in the previous year. This may mean that the current state of LE in Russia’s regions is the cumulative result of changes in other latent factors, including social well-being, public trust and security, commitment to a healthy lifestyle, etc. The increase in LE in all clusters is influenced by the positive dynamics of regional development and the growth of per capita incomes.
Health factors, having a delayed and cumulative effect on an individual, as a rule, accumulate and manifest themselves in the medium and long term. The vectors of their influence confirm the current trends of healthcare reform associated with the intensification of the work of doctors due to the introduction of a quality management system in medical organizations, including through the standardization of medical services and the use of lean technologies. The social environment also affects the state of public health, including LE: the quality of social relations, lifestyle, social stress, mentality, urbanization; all this also requires additional research.
The results obtained can be useful to government agencies when developing a strategy for managing the quality of life, in particular for improving programs and modeling scenarios for the development of Russian regions. Our conclusions make it possible to better understand the disproportions in the formation of life expectancy in groups of regions of the Russian Federation with similar characteristics of LE. In the future, we will continue studying LE from the position of the impact of gender differences, education and employment, commitment to a healthy lifestyle, environmental factors.
References Life expectancy in Russia's regions
- Abrigo M.R.., Love I. (2016). Estimation of panel vector autoregression in Stata. The Stata Journal: Promoting Communications on Statistics and Stata, 16 (3), 778–804. DOI: 10.1177/1536867x1601600314
- Acemoglu D., Johnson S. (2007). Disease and development: The effect of life expectancy on economic growth. Journal of Political Economy, 115 (6), 925–985. DOI: 10.1086/529000
- Alam M.S., Shahbaz M., Paramati S.R. (2015). The role of financial development and economic misery on life expectancy: Evidence from post financial reforms in India. Social Indicators Research, 128 (2), 481–497. DOI: 10.1007/s11205-015-1040-4
- Anderson T.W., Hsiao C. (1982). Formulation and estimation of dynamic models using panel data. Journal of Econometrics, 18 (1), 47–82. DOI: 10.1016/0304-4076(82)90095-1
- Andreev E.M., Shkol’nikov V.M. (2018). The relationship between mortality and economic development in Russia and its regions. Demograficheskoe obozrenie=Demographic Review, 5(1), 6–24. Available at: https://demreview.hse.ru/article/view/7707/8548 (accessed: September 25, 2021; in Russian).
- Arellano M., Bond S. (1991). Some tests of specification for panel data: Monte Carlo evidence and an application to employment equations. The Review of Economic Studies, 58(2), 277–297. DOI: 10.2307/2297968
- Bergh A., Nilsson T. (2010). Good for living? On the relationship between globalization and life expectancy. World Development, 38 (9), 1191–1203. DOI: 10.1016/j.worlddev.2010.02.020
- Biyase M., Malesa M. (2019). Life expectancy and economic growth: Evidence from the Southern African development community. International Economics, 72(3), 351–366.
- Blundell R., Bond S. Initial conditions and moment restrictions in dynamic panel data models. Journal of Econometrics, 1998, 87(1), 115–143. DOI: 10.1016/s0304-4076(98)00009-8
- Cervellati M., Sunde U. (2011). Disease and development: The role of life expectancy reconsidered. Economics Letters, 113 (3), 269–272. DOI: 10.1016/j.econlet.2011.08.008
- Cervellati M., Sunde U. (2011a). Life expectancy and economic growth: The role of the demographic transition. Journal of Economic Growth, 16 (2), 99–133. DOI: 10.1007/s10887-011-9065-2
- Chistik O.F., Blinova S.V. (2018). The component statistical factor analysis of the expected life expectancy in the implementation of information technology. Vestnik Samarskogo gosudarstvennogo ekonomicheskogo universiteta=Vestnik of Samara State University of Economics, 6(164), 62–69 (in Russian).
- Desbordes R. (2011b). The non-linear effects of life expectancy on economic growth. Economics Letters, 112 (1), 116–118. DOI: 10.1016/j.econlet.2011.03.027
- Edwards R.B. (2016). Mining away the Preston curve. World Development, 78, 22–36. DOI: 10.1016/j.worlddev.2015.10.013
- Gövdeli T. (2019). Life expectancy, direct foreign investments, trade openness and economic growth in E7 countries: Heterogeneous panel analysis. Third Sector Social Economic Review, 54 (2), 731–743. DOI: 10.15659/3.sektor-sosyal-ekonomi.19.05.1130
- Gürler M., Özsoy Ö. (2019). Exploring the relationship between life expectancy at birth and economic growth in 56 developing countries. Journal of Global Health Reports, 3. DOI: 10.29392/joghr.3.e2019001
- Halicioglu F. (2011). Modeling life expectancy in Turkey. Economic Modelling, 28, 2075–2082. DOI: 10.1016/j.econmod.2011.05.002
- Hansen L.P. (1982). Large sample properties of generalized method of moments estimators. Econometrica, 50 (4), 1029–1054. DOI: 10.2307/1912775
- He L., Li N. (2020). The linkages between life expectancy and economic growth: Some new evidence. Empirical Economics, 58, 2381–2402. DOI: 10.1007/s00181-018-1612-7
- Holtz-Eakin D., Newey W., Rosen H.S. (1988). Estimating vector autoregressions with panel data. Econometrica, 56 (6), 1371–1395. DOI: 10.2307/1913103
- Klasen S., Schüler, D. (2011). Reforming the Gender-Related Development Index and the Gender Empowerment Measure: Implementing some specific proposals. Feminist Economics, 17 (1), 1–30. DOI: 10.1080/13545701.2010.541860
- Kolosnitsyna M.G., Kossova T.V., Sheluntsova M.A. (2019). Factors of the life expectancy increase: Country-level cluster analysis. Demograficheskoe obozrenie=Demographic Review, 6(1), 124–150. Available at: https://demreview.hse.ru/article/view/9784/10974 (accessed: September 25, 2021; in Russian).
- Kossova T.V. (2020). Growth factors of life expectancy in modern Russia. Voprosy statistiki, 27(5), 76–86. DOI: 10.34023/2313-6383-2020-27-5-76-86 (in Russian).
- Kossova T.V., Kossova E.V., Sheluntsova M.A. (2017). Estimating the impact of alcohol consumption on mortality and life expectancy in Russian regions Ekonomicheskaya politika, 12(1), 58–83. Available at: https://ecpolicy.ru/oldart/stories/2017_1/kossova.pdf (accessed: September 25, 2021; in Russian).
- Kostromina E.V. (2017). Application of single–circuit demo–economic modeling for forecasting the dynamics of economic growth in the Volga Federal District. Intellekt. Innovatsii. Investitsii, 9, 20–25. Available at: http://intellekt-izdanie.osu.ru/arch/9_2017_postranichno.pdf (accessed: September 25, 2021; in Russian).
- Lavrinenko P.A., Rybakova D.A. (2015). Comparative analysis of regional differences in healthcare, environment, and public health. Ekonomicheskie i sotsial'nye peremeny: fakty, tendentsii, prognoz=Economic and Social Changes: Facts, Trends, Forecast, 5(41), 198–210. DOI: 10.15838/esc/2015.5.41.14 (in Russian).
- Lokosov V.V., Ryumina E.V., Ul'yanov V.V. (2018). Population quality and regional economy: Direct and indirect correlation. Ekonomicheskie i sotsial'nye peremeny: fakty, tendentsii, prognoz=Economic and Social Changes: Facts, Trends, Forecast, 11(1), 32–42. DOI: 10.15838/esc.2018.1.55.2 (in Russian).
- Love I., Zicchino, L. (2006). Financial development and dynamic investment behavior: Evidence from panel VAR. The Quarterly Review of Economics and Finance, 46(2), 190–210. DOI: 10.1016/j.qref.2005.11.007
- Mahyar H. (2016). Economic growth and life expectancy: The case of Iran. Studies in Business and Economics, 11(1). DOI: 10.1515/sbe-2016-0007
- Marmot M. (2005). Social determinants of health inequalities. The Lancet, 365, 1099–1104. DOI: 10.1016/s0140-6736(05)71146-6
- Mau V.A. (2013). Chelovecheskii kapital: vyzovy dlya Rossii [Human Capital: Challenges for Russia]. Moscow: Delo. Available at: https://www.iep.ru/files/RePEc/gai/wpaper/125Mau.pdf (accessed: September 22, 2021).
- Merson M., Black R.E., Mills A. (2006). International Public Health: Diseases, Programs, Systems and Policies. Sudbury, Massachusetts: Jones & Bartlett Learning.
- Morris M.D. (1980). The Physical Quality of Life Index (PQLI). Dev Dig, 18, 95–109.
- Nickell S. (1981). Biases in dynamic models with fixed effects. Econometrica, 49 (6), 1417–1426. DOI: 10.2307/1911408
- Pandey M.D., Nathwani J.S. (1996). Measurement of socio-economic inequality using the Life-Quality Index. Social Indicators Research, 39, 187–202. DOI:10.1007/bf00286973
- Poudyal N.C., Hodges D.G., Bowker J.M., Cordell H.K. (2019). Evaluating natural resource amenities in a human life expectancy production function. Forest Policy and Economics, 11 (4), 253–259. DOI: 10.1016/j.forpol.2009.04.007
- Preston S.H. (1975). The changing relation between mortality and level of economic development. Population Studies, 29 (2), 231–248. DOI: 10.2307/2173509
- Prokhorov B.B. (2011). Russian regions on the way toward the medical-demographic future. Problemy prognozirovaniya=Studies on Russian Economic Development, 1(124), 115–135 (in Russian).
- Romashkina G.F., Skipin D.L., Yukhtanova Y.A., Dolgikh A.I. (2020). Development of human capital in the Arctic regions of Russia. In: IOP Conference Series: Earth and Environmental Science. 539 (1). DOI: 10.1088/1755-1315/539/1/012111
- Shabunova A.A., Kalashnikov K.N., Kalachikova O.N., Korolenko A.V. (2017). Rossiiskoe zdravookhranenie: problemy upravleniya i effektivnost' [Russian Healthcare: Management Issues and Effectiveness]. Vologda: FGBUN VolNTs RAN. Available at: https://znanium.com/catalog/document?id=339276 (accessed: June 20, 2021).
- Shahbaz M., Shafiullah M., Mahalik M.K. (2019). The dynamics of financial development, globalization, economic growth and life expectancy in sub-Saharan Africa. Australian Economic Papers, 58 (4), 444–479. DOI: 10.1111/1467-8454.12163
- Shkol'nikov V.M., Andreev E.M., McKee M., Leon D.A. (2014). Rising life expectancy in Russia of the 2000s. Demograficheskoe obozrenie, 1(2), 5–37. Available at: https://demreview.hse.ru/article/view/1815/2538 (accessed: September 25, 2021; in Russian).
- Sigmund M., Ferstl R. (2021). Panel vector autoregression in R with the package panelvar. The Quarterly Review of Economics and Finance, 80, 693–720. DOI: 10.1016/j.qref.2019.01.001
- Sirag A., Nor N.M., Law S. (2020). Does higher longevity harm economic growth? Panoeconomicus, 67 (1), 51–68. DOI: 10.2298/PAN150816015S
- Stanton E. (2007). The Human Development Index: A History. Available at https://scholarworks.umass.edu/cgi/viewcontent.cgi?article=1101&context=peri_workingpapers
- Wilkins R., Adams O.B. (1983). Health expectancy in Canada, late 1970s: Demographic, regional, and social dimensions. American Journal of Public Health, 73(9), 1073–1080. DOI: 10.2105/ajph.73.9.1073
- Wilson B., Drefahl S., Sasson I., Henery P.M., Uggla C. (2020) Regional trajectories in life expectancy and lifespan variation: Persistent inequality in two Nordic welfare states. Population, Space and Place, 26 (8). DOI: 10.1002/psp.2378
- Zhukova A.K., Silaev A.M., Silaeva M.V. (2016). Spatial analysis of life expectancy in Russian regions. Prostranstvennaya ekonomika=Spatial Economics, 4–5, 112–128. DOI: 10.14530/se.2016.4.112-128 (in Russian).
