Lifelong learning as a condition for human capital formation

Author: Leonidova Galina Valentinovna, Ustinova Kseniya Aleksandrovna
Journal: Economic and Social Changes: Facts, Trends, Forecast @volnc-esc-en
Section: Social development
Article in issue: 6 (24) т.5, 2012.
Free access
The article gives the grounds for lifelong learning as one of the conditions for human capital formation. The parameters that can be a base for evaluating the involvement of the population in the educational process are defined. Professional training of population was studied at the regional level on the basis of opinion polls. The results of the analysis allowed the authors to reveal the conditions that promote and hinder the development of lifelong learning system in the region.
Lifelong learning, condition for formation, human capital, professional training of population
Short address: https://sciup.org/147223402
IDR: 147223402 | UDC: 331.5.024.54
Text of the scientific article Lifelong learning as a condition for human capital formation
One of the first documents that dealt with the problem of lifelong learning was the Resolution of the CC CPSU and USSR Council of Ministers “On the measures to radically improve the quality of training and involvement of specialists with higher education in the national economy” adopted in 1987. It assigned the requirements to ensure lifelong economic education, as well as legal education and environmental training of the population. Afterwards, lifelong learning grew out of education proper and moved to the related field – labour and employment [1, p. 29-31].
This was reflected in the federal target programme “Promotion of employment in the Russian Federation in 1996-1997”, which indicates “the development of lifelong learning system as the most advanced means to assure the quality of labour force” among the key objectives.
The strategic state goal at the present stage of social and economic development is forming an innovation economy that requires a different type of employee with a high level of social, cultural and human capital. The experience of European countries shows, that the sustainable development of such an economic system is possible with reaching the “limiting mass” of employees (up to 35%) corresponding to a new type of economy [9, p. 20-21]. The similar requirement is assigned by law in Russia. In order to improve public policy in accordance with the requirements of innovation economy, it was fixed by the decree of the President of the Russian Federation to increase the share of employed people aged from 25 to 65, who improved their qualification in the total number of working population in this age group, by 37% in 2015 [11].
It should be noted that nowadays Russian labour force on its face is one of the most highly educated in the world: today more than half of workers in the country have tertiary education – higher education (29%) or specialized secondary education (27%) [12, p. 108]. The most important characteristic of lifelong learning is its longevity, which can be estimated through the average schooling and training years.
According to R.J. Barro and J.W. Lee [4, p. 15, 100], there was one of the highest educational levels in Russia in 2010; Russia excelled not only other BRICS countries in the duration of schooling and training period (11 years), but most developed countries (Great Britain – 1.8 years, France – almost a year; tab. 1 ). In 2010, the average schooling and training years in Russia are 3.9 years more than the world average level and 0.7 years more than the level of developed countries.
Comparison of such indicators as the average years of schooling and training and per capita GDP provides a basis to affirm that the countries where the duration of population training has increased by about 2 years over ten years (France, Germany, Czech Republic, Japan, China) demonstrate a significant growth rate of per capita GDP (30% in France, 45% in Germany and the Czech Republic, more than 50% in Brazil, 65% in China).
However, despite the high values of the indicators characterizing the duration of schooling and training, practical implementation of lifelong learning principles is difficult in Russia.
Table 1. Average years of schooling and training (2000, 2005 and 2010)
|
Country |
Average years of schooling and training |
Per capita GDP compared to PPP, thsd. dollars |
|||||||
|
Population aged 15 and over |
Population aged 25 and over |
||||||||
|
2000 |
2005 |
2010 |
2000 |
2005 |
2010 |
2000 * |
2005 |
2010 |
|
|
Developed economies |
|||||||||
|
France |
7.86 |
9.90 |
10.53 |
8.37 |
9.80 |
10.43 |
26.90 |
30.70 |
35.00 |
|
Germany |
10.20 |
11.80 |
11.82 |
9.75 |
12.20 |
12.21 |
26.10 |
31.40 |
37.90 |
|
Japan |
9.47 |
11.30 |
11.58 |
9.72 |
11.10 |
11.48 |
27.30 |
30.30 |
34.30 |
|
Great Britain |
9.42 |
9.30 |
9.75 |
9.35 |
9.00 |
9.42 |
28.50 |
32.20 |
35.90 |
|
USA |
12.05 |
12.90 |
13.10 |
12.25 |
13.20 |
13.27 |
36.70 |
41.90 |
48.10 |
|
Transitional economies |
|||||||||
|
Czech Republic |
9.48 |
12.70 |
12.13 |
9.46 |
13.10 |
12.32 |
17.90 |
20.40 |
25.90 |
|
Hungary |
9.12 |
11.50 |
11.65 |
8.81 |
11.50 |
11.67 |
15.40 |
17.00 |
19.60 |
|
Poland |
9.84 |
9.70 |
9.87 |
9.90 |
9.70 |
9.95 |
11.90 |
13,80 |
20.10 |
|
BRICS economies |
|||||||||
|
Brazil |
4.88 |
7.20 |
7.54 |
4.56 |
6.60 |
7.18 |
7.70 |
8.50 |
11.60 |
|
Russia |
10.03 |
11.30 |
11.52 |
10.49 |
11.60 |
11.73 |
9.10 |
11.90 |
16.70 |
|
India |
5.06 |
4.70 |
5.13 |
4.77 |
4.00 |
4.41 |
2.90 |
2.20 |
3.70 |
|
China |
6.35 |
7.60 |
8.17 |
5.74 |
8.30 |
7.55 |
5.10 |
4.10 |
8.40 |
|
* At the 2000 dollar exchange rate. Sources: Barro R. J., Lee J. W. International Data on Education Attainment: Updates and Implications . Oxford Economic Papers. 2001. Vol. 53. No. 3; World Development Indicators. Washington: World Bank, 2005. |
|||||||||
Theses difficulties are caused by a lack of lifelong learning system (common legal and regulatory framework for educational institutions, the mechanisms of self-regulation and self-organization) [14, p. 129-137], as well as by the reduction in funding of this sector, unequal access of the population to education during the period of life, increase in educational expenses as far as people are involved in the professional activity, decline in the economic returns of education because of aging (a demotivating factor of investing in adult education ) [6, p. 81, 97].
In this regard, the article is aimed at the analysis of opportunities and obstacles in the implementation of lifelong learning in the region and studying the territorial differences according to some educational indicators.
The study is based not only on the data of statistical agencies, but also on European educational policy reviews, and the analysis of lifelong learning development at the regional level is based on the results of opinion polls.
It is necessary to mark out the Global Competitiveness Index (GCI) among the parameters that allow us to carry out this analysis: it consists of the indicators combined into nine pillars1, one of which is “higher education and training” 2 (tab. 2) .
According to the World Economic Forum, in the period from 2005 to 2012, Switzerland and the United States were at the top of the rating by both the Global Competitiveness Index (1st and 5th positions, respectively) and the Higher Education and Training Index (3rd and 13th positions, respectively). The indices of Great Britain are high-repeatable. There were significant positive changes in this sphere in China and Russia during that period (China improved its position by 23 points in the GCI ranking, Russia – by 12 points).
Russia’s medial position in the ranking for both the Global Competitiveness Index and the Higher Education and Training Index proves its ability to generate and use knowledge efficiently, which is strategically important in the transition to an innovation economy.
Denmark, Great Britain and the United States were the leading countries in the effective use of knowledge for economic development in the period from 2000 to 2012. Russia has ranked 55 among more than 140 countries in 2012, which means the improvement of its rating by 9 positions as compared to 2000.
The analysis of integral indicators and their components reveals not only the economic growth potential of the country, but also the degree of the educational system development, the opportunities to improve lifelong learning and use accumulated human capital in practice (tab. 3) .
In terms of Russia’s transition to an innovation economy, there are changes in the production process and increasing requirements for vocational training and educational level of employees in general. On the one hand, it generates the need for lifelong learning to overcome the disparities between the situation in the labour market and education, and, on the other hand, the need to study the theoretical approaches to lifelong learning.
The idea of lifelong learning was formulated for the first time by A. Mansbridge in his report at the World Conference on Adult Education in 1929 in England. Initially, this concept wasn’t interpreted as “retraining” and “continuity” because the education itself was seen as a process of lifelong learning and working [5, p. 18]. Lifelong learning was described as adult education that took into account specific interests of this population group, training technologies and the need for professional
Table 2. Global Competitiveness Index
|
Country |
Global Competitiveness Index (rank) |
Higher education and training (rank) |
||||
|
2005 |
2009 |
2012 * |
2005 |
2009 |
2012 * |
|
|
Switzerland |
5.46 ( 8 ) |
5.60 ( 1 ) |
5.74 ( 1 ) |
n/a |
5.60 ( 6 ) |
5.80 ( 3 ) |
|
USA |
5.81 ( 2 ) |
5.59 ( 2 ) |
5.43 ( 5 ) |
n/a |
5.57 ( 7 ) |
5.57 ( 13 ) |
|
Great Britain |
5.11 ( 13 ) |
5.19 ( 13 ) |
5.39 ( 10 ) |
5.0 ( 6 ) |
5.17 ( 18 ) |
5.47 ( 16 ) |
|
France |
5.39 ( 12 ) |
5.13 ( 16 ) |
5.14 ( 18 ) |
5.30 ( 15 ) |
5.30 ( 15 ) |
5.24 ( 20 ) |
|
China |
4.07 ( 49 ) |
4.74 ( 29 ) |
4.90 ( 26 ) |
5.79 ( 4 ) |
4.09 ( 61 ) |
4.34 ( 58 ) |
|
Brazil |
n/a |
4.23 ( 56 ) |
4.32 ( 53 ) |
5.36 ( 17 ) |
4.14 ( 58 ) |
4.35 ( 57 ) |
|
Russia |
3.53 ( 75 ) |
4.15 ( 63 ) |
4.21 ( 66 ) |
n/a |
4.30 ( 51 ) |
4.54 (52) |
|
Rankings of 2012 GCI. Sources: The Global Competitiveness Report 2010–2011. Р . 15, Р . 20-21; The Global Competitiveness Report 2009–2010. Р . 13, Р . 18-19; The Competitiveness Report 2005–2006; The Competitiveness Report 2011–2012. Р . 16-17, Р . 20-21. |
||||||
Table 3. Knowledge Economy Index
County Knowledge Economy Index1) Knowledge Index2) Education Index3) Rank* 2000 2012 2000 2012 2000 2012 2000 2012 Denmark 9.50 9.16 9.62 9.00 9.65 8.63 3 3 USA 9.32 8.77 9.40 8.89 9.13 8.70 6 12 Great Britain 9.21 8.76 9.26 8.61 9.39 7.27 9 14 Russia 5.41 5.78 6.68 6.96 8.23 6.79 64 55 Rwanda 1.25 1.83 1.37 1.14 0.92 0.77 145 127 * Rankings of 2012 data. 1) The Knowledge Economy Index takes into account whether the environment is conducive for knowledge to be used effectively for economic development. It measures a country’s ability to generate, adopt and diffuse knowledge in the country. The KEI is calculated based on the average of the normalized performance scores of 4 pillars related to the knowledge economy – economic incentive and institutional regime, education and human resources, the innovation system and ICT. They vary from 0 to 10, where 10 corresponds to the highest sophistication of a characteristic. 10% of the top countries achieve the Knowledge Economy Index that accounts for [9-10]; 10% of the worst countries – [0-1]. 2) The Knowledge Index is a component of the Knowledge Economy Index that consists of three pillars – Education Index, Innovation Index, Information and Communication Technology Index. 3) Education Index takes into account such variables as Adult Literacy Rate, Secondary Enrollment, Tertiary Enrollment. It varies from 0 to 10 (10 – the highest sophistication of a characteristic). Source: KEI and KI Indexes. Available at: http://info.
development [5, p. 274-292]. Subsequently, lifelong learning was considered not only as learning activity during adult life, but also as the training and education of a person prior to his/her entry into adult life (children and youth education).
Thus, there was an expansion of the concept content, and it was interpreted in terms of ensuring the sequence and continuation of knowledge acquisition at different stages. This interpretation of lifelong learning corresponds to the paradigm of information-oriented society that can consider any active information search, obtaining and processing as an educational and self-training process [1, p. 17-20].
The approaches to the definition of the concept also changed: it was characterized both as a process (A.I. Kravchenko, A.D. Churaeva) and a system. In addition, some researchers consider lifelong learning as an objective (Parson, 1990), a product (Hatton, 1997), a moral duty (Wain, 1991). However, process and system approaches are the most widespread ones (fig. 1, fig. 2) .
Process approach interprets lifelong learning as a growth of personal educational (general and professional) potential during lifetime, which is supported by government and institutional settings and which meets individual and social needs.
Figure 1. Lifelong learning (process approach)
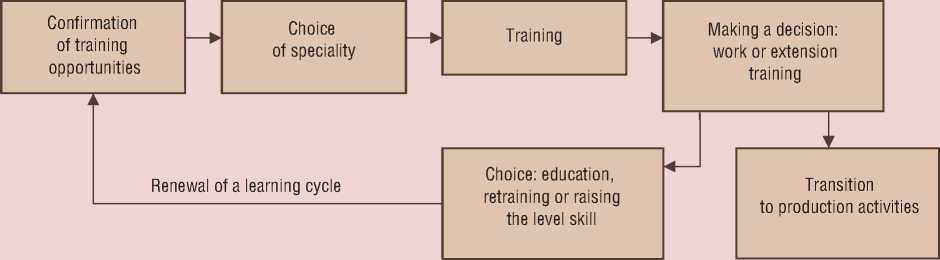
Source: Karpukhina A.E. Monitoring of lifelong learning: management tool and sociological aspects. Moscow: MAKS Press, 2006. P. 125.
Figure 2. Lifelong learning (system approach)
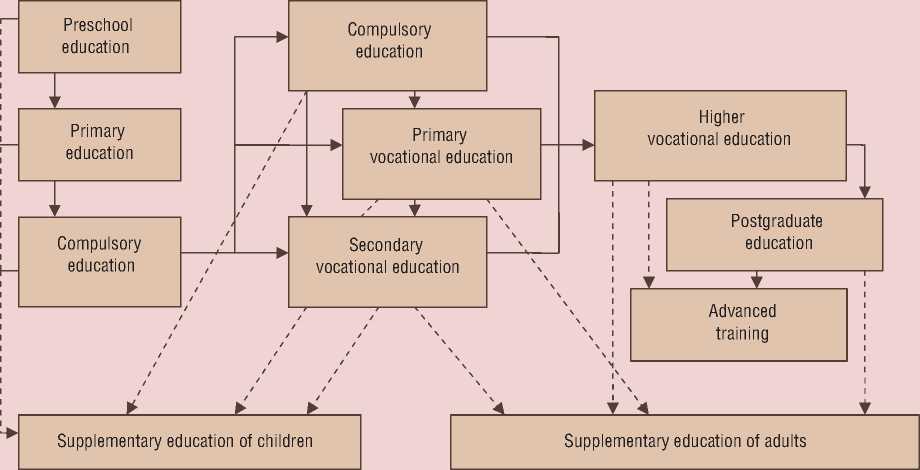
Source: Karpukhina A.E. Monitoring of lifelong learning: management tool and sociological aspects. Moscow: MAKS Press, 2006. P. 44.
According to the system approach, lifelong learning is considered as a principle of organizing educational activities that integrates all its stages and types (preschool, school, vocational education, advanced training and retraining) into an integrated system that provides the ability to update and enhance knowledge and skills over a period of person’s life – from the early childhood to his/her old age.
A.P. Vladislavlev used the system approach to study lifelong learning in his work that was one of the fundamental lifelong learning researches in our country. He emphasized the need for systematic and independent advanced training for all the groups of employees, and he focused on the disclosure of such principles as individuality and system nature [3, p. 8-11]. The theoretical and practical issues of lifelong learning have been developed by such Russian researchers as S.Yu. Alferov, A.P. Belyayeva, A.A. Verbitskiy, L.A. Volovich, B.S. Gershunskiy, G.L. Ilyin, M.V. Clarin, M.I. Makhmutov, A.M. Novikova and others [10, p. 17-22].
Thus, it is possible to point out the following characteristics of lifelong learning: long-term nature (over a life period), ensuring the growth of personal intellectual potential (through the development of skills and abilities), providing flexibility in person’s activity due to taking into account individual interests, as well as the changes in market labour.
The share of people who take part in the programmes of formal and informal education is a key parameter characterizing the involve-ment of population in the educational process. According to the Organization for Economic Cooperation and Development, 40% of adults from the member-countries participated in those programmes on average in 2011 and 27% of adults looked for the information on various training programmes [18].
The cross-country analysis of population’s involvement into lifelong learning system allowed us to reveal the leading countries (Austria, Slovenia, Luxembourg, Denmark, Finland, Sweden) where 70-80% of the population are involved in lifelong learning; the countries that are in-between position (France, Ireland, Italy, Latvia, Portugal, Belgium, Germany), where the level of public involvement in lifelong learning is comparable to the average for the OECD countries; the countries that have the low population’s involvement into lifelong learning. The latter group includes some of the European countries and Russia (fig. 3) .
Self-education is one of the parameters that can be used as a base for the assessment of population’s involvement into lifelong learning (fig. 4) .
According to this indicator, Russia is inferior to leading European countries: only a quarter of the Russians aged 25-64 are engaged in self- education, while, for example, 80% of the population in Slovakia and more than 70% of people in Sweden, Austria, Norway are involved in self-education.
Figure 3. Involvement of Russia and European countries in lifelong learning in 2010 (% of the respondents aged 25-64)
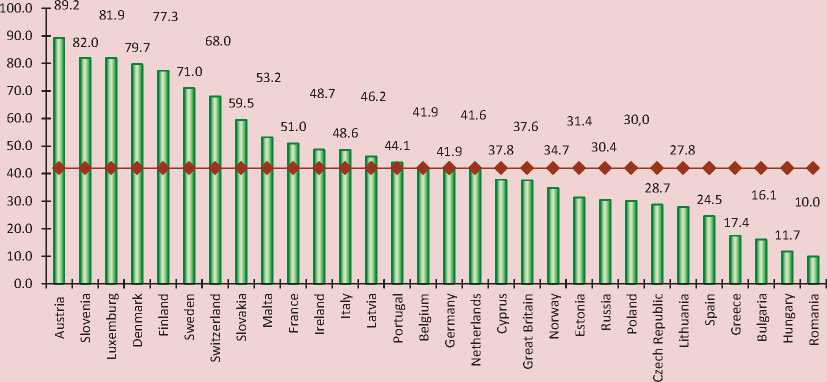
Source: Indicators of Education. 2011: Stat. Coll. Moscow: Higher School of Economics, 2011. P. 33.
Figure 4.Involvement of Russia and European countries in self-education in 2010 (% of the respondents aged 25-64)
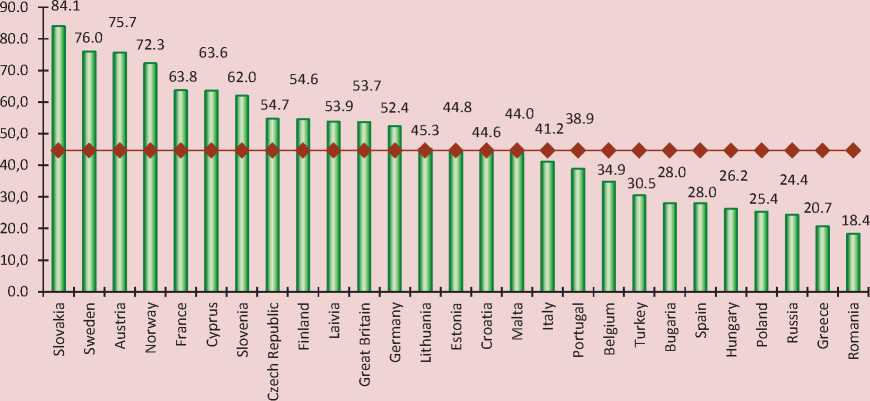
Source: Indicators of Education. 2011: Stat. Coll. Moscow: Higher School of Economics, 2011. P. 37.
As for training and retraining, the polls provide the information about these processes in Russia at the state and regional levels. Thus, the monitoring of labour potential quality in the Vologda Oblast revealed that half of employed people do not work within their specialty obtained in the vocational educational institutions (48% in 2004, 43% in 2012, fig. 5 ).
The degrees of qualification conformity to job requirements is a parameter which characterizes, on the one hand, the disparities in labour market and education, and, on the other hand, the level of training of employees.
In 2000, the qualification of half of respondents met their job requirements in full; and that parameter did not change throughout the study period. It is possible to note a 2-fold reduction in the share of people who have their qualifications below their job requirements among the positive trends (fig. 6) .
It is possible to assess lifelong learning involvement on the base of respondents’ answers to the question if they are going to train or retrain.
As a result of public opinion monitoring in the Vologda Oblast3, the following territorial differences have been revealed: urban population is involved in the process of training more actively as compared with rural population (the share of urban people who attend training courses is more than two times higher than the figures for the districts).
At the same time, the people in the districts are interested in increasing their educational level less than those in Vologda and Cherepovets in the long term (there are more people (by 10%) who do not plan to improve their qualifications in the districts, than in the cities; tab. 4 ) .
Figure 5. The people in the Vologda Oblast who work or do not work within their specialty obtained in the vocational educational institutions (% of the number of respondents)
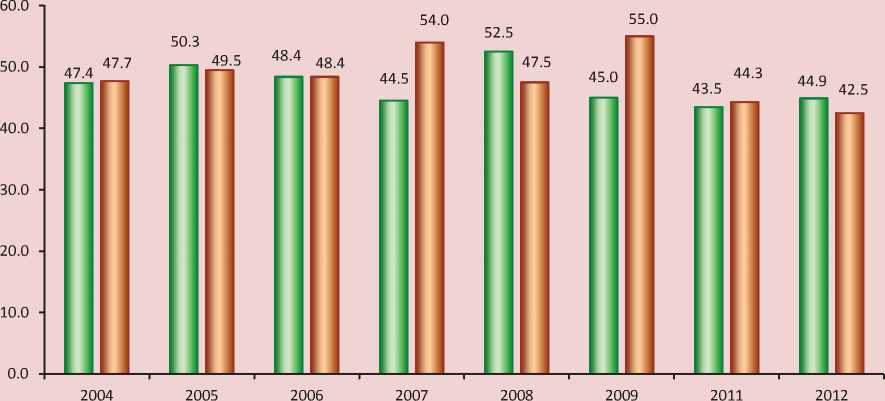
□ Worked within their specialty obtained in the vocational educational institutions
□ Did not work within their specialty obtained in the vocational educational institutions
60.0
Figure 6. Distribution of the Vologda Oblast’s population according to the degrees of qualification conformity to job requirements, (% of the number of respondents)*
50.8
50.4
49.9
10.0
0.0
50.0
40.0
30.0
20.0
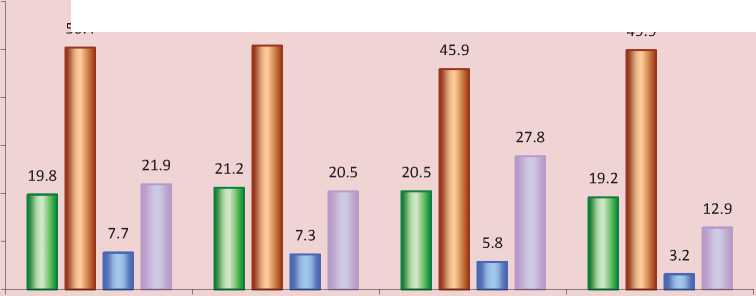
□ My qualification is higher than my job requires
□ My qualification meets the requirements of my job
□ My qualification is lower than my job requires
□ I don’t know, it’s difficult to answer
* According to the data of ISEDT RAS monitoring of labour potential quality in the Vologda Oblast
The possible causes of such a situation at the municipal level are a lack of money to pay for training courses and a shortage of tech- nological changes in the industry. However, these hypotheses require the further researches in order to prove or disprove them.
Table 4. Distribution of the answers to the question: “Do you plan to attend training or retraining courses?” (% of the number of respondents)
|
Responses |
Vologda |
Cherepovets |
Districts |
Vologda Oblast |
|
Attended during last 6 months |
8.2 |
16.4 |
3.4 |
7.9 |
|
Plan to attend in the nearest 6 months |
11.3 |
9.6 |
4.3 |
7.3 |
|
Did not attend |
12.7 |
11.4 |
10.3 |
11.1 |
|
Do not plan |
31.0 |
30.6 |
42.0 |
36.5 |
|
It is difficult to answer |
36.9 |
31.9 |
40.0 |
37.2 |
|
Source: Hereinafter – data of public opinion monitoring in the Vologda Oblast, 2011, ISEDT RAS. |
||||
The time period of training is one of the parameters characterizing indirectly the interest of the population in professional development and lifelong learning. About a third of all the respondents have never improved their professional level throughout their career (tab. 5) .
However, about 30% of the respondents from Vologda and Cherepovets improved their professional level 1 or 3 years ago, while the share of people from the districts, who were involved in retraining, was two times lower. This demonstrates the regional differences according to this parameter.
Despite the lower level of population’s activity in improving their professional skills, there is a positive trend: more than half of the respondents in Vologda and Cherepovets, as well as 60% of the respondents in the districts are ready to attend training courses on their own initiative (tab. 6) .
Employers stimulate the training motivation of their employees using qualifying evaluation and providing the employees with the opportunity for career growth and increasing rewards for their work. Despite the fact that employers try to awake their employees’ interest in training (32% in the oblast), about half of the respondents in Vologda and Cherepovets, as well as more than 70% of the respondents in the districts have mentioned the opposite.
According to the poll, the most “efficient” form of motivation of employees is a qualifying evaluation, the second important form is a career growth, and increasing rewards for employees’ work rounds out the top three (in urban areas of the oblast – 20 – 30%, 9 – 16% and 7 – 14%, respectively, tab . 7).
According to the poll, training courses are organized for a third of city respondents and for 20% of the respondents from the districts of the Vologda Oblast (tab. 8) . Such forms of retraining as advanced experience academy and on-the-job training in other organizations are used rarely.
It should be emphasized that their use contributes to the raise in labour productivity and wages, climbing up the career ladder and personal enhancement (tab. 9) .
In the opinion of the respondents, the most significant results of training include: personal enhancement and career growth (30 and 18%, respectively). According to the latter indicator, we have identified the factors that impede the achievement of high professional degree. Approximately a third of respondents believe that these barriers are absent (tab. 10) . However, according to many respondents, the factors hampering the professional development include a lack of free time and funds, as well as a lack of employer’s initiative and retraining courses.
Despite the fact that lifelong learning of an employee is accompanied with achieving the objectives of personal enhancement and raise in wages, 60 – 70% of people aren’t going to improve their education in future (obtain a higher education, enroll in Master’s degree programme, study for their Ph.D.); about 20% of respondents have not found their positions yet (tab. 11) .
Table 5. Distribution of the answers to the question: “When did you improve your qualification?” (% of the number of respondents)
|
Responses |
Vologda |
Cherepovets |
Districts |
Vologda Oblast |
|
Under one year ago |
14.4 |
20.0 |
8.3 |
12.7 |
|
3 years ago |
13.0 |
11.7 |
6.3 |
9.3 |
|
5 years ago |
6.8 |
10.1 |
2.8 |
5.6 |
|
Did not improve |
27.6 |
27.5 |
31.8 |
29.7 |
|
It is difficult to answer |
38.3 |
30.6 |
50.8 |
42.7 |
|
Source: Data of public opinion monitoring in the Vologda Oblast, 2011, ISEDT RAS. |
||||
Table 6. Distribution of the answers to the question: “Whose initiative makes you improve your qualifications?” (% of the number of respondents)
|
Responses |
Vologda |
Cherepovets |
Districts |
Vologda Oblast |
|
Employer’s initiative |
38.0 |
32.9 |
28.4 |
32.2 |
|
Own initiative |
56.0 |
46.0 |
65.0 |
56.6 |
|
Employment services’ initiative |
1.6 |
9.9 |
3.6 |
5.2 |
|
Source: Data of public opinion monitoring in the Vologda Oblast, 2011, ISEDT RAS. |
||||
Table 7. Distribution of the answers to the question: “What forms of motivation for further training does your employer use?” (% of the number of respondents)
|
Responses |
Vologda |
Cherepovets |
Districts |
Vologda Oblast |
|
Employees’ needs analysis |
7.9 |
2.6 |
2.1 |
3.6 |
|
Qualifying evaluation of employees |
31.6 |
20.1 |
17.1 |
21.3 |
|
Money reward (bonus) |
7.2 |
14.7 |
6.5 |
8.8 |
|
Raise in wage |
5.9 |
20.1 |
3.6 |
8.5 |
|
Career growth |
8.9 |
16.1 |
3.0 |
7.9 |
|
Other |
1.0 |
5.5 |
0.5 |
1.9 |
|
It is difficult to answer |
51.3 |
43.7 |
71.8 |
59.6 |
|
Source: Data of public opinion monitoring in the Vologda Oblast, 2011, ISEDT RAS. |
||||
Table 8. Distribution of the answers to the question: “Does your company organize training and retraining courses for the employees?” (% of the number of respondents)
|
Responses |
Vologda |
Cherepovets |
Districts |
Vologda Oblast |
|
Training and retraining courses |
35.5 |
34.9 |
18.7 |
26.9 |
|
Advanced experience academy |
3.8 |
3.2 |
0.8 |
2.1 |
|
Training centres, corporate universities |
3.1 |
9.8 |
0.3 |
3.4 |
|
On-the-job training in other organizations |
2.4 |
3.2 |
2.1 |
2.5 |
|
Conclusion of contracts with educational institutions for training (retraining) of specialists |
5.8 |
9.2 |
2.3 |
4.9 |
|
Does nor organize |
48.8 |
46.7 |
73.2 |
60.5 |
|
Other |
5.1 |
5.1 |
3.7 |
4.4 |
|
Source: Data of public opinion monitoring in the Vologda Oblast, 2011, ISEDT RAS. |
||||
Table 9. Distribution of the answers to the question: “What does further training give for your professional advancement?” (% of the number of respondents)
|
Responses |
Vologda |
Cherepovets |
Districts |
Vologda Oblast |
|
Career growth |
17.2 |
17.7 |
8.3 |
12.8 |
|
Raise in wage |
12.7 |
20.8 |
8.6 |
12.7 |
|
Rise in labor productivity |
8.2 |
11.7 |
5.3 |
7.6 |
|
Personal enhancement |
31.8 |
26.5 |
13.3 |
21.1 |
|
Gives nothing |
14.9 |
15.1 |
16.2 |
15.6 |
|
Other |
0.0 |
1.6 |
0.1 |
0.5 |
|
It is difficult to answer |
22.5 |
24.9 |
45.0 |
34.5 |
|
Source: Data of public opinion monitoring in the Vologda Oblast, 2011, ISEDT RAS. |
||||
Table 10. Distribution of the answers to the question: “What impedes your professional advancement?” (% of the number of respondents)
|
Responses |
Vologda |
Cherepovets |
Districts |
Vologda Oblast |
|
Lack of courses that meet your needs |
7.0 |
3.1 |
2.8 |
3.9 |
|
Lack of self-initiative |
1.4 |
3.6 |
1.8 |
2.2 |
|
Lack of employer’s initiative |
11.0 |
6.5 |
4.3 |
6.5 |
|
Lack of opportunities for advanced training on the job |
8.2 |
6.2 |
4.7 |
5.9 |
|
Lack of funds |
14.4 |
11.4 |
13.4 |
13.1 |
|
Lack of free time |
18.9 |
10.9 |
3.3 |
8.9 |
|
Other |
0.8 |
2.9 |
0.3 |
1.1 |
|
Nothing |
24.8 |
30.1 |
23.6 |
25.5 |
|
It is difficult to answer |
26.5 |
24.4 |
40.7 |
33.1 |
|
Source: Data of public opinion monitoring in the Vologda Oblast, 2011, ISEDT RAS. |
||||
Table 11. Distribution of the answers to the question: “Are you planning to...?” (% of the number of respondents)*
|
Responses |
Vologda |
Cherepovets |
Districts |
Vologda Oblast |
|
To obtain a higher education (second higher education) |
||||
|
Yes |
15.7 |
20.7 |
9.9 |
14.1 |
|
No |
67.0 |
64.2 |
73.8 |
69.7 |
|
To enroll in Master’s degree programme |
||||
|
Yes |
1.5 |
3.1 |
0.0 |
1.2 |
|
No |
86.5 |
87.2 |
84.8 |
85.8 |
|
To study for your Ph.D. |
||||
|
Yes |
2.2 |
3.7 |
0.2 |
1.6 |
|
No |
84.1 |
84.4 |
85.4 |
84.9 |
|
Get more any additional education, attend training courses |
||||
|
Yes |
26.3 |
27.2 |
11.5 |
19.1 |
|
No |
45.7 |
45.9 |
64.3 |
55.2 |
|
* Excluding respondents who are at a loss to answer. Source: Data of public opinion monitoring in the Vologda Oblast, 2011, ISEDT RAS. |
||||
Thus, the analysis allowed us to reveal the major factors impeding advanced training and lifelong learning of the population:
– a high share of people who do not attend and do not plan to attend training courses;
– a lack of plans of people to raise their educational level in the future;
– a lack of employers’ active stand on the organization of training courses for their employees;;
– a lack of training results;
– the barriers that impede the career development (a lack of funds and free time).
The following parameters of territorial differentiation in population’s training have been identified:
– degree of work conformity to the qualification (the share of people who have their qualification higher than the requirements of their jobs is two times more in the cities, which creates the potential not only for the functioning of organizations, but also for their development, including on the basis of innovation);
– plans of people to improve their qualification in the near future (there are three
times more people who attended or plan to attend training courses in the cities as compared with the districts);
– the party that initiates training (the share of people who improve their qualification on administration’s initiative is more by 10% in the cities than in the districts; at the same time, the share of people who improve their qualification on self-initiative is more by 10% in the districts than in the cities);
– training results (people in the cities focus on such training results as personal enhancement, career growth, raise in wages; however, the share of people who get nothing due to their training is higher in the districts).
Thus, it is necessary for enterprises to identify the periodicity of training courses for their employees, it is important for them to create motivational mechanisms for raising the interests of people to improve their professional level and increase investment in education.
Regional governments should provide incentives for employers to increase their activities in the organization of training and retraining courses.
References Lifelong learning as a condition for human capital formation
- Belyakov S.A., Vakhshtain V.S., Galichin V.A. Monitoring of lifelong learning: management tool and sociological aspects. Moscow: MAKS Press, 2007.
- Ilyin V.A., Smirnova N.A., Timofeyeva Ya.B. The quality of the labour potential in the Vologda Oblast. Vologda: VSCC CEMI RAS, 1998.
- Indicators of Education. 2011: Stat. Coll. Moscow: Higher School of Economics, 2011.
- Kapelyushnikov R.I., Lukyanova A.L. Human capital transformation in the Russian society (on the base of the The Russia Longitudinal Monitoring Survey). Moscow: Liberal Mission, 2010.
- Klyucharev G.A. Lifelong learning in the political and economic contexts. Moscow: IP RAS, 2008.
- Towards Knowledge Societies: The UNESCO World Report. Paris: UNESCO, 2005.
- Leonidova G.V. Generation of talented youth's knowledge in for the benefit of intellectualization of human capital: methods and forms of implementation. Economic and social changes: facts, trends, forecast. 2011. No. 1 (13). P. 90-100.
- Babich L.V., Leonidova G.V. Private public partnership in education: a model of human capital management. Economic and social changes: facts, trends, forecast. 2012. No. 1 (19). P. 39-50.
- Moskvich Yu.N. Lifelong learning for the new Russia. Innovations in Education. 2010. No. 1. P. 20-23.
- Navazova T.G. Methodology of lifelong training. Man and education. 2005. No. 3. P. 17-22.
- On the measures to implement the state policy in education and science: Presidential decree No. 599 as of May 7, 2012//Rossiyskaya Gazeta. Federal Issue No. 5775.
- Regions of Russia. Socio-economic indicators. 2011. Sat. Coll. Moscow: Rosstat, 2011.
- Ilyin V.A., Gulin K.A., Leonidova G.V., Davydova V.V. Labour potential of the region: status and development. Vologda: VSCC CEMI RAS, 2004.
- Fedorkov A.I. The current state and developmental prospects of lifelong learning system in Russia. St.Petersburg: SPGIEU, 2010.
- Shabunova A.A., Leonidova G.V. Human capital as an indicator of sustainable development of the territory. Economic and social changes: facts, trends, forecast. 2011. No. 5 (17). P. 101-115.
- Barro R.J., Lee J.W. International Data on Education Attainment: Updates and Implications. Oxford Economic Papers. 2001. Vol. 53. No. 3. Р. 541-563.
- Barro R.J., Lee J.W. A new data set of educational attainment in the world, 1950 -2010: working paper 15902. Cambridge, 2010.
- Education at a Glance 2011 OECD Indicators: factbook. Centre for Educational Research and Innovation, 2011.
