Machine learning based business forecasting

Author: D. Asir Antony Gnana Singh, E. Jebamalar Leavline, S. Muthukrishnan, R. Yuvaraj
Journal: International Journal of Information Engineering and Electronic Business @ijieeb
Article in issue: 6 vol.10, 2018.
Free access
The business sectors directly contribute to the growth of any nation. Moreover, the business is an activity of producing, buying, and selling the goods and services to generate the money. The business directly involves in the gross domestic product (GDP). The business forecasting is the activity of predicting or estimating the feature position of the sales, expenditures, and profits of any business. However, the business forecasting helps to the business sectors for planning, decision making, resource utilization, business success, etc. Therefore, business forecasting is a pressing need for the growth of any business. In recent past, many researches attempt to carry out the business forecasting using different tools. However, this paper presents the business forecasting for sales data using machine learning technique and the obtained results are presented and discussed..
Business Forecasting, Machine Learning, Gaussian Process, SMOreg, Multilayer Perceptron
Short address: https://sciup.org/15016155
IDR: 15016155 | DOI: 10.5815/ijieeb.2018.06.05
Text of the scientific article Machine learning based business forecasting
Published Online November 2018 in MECS DOI: 10.5815/ijieeb.2018.06.05
The development of any nation can be assessed based on the productivity of the goods and services. The goods and services may lead to change the lifestyle and provide the quality of life to the humankinds. The business sectors directly contribute to the growth of any nation. Moreover, the business is an activity of producing, buying, and selling the goods and services to generate the money. The business directly involves in the gross domestic product (GDP). The business forecasting is the activity of predicting or estimating the feature position of the sales, expenditures, and profits of any business. However, the business forecasting helps to the business sectors for planning, decision making, resource utilization, business success, etc.
However, the business forecasting assist to the business planning for identifying, determining, arranging and ordering the requirements that are needed to achieve the goal of the business. The outcome of the business forecasting is used for managerial decision making. The business forecasting also adopted fore estimation the financial need. The outcome of business forecasting can direct to start the new business. The business forecasting is used for quality management for improving the quality of the organization or business sector. The business forecasting helps to utilize the resources in an effective manner. Moreover, the business forecasting motivates to bring the success in the business.
The machine learning is an activity of enable the computer machine to learn from the data to make data driven decisions. The machine learning algorithm is employed to learn the data to build the decision model. Then, the decision models are used to make decision. In recent past, many researches attempt to carry out the business forecasting using different tools. However, this paper presents the business forecasting for sales data using machine learning-based forecasting algorithms such as Gaussian process, linear regression, multilayer perceptron, and SMOreg. Moreover, the performance of these algorithms are analysed in terms of mean absolute error, root mean squared error.
-
II. Related Works
This section reviews the related research works that are carry out by many researchers. The forecasting is carried out using the different forecasting model. The forecasting models are developed using the any one of the statistical and machine learning algorithms with historical time series data. The forecasting model is employed for various applications such as sales and economy forecasting in business, weather forecasting in the meteorological, electrical energy and power consumption in power generation sector, etc. The sales forecasting place an important role in business to understand the feature demand that aides to make the managerial plans and data driven decisions. In general, the forecasting model is developed using the historical sales data. XiaodanYua presented a presented a sales furcating for magazine and newspaper using the support vector regression [1]. YutaKanekoa, et al presented a dynamic Bayesian model for identifying the relationship between the movement of in-store customer and sales [2]. D. Asir et al presented a forecasting model to forecast the sales data. This model is constructed with the regression model and historical sales data in order to forecast sales for the feature [3].
F.L. Chen, presented a machine learning model for sales forecasting. Moreover, for the methodology, gray relation analysis (GRA), normalization and unnormalization, and extreme learning machine (ELM) to forecast the sales [4]. Tsan-Ming Choih et al presented a fast fashion sales forecasting with less time and data. In order to forecast the sales data, an intelligent forecasting algorithm is developed with combining the grey model and the extreme learning machine. The proposed system can perform better for demand trend slope is large and the large variance in seasonal cycles [5]. Chi-Jie Lu et al presented a sales forecasting model to forecast the sales details of computer product such as display card, hard disk, main board, liquid crystal display and notebook. In order to construction the forecasting model, the variable section method is used to identify the significant predictor variable and the support vector regression (SVR) is used [6]. Moreover, the researchers employed the forecasting model to forecast the economy. Thus, Todd E. Clark et al presented a forecasting model for microeconomic forecasting and their performance is evaluated under alternative specifications of time-varying volatility. This model is constructed with vector autoregressive and Bayesian autoregressive models with the time-varying volatility [7].
In some cases, the online search data and review data are employed to develop the product sales forecasting model. Moreover, Gauri Kulkarni et al presented a forecasting method for product sales using the online search data. The product sales are forecasted with the online search data during the pre-launch of product and the online search data during post-launch of product. Moreover, the sales forecasting is observed with the advertisement effect [8]. Furthermore, Zhi-Ping Fan et al presented to forecast the product sales from the online reviews and historical sales data. Moreover, this approach uses the sentiment analysis and Bass model for the forecasting [9]. Yair Orbach presented a forecasting model for sales and product evaluation for the hybrid car market [10]. Matthew J. Schneider et al presented a sales forecasting method for the existing and new products. The forecasting model is constructed using the consumer reviews [11]. The meteorological forecasting assists to make managerial decision and planning for saving the men and materials form the aggressive natural calamities. Petros Karvelis presented the single and two ensemble models are presented to forecasting the wind speed Moreover, they presented the forecasting approaches of multiple linear regression, gradient boosted trees, and random forests [12].
However, the in economy the electricity is the commodity that operates the various electrical equipment and machineries in industry and residence for improving the quality of human life. Hence, the demand and supply of the electricity is to be considered always to avoid the scarcity of the electric power and wastages of execs power. Such a way that Hao Quan et al presented neural network-based short-term load and wind power forecasting. In this approach, the neural network is used to construct the prediction interval. Moreover, lower upper bound estimation (LUBE) is formulated for developing the predication interval with neural network and the particle swarm optimization (PSO) is employed for get the optimal solution [13]. A.S. Ahmad et al conducted a survey for construction of forecasting moles for consumption of electrical energy using the artificial neural networks and support vector machine [14]. J. Antonanzas et al presented an review on the forecasting models that are used to forecast the photovoltaic power [15].
Moreover, Tao Honga et al conducted a review on probabilistic electric load forecasting. Moreover, the review is extended with the forecasting models such as multiple linear regression models, semi-parametric additive models, exponential smoothing models, autoregressive moving average models, artificial neural networks, fuzzy regression models, support vector machine, and gradient boosting [16]. Rishee K. Jain et al presented a forecasting model for forecasting the energy consumption for the residential building using support vector machine. The performance of the presented model is evaluated and their results are illustrated and inferred [17].
However, the researches employed the forecasting models for forecasting the downstream flow in river. X. Y. Chen presented a comparative study on the three optimization algorithms such as ant colony optimization (ACO), artificial bee colony (ABC), and differential evolution (DE) to forecast the flow of downstream river. Moreover, this study observed that the DE and the ACO is comparably better to optimize the forecasting problems with hybrid neural network [18]. From the literature, it is observed that the forecasting models are used for various applications and different techniques are used to develop the forecasting model. However, this paper presents a machine learning based forecasting models for business forecasting.
-
III. Machine Learning Based Business Forecasting
This section presents the machine learning based business forecasting. Initially the forecasting model is developed using the forecasting algorithm with training dataset as shown in Figure 1. Then, the forecasting model is used to forecast for the given data for a period as shown in Figure 2. The developed forecasting model is evaluated using the training dataset in terms of MAE and RMSE as shown in Figure 3.
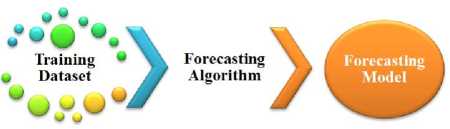
Fig.1. Forecasting model generation
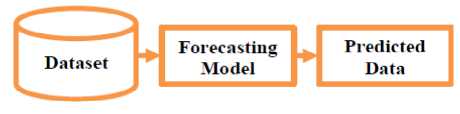
Fig.2. Predicting the feature data using the forecasting model
However, this paper presents the machine learning based business forecasting using Gaission process, linear regression, multilayer perceptron, and SMOreg. Furthermore, the performance of these models is evaluated in terms of mean absolute error (MAE) and root means square error (RMSE) using the bench mark sales dataset.
-
IV. Experimental Setup and Procedure
The experiment is conducted using the WEKA software [19]. The Table 1 shows the details of the datasets. The airline dataset consists of 141 instances and two attributes namely passenger_numbers and date. The attribute passenger_numbers represents the monthly total number of international airline passenger in thousands during the years 1949-1960. The attribute date represents the year, month, and date for the booked seats. The wine dataset consists of 187 instances and 7 attributes namely fortified, dry-white, sweet-white, red, rose, sparkling and date. The fortified, dry-white, sweet-white, red, rose, and sparkling are the name of Australian wines and these attributes represent the sales of the each wine in thousands of litters with respect to the date attribute in year, month, and date.
Table 1. Details of Dataset
|
Dataset name |
Number of instances |
Number of attributes |
|
Airline |
114 |
2 |
|
Wine |
187 |
7 |
Initially, the training and test datasets are prepared from the original dataset as shown in Figure 3. For the presented method, the entire original dataset is taken for training dataset and the same training dataset is taken for test dataset. In order to build the forecasting model, the forecasting algorithms namely Gaussian process, linear regression, multilayer perceptron, and SMOregt are used.
Initially, the training dataset is given to the each algorithm and the forecasting model is developed then the test dataset is given to the forecasting model to evaluate the model as shown in Figure 3. The forecasting model is evaluated in terms of mean absolute error (MAE) and root mean squared error (RMSE) as expressed in the Equation (1) and (2).
Root means square error (RMSE) =
(У Ё -У е )2
п
Mean absolute error (MAE) = 2 "=1 ly t Уё| (2)
where the у is the predicated value y £ is the actual value n represents the total number of sample that have been predicted t represents the time or date.
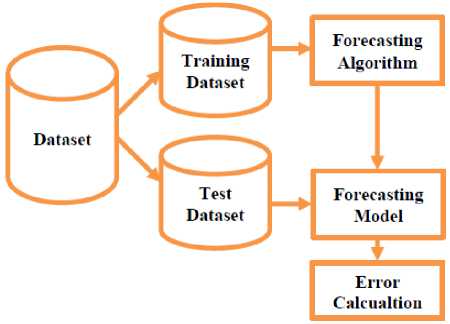
Fig.3. Forecasting model evaluation
-
V. Results and Discussion
This section presents the results that are obtained from the experiments and discusses them. The Figure 4, Figure 5, Figure 6, and Figure 7 show the actual and predicted total number of international airline passengers in thousands for10 steps ahead on airline dataset with Gaussian process, linear regression, multilayer perceptron, and SMOregt, respectively.
Table 2, Table 3, Table 4, and Table 5 show the Mean absolute error, root mean squared error for predicted total number of international airline passengers in thousands for10 steps on airline dataset of Gaussian process, linear regression, multilayer perceptron, and SMOregt, respectively. Figure 8 shows the mean absolute error of Gaussian process, linear regression, multilayer perceptron, and SMOreg with respect to the predicted total number of international airline passengers in thousands for10 steps on airline dataset. Figure 9 shows the root mean squared error of Gaussian process, linear regression, multilayer perceptron, and SMOreg with respect to the predicted total number of international airline passengers in thousands for10 steps on airline dataset.
From the Table 4 to Table 7 and Figure 8 and Figure 9, it is evident that the overall performance of the SMOreg is better on the airline dataset compared to the other forecasting algorithms that employed for performance evaluation in terms of mean absolute error and root mean squared error. However, for very less number of steps the forecasting algorithms performs better in terms of mean absolute error and root mean squared error. Moreover, the linear regression and the multilayer fails to perform better when the number of steps more. Furthermore, the
Gaussian process perfume better even the number of steps are more compared to the linear regression and the multilayer perceptron.
The Table 6 to Table 8 and Figure 14 to Figure 16 show the mean absolute error of Gaussian process, linear regression, multilayer perceptron, and SMOreg for sales of the fortified, dry-white, and sweet-white, respectively, in thousands of litters for 10 steps on wine dataset.
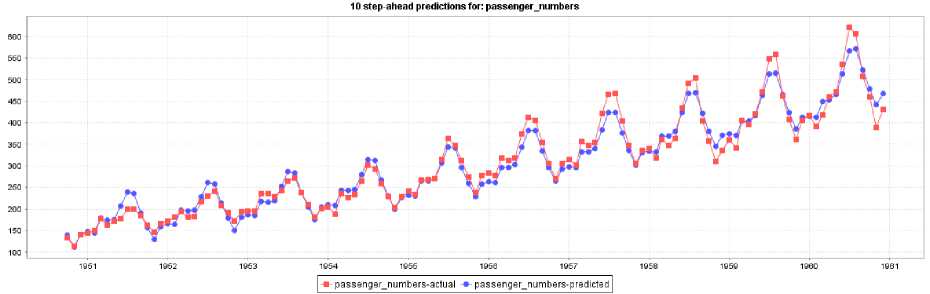
Fig.4. Actual and predicted total number of international airline passengers in thousands for10 steps ahead with Gaussian process on airline dataset
Table 2. Mean absolute error, root mean squared error of Gaussian process for predicted total number of international airline passengers in thousands for10 steps on airline dataset.
|
Gaussian process |
1-step-ahead |
2-steps-ahead |
3-steps-ahead |
4-steps-ahead |
5-steps-ahead |
6-steps-ahead |
7-steps-ahead |
8-steps-ahead |
9-steps-ahead |
10-steps-ahead |
|
Mean absolute error |
13.84 |
15.85 |
16.68 |
16.77 |
16.65 |
16.48 |
16.27 |
15.94 |
15.65 |
15.52 |
|
Root mean squared error |
17.46 |
19.88 |
20.86 |
21.00 |
20.89 |
20.71 |
20.44 |
19.96 |
19.54 |
19.48 |
Table 3. Mean absolute error, root mean squared error of linear regression for predicted total number of international airline passengers in thousands for10 steps on airline dataset.
|
linear regression |
1-step-ahead |
2-steps-ahead |
3-steps-ahead |
4-steps-ahead |
5-steps-ahead |
6-steps-ahead |
7-steps-ahead |
8-steps-ahead |
9-steps-ahead |
10-steps-ahead |
|
Mean absolute error |
8.39 |
10.02 |
11.80 |
13.13 |
13.98 |
15.39 |
16.23 |
16.57 |
16.64 |
16.50 |
|
Root mean squared error |
10.63 |
12.75 |
15.42 |
17.18 |
18.18 |
19.65 |
20.74 |
21.61 |
22.53 |
23.20 |
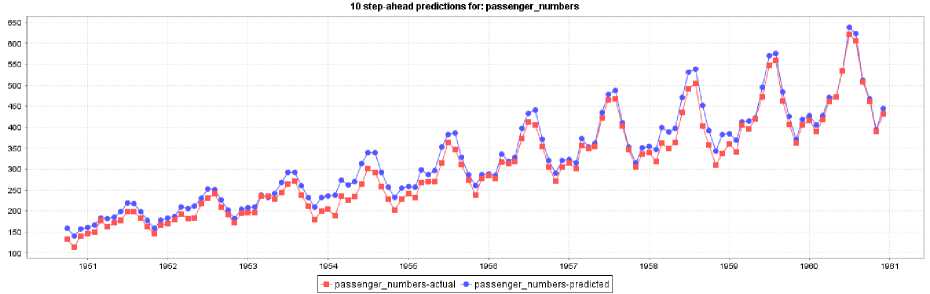
Fig.6. Actual and predicted total number of international airline passengers in thousands for10 steps ahead with multilayer perceptron on airline dataset
Table 4. Mean absolute error, root mean squared error of multilayer perceptron for predicted total number of international airline passengers in thousands for10 steps on airline dataset.
|
Multilayer perceptron |
1-step-ahead |
2-steps-ahead |
3-steps-ahead |
4-steps-ahead |
5-steps-ahead |
6-steps-ahead |
7-steps-ahead |
8-steps-ahead |
9-steps-ahead |
10-steps-ahead |
|
Mean absolute error |
9.45 |
11.30 |
10.41 |
12.52 |
13.14 |
14.18 |
15.79 |
16.89 |
18.02 |
19.76 |
|
Root mean squared error |
11.47 |
12.59 |
113.65 |
15.07 |
15.70 |
16.88 |
18.64 |
19.82 |
21.02 |
22.87 |
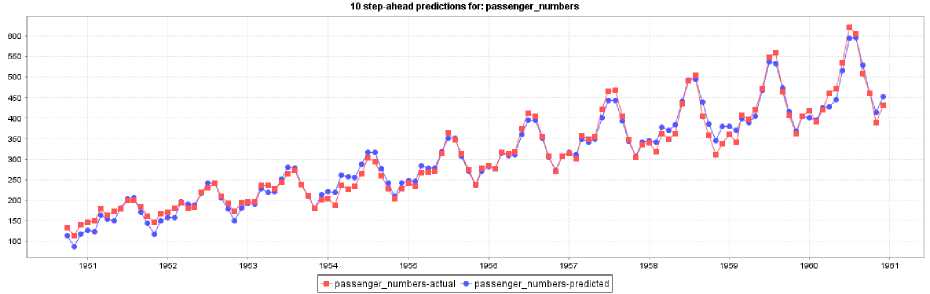
Fig.7. Actual and predicted total number of international airline passengers in thousands for10 steps ahead with SMOreg on airline dataset
Table 5. Mean absolute error, root mean squared error of SMOreg for predicted total number of international airline passengers in thousands for10 steps on airline dataset.
|
SMOreg |
1-step-ahead |
2-steps-ahead |
3-steps-ahead |
4-steps-ahead |
5-steps-ahead |
6-steps-ahead |
7-steps-ahead |
8-steps-ahead |
9-steps-ahead |
10-steps-ahead |
|
Mean absolute error |
8.26 |
10.74 |
11.60 |
12.01 |
12.19 |
12.40 |
12.45 |
12.65 |
12.98 |
12.70 |
|
Root mean squared error |
11.66 |
13.82 |
14.82 |
15.26 |
15.44 |
15.66 |
15.80 |
15.95 |
16.10 |
15.83 |
Table 6. Mean absolute error of Gaussian process, linear regression, multilayer perceptron, and SMOreg for sales of the fortified in thousands of litters for 10 steps on wine dataset
|
Mean absolute error |
||||||||||
|
Fortified |
1-step-ahead |
2-steps-ahead |
3-steps-ahead |
4-steps-ahead |
5-steps-ahead |
6-steps-ahead |
7-steps-ahead |
8-steps-ahead |
9-steps-ahead |
10-steps-ahead |
|
Gaussian process |
184.50 |
183.07 |
185.05 |
185.90 |
187.67 |
189.38 |
188.25 |
188.44 |
186.27 |
191.10 |
|
Linear regression |
152.52 |
154.17 |
155.14 |
158.43 |
162.51 |
162.73 |
168.09 |
168.28 |
170.89 |
179.36 |
|
Multilayer perceptron |
275.33 |
273.92 |
303.73 |
262.02 |
312.02 |
298.00 |
322.68 |
326.10 |
331.95 |
356.46 |
|
SMOreg |
131.89 |
138.19 |
143.42 |
148.23 |
151.59 |
155.35 |
160.43 |
162.27 |
163.80 |
171.72 |
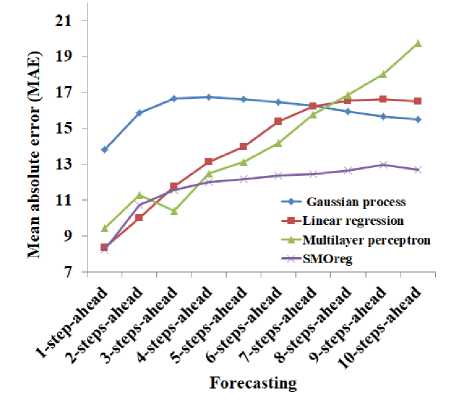
Fig.8. Mean absolute error of Gaussian process, linear regression, multilayer perceptron, and SMOreg with respect to the predicted total number of international airline passengers in thousands for10 steps on airline dataset.
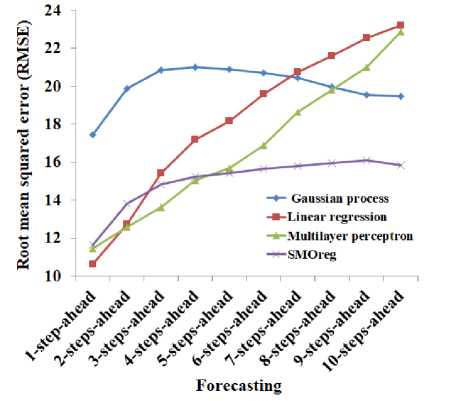
Fig.9. Root mean squared error of Gaussian process, linear regression, multilayer perceptron, and SMOreg with respect to the predicted total number of international airline passengers in thousands for10 steps on airline dataset.
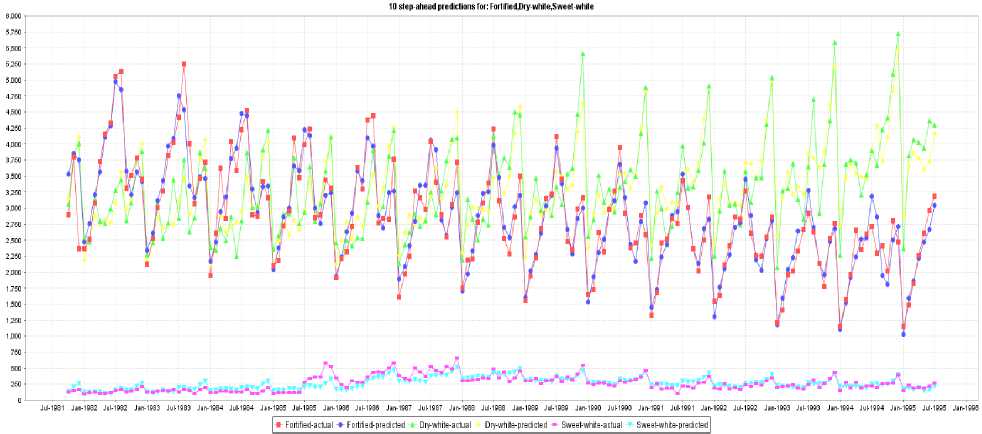
Fig.10. Actual and predicted sales of fortified, dry-wine, sweet-wine in thousands of litters for 10 steps on wine dataset using Gaussian process
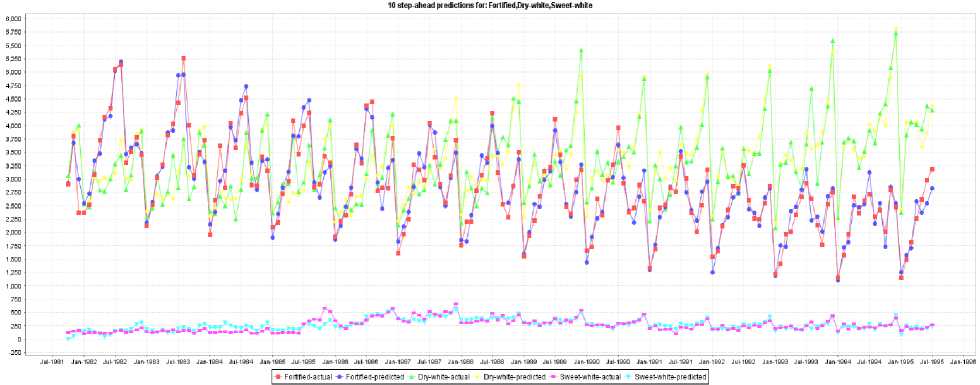
Fig.11. ctual and predicted sales of fortified, dry-wine, sweet-wine in thousands of litters for 10 steps on wine dataset using linear regression
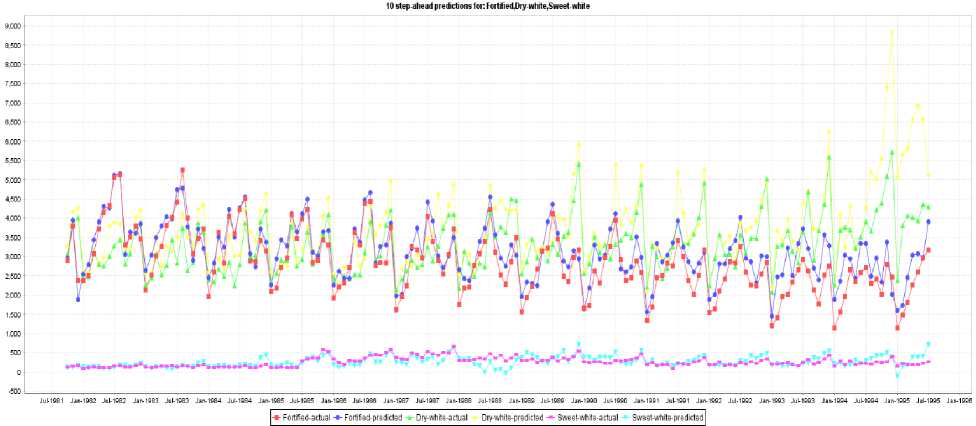
Fig.12. Actual and predicted sales of fortified, dry-wine, sweet-wine in thousands of litters for 10 steps on wine dataset using multilayer perceptron
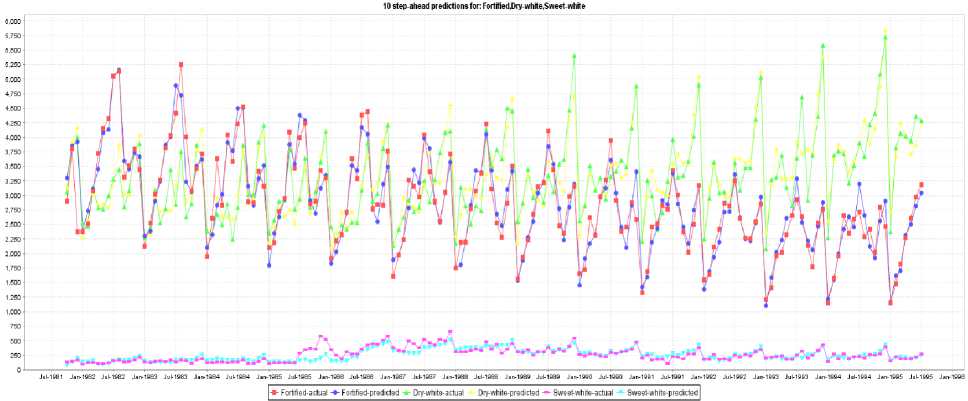
Fig.13. Actual and predicted sales of fortified, dry-wine, sweet-wine in thousands of litters for 10 steps on wine dataset using SMOreg
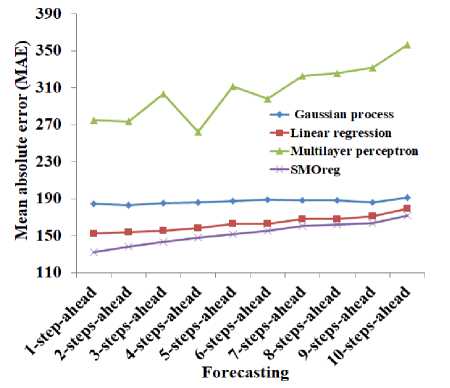
Fig.14. Mean absolute error of Gaussian process, linear regression, multilayer perceptron, and SMOreg for sales of the fortified in thousands of litters for 10 steps on wine dataset
Table 7. Mean absolute error of Gaussian process, linear regression, multilayer perceptron, and SMOreg for sales of the dry-white in thousands of litters for 10 steps on wine dataset
|
Mean absolute error |
||||||||||
|
Dry-white |
1-step-ahead |
2-steps-ahead |
3-steps-ahead |
4-steps-ahead |
5-steps-ahead |
6-steps-ahead |
7-steps-ahead |
8-steps-ahead |
9-steps-ahead |
10-steps-ahead |
|
Gaussian process |
213.46 |
217.78 |
218.51 |
219.14 |
224.99 |
226.46 |
228.70 |
229.84 |
230.42 |
230.69 |
|
Linear regression |
188.94 |
193.77 |
194.67 |
193.23 |
194.30 |
191.43 |
194.02 |
190.30 |
197.15 |
196.49 |
|
Multilayer perceptron |
220.56 |
210.11 |
200.70 |
198.30 |
232.17 |
310.12 |
317.34 |
343.14 |
399.32 |
462.59 |
|
SMOreg |
165.89 |
184.53 |
192.01 |
195.26 |
201.46 |
201.87 |
211.08 |
210.80 |
219.55 |
219.43 |
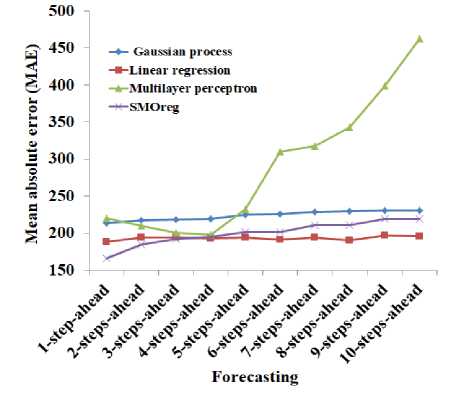
Fig.15. Mean absolute error of Gaussian process, linear regression, multilayer perceptron, and SMOreg for sales of the dry-white in thousands of litters for 10 steps on wine dataset
Table 8. Mean absolute error of Gaussian process, linear regression, multilayer perceptron, and SMOreg for sales of the sweet-white in thousands of litters for 10 steps on wine dataset
|
Mean absolute error |
||||||||||
|
Sweetwhite |
1-step-ahead |
2-steps-ahead |
3-steps-ahead |
4-steps-ahead |
5-steps-ahead |
6-steps-ahead |
7-steps-ahead |
8-steps-ahead |
9-steps-ahead |
10-steps-ahead |
|
Gaussian process |
33.53 |
36.78 |
40.13 |
41.22 |
42.84 |
45.18 |
46.04 |
46.82 |
47.66 |
48.15 |
|
Linear regression |
26.86 |
31.27 |
35.44 |
37.02 |
37.79 |
38.38 |
40.64 |
41.57 |
43.78 |
45.31 |
|
Multilayer perceptron |
25.88 |
32.83 |
40.64 |
44.56 |
51.70 |
56.92 |
60.69 |
67.73 |
72.49 |
83.87 |
|
SMOreg |
25.19 |
31.18 |
34.83 |
36.41 |
36.98 |
38.81 |
39.82 |
40.81 |
41.91 |
43.84 |
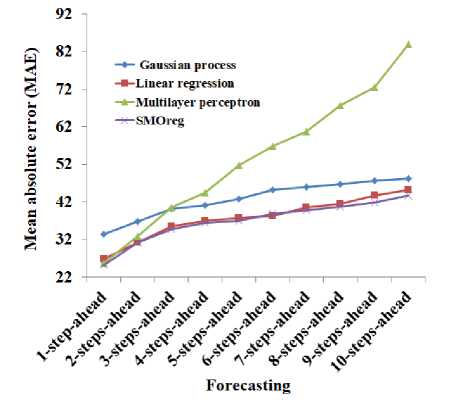
Fig.16. Mean absolute error of Gaussian process, linear regression, multilayer perceptron, and SMOreg for sales of the sweet-white in thousands of litters for 10 steps on wine dataset
Table 9. Root mean squared error of Gaussian process, linear regression, multilayer perceptron, and SMOreg for sales of the fortified in thousands of litters for 10 steps on wine dataset
|
Root mean squared error |
||||||||||
|
Fortified |
1-step-ahead |
2-steps-ahead |
3-steps-ahead |
4-steps-ahead |
5-steps-ahead |
6-steps-ahead |
7-steps-ahead |
8-steps-ahead |
9-steps-ahead |
10-steps-ahead |
|
Gaussian process |
248.15 |
249.811 |
253.00 |
253.98 |
256.23 |
258.09 |
257.96 |
256.8129 |
253.68 |
258.77 |
|
Linear regression |
198.71 |
208.52 |
210.05 |
211.82 |
213.70 |
213.88 |
220.27 |
218.45 |
219.68 |
227.64 |
|
Multilayer perceptron |
323.10 |
328.01 |
363.38 |
313.38 |
377.36 |
372.06 |
394.93 |
401.84 |
408.82 |
433.18 |
|
SMOreg |
232.89 |
236.82 |
240.62 |
241.28 |
245.78 |
246.27 |
249.73 |
249.74 |
249.33 |
253.15 |
Table 10. Root mean squared error of Gaussian process, linear regression, multilayer perceptron, and SMOreg for sales of the dry-white in thousands of litters for 10 steps on wine dataset
|
Root mean squared error |
||||||||||
|
Dry-white |
1-step-ahead |
2-steps-ahead |
3-steps-ahead |
4-steps-ahead |
5-steps-ahead |
6-steps-ahead |
7-steps-ahead |
8-steps-ahead |
9-steps-ahead |
10-steps-ahead |
|
Gaussian process |
272.41 |
276.38 |
278.08 |
279.27 |
285.01 |
286.92 |
288.54 |
289.67 |
294.88 |
295.95 |
|
Linear regression |
243.87 |
247.85 |
249.97 |
249.8311 |
251.10 |
252.38 |
256.51 |
253.94 |
269.31 |
269.02 |
|
Multilayer perceptron |
257.84 |
248.54 |
241.46 |
246.7488 |
294.60 |
393.58 |
426.71 |
487.96 |
580.53 |
719.31 |
|
SMOreg |
268.98 |
273.28 |
278.23 |
278.0713 |
280.85 |
281.84 |
284.47 |
283.75 |
297.49 |
296.27 |
Table 11. Root mean squared error of Gaussian process, linear regression, multilayer perceptron, and SMOreg for sales of the sweet-white in thousands of litters for 10 steps on wine dataset
|
Root mean squared error |
||||||||||
|
Sweetwhite |
1-step-ahead |
2-steps-ahead |
3-steps-ahead |
4-steps-ahead |
5-steps-ahead |
6-steps-ahead |
7-steps-ahead |
8-steps-ahead |
9-steps-ahead |
10-steps-ahead |
|
Gaussian process |
44.39 |
48.82 |
54.43 |
57.23 |
59.62 |
61.92 |
62.93 |
63.97 |
65.06 |
65.80 |
|
Linear regression |
36.06 |
41.59 |
48.05 |
49.56 |
51.19 |
53.39 |
55.83 |
56.89 |
59.19 |
61.49 |
|
Multilayer perceptron |
33.89 |
43.47 |
56.39 |
61.53 |
75.48 |
82.26 |
87.52 |
97.03 |
103.84 |
117.46 |
|
SMOreg |
43.97 |
50.23 |
56.21 |
59.82 |
61.89 |
64.89 |
65.58 |
66.54 |
67.60 |
68.84 |
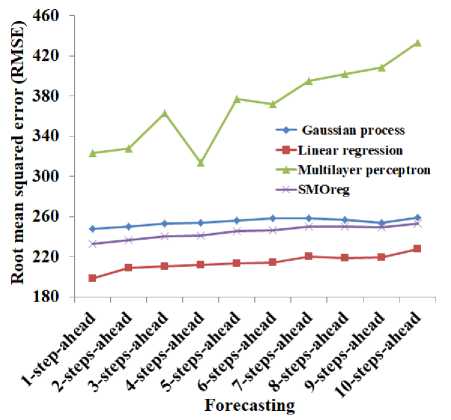
Fig.17. Root mean squared error of Gaussian process, linear regression, multilayer perceptron, and SMOreg for sales of the fortified in thousands of litters for 10 steps on wine dataset
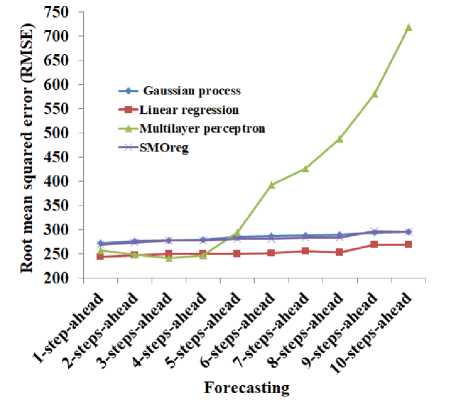
Fig.18. Root mean squared error of Gaussian process, linear regression, multilayer perceptron, and SMOreg for sales of the dry-white in thousands of litters for 10 steps on wine dataset
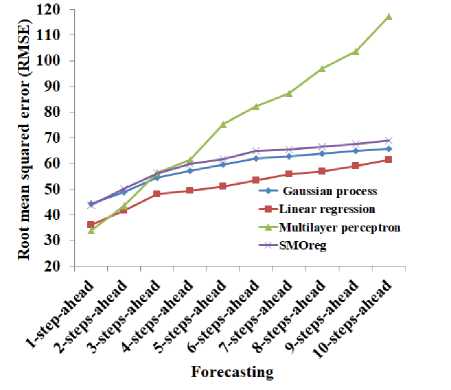
Fig.19. Root mean squared error of Gaussian process, linear regression, multilayer perceptron, and SMOreg for sales of the sweet-white in thousands of litters for 10 steps on wine dataset
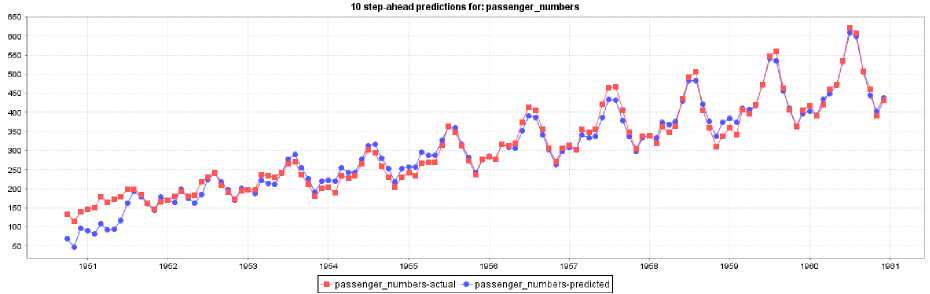
Fig.5. Actual and predicted total number of international airline passengers in thousands for10 steps ahead with linear regression on airline dataset.
From the Table 6 and Figure 14 it is observed that the SMOreg performs better for the prediction of the sales of fortified on wine dataset in terms of Mean absolute error compare to other algorithms. Moreover, the performance of linear regression, Gaussian process, and multilayer perceptron are ranked in terms of mean absolute error as second, third, and fourth, respectively.
From the Table 7 and Figure 15 it is observed that the overall performance of linear regression is comparably better than the other algorithms that are used. Moreover, the performance of linear regression, Gaussian process, and multilayer perceptron are ranked in terms of mean absolute error as second, third, and fourth, respectively.
From the Table 8 and Figure 16 it is observed that the overall performance of SMOreg and linear regression is comparably better than the other algorithms that are used. Moreover, the performance of Gaussian process and multilayer perceptron are ranked in terms of mean absolute error as second, and third, respectively.
The Figures from Figure 10 to Figure 12 show the actual and predicted sales of fortified, dry-wine, sweetwine in thousands of litters for 10 steps on wine dataset using Gaussian process, linear regression, multilayer perceptron, and SMOreg, respectively.
The Table 9 to Table 11 and Figure 17 to Figure 19 show the root mean squared error of Gaussian process, linear regression, multilayer perceptron, and SMOreg for sales of the fortified, dry-white, and sweet-white, respectively, in thousands of litters for 10 steps on wine dataset
From the Table 9 and Figure 17, it is observed that the linear regression performs better for the prediction of the sales of fortified on wine dataset in terms of Mean absolute error compare to other algorithms. Moreover, the performance of SMOreg, Gaussian process, and multilayer perceptron are ranked in terms of mean absolute error as second, third, and fourth, respectively.
From the Table 10 and Figure 18, it is observed that the linear regression performs better for the prediction of the sales of fortified on wine dataset in terms of Mean absolute error compare to other algorithms. Moreover, the performance of SMOreg, Gaussian process are comparably similar, and multilayer perceptron fails to perform for the more number of steps.
From the Table 11 and Figure 19, it is observed that the linear regression performs better for the prediction of the sales of fortified on wine dataset in terms of Mean absolute error compare to other algorithms. Moreover, the performance of Gaussian process performs better than the SMOreg. and multilayer perceptron fails to perform for the more number of steps.
-
VI. Conclusion
In recent past, many researches attempt to carry out the business forecasting using different tools. However, this paper presents the business forecasting for sales data using machine learning technique. Moreover, in order to develop the forecasting model the forecasting algorithms namely Gaussian process, linear regression, multilayer perceptron, and SMOreg are used. The forecasting model is built for sales data prediction using two bench mark datasets namely airlines and wine. Moreover, the performance of the forecasting model is evaluated using the performance evaluation metrics such as mean absolute error (MAE) and root mean squared error (RMSE). From the obtained results, the overall performance of the SMOreg is better for the airline dataset compared to other algorithm that are used for evaluation and the overall performance of the linear regression is better for the wine dataset compared to other algorithms that are used for evaluation.
References Machine learning based business forecasting
- Yu, X., Qi, Z. and Zhao, Y., 2013. Support vector regression for newspaper/magazine sales forecasting. Procedia Computer Science, 17, pp.1055-1062.
- Kaneko, Y., Miyazaki, S. and Yada, K., 2017. The Influence of Customer Movement between Sales Areas on Sales Amount: A Dynamic Bayesian Model of the In-store Customer Movement and Sales Relationship. Procedia Computer Science, 112, pp.1845-1854.
- D. Asir Antony Gnana Singh, E. Jebamalar Leavline, S. Muthukrishnan, R. Yuvaraj, November 17 Volume 3 Issue 11, “Regression Based Sales Data Forecasting for Predicting the Business Performance”, International Journal on Future Revolution in Computer Science & Communication Engineering (IJFRSCE), PP: 589 - 593
- Chen, F.L. and Ou, T.Y., 2011. Sales forecasting system based on Gray extreme learning machine with Taguchi method in retail industry. Expert Systems with Applications, 38(3), pp.1336-1345.
- Choi, T.M., Hui, C.L., Liu, N., Ng, S.F. and Yu, Y., 2014. Fast fashion sales forecasting with limited data and time. Decision Support Systems, 59, pp.84-92.
- Lu, C.J., 2014. Sales forecasting of computer products based on variable selection scheme and support vector regression. Neurocomputing, 128, pp.491-499.
- Clark, T.E. and Ravazzolo, F., 2015. Macroeconomic Forecasting Performance under Alternative Specifications of TimeVarying Volatility. Journal of Applied Econometrics, 30(4), pp.551-575.
- Kulkarni, G., Kannan, P.K. and Moe, W., 2012. Using online search data to forecast new product sales. Decision Support Systems, 52(3), pp.604-611.
- Fan, Z.P., Che, Y.J. and Chen, Z.Y., 2017. Product sales forecasting using online reviews and historical sales data: A method combining the Bass model and sentiment analysis. Journal of Business Research, 74, pp.90-100.
- Orbach, Y. and Fruchter, G.E., 2011. Forecasting sales and product evolution: The case of the hybrid/electric car. Technological Forecasting and Social Change, 78(7), pp.1210-1226.
- Schneider, M.J. and Gupta, S., 2016. Forecasting sales of new and existing products using consumer reviews: A random projections approach. International Journal of Forecasting, 32(2), pp.243-256.
- Karvelis, P., Kolios, S., Georgoulas, G. and Stylios, C., 2017, October. Ensemble learning for forecasting main meteorological parameters. In Systems, Man, and Cybernetics (SMC), 2017 IEEE International Conference on (pp. 3711-3714). IEEE.
- Quan, H., Srinivasan, D. and Khosravi, A., 2014. Short-term load and wind power forecasting using neural network-based prediction intervals. IEEE transactions on neural networks and learning systems, 25(2), pp.303-315.
- Ahmad, A.S., Hassan, M.Y., Abdullah, M.P., Rahman, H.A., Hussin, F., Abdullah, H. and Saidur, R., 2014. A review on applications of ANN and SVM for building electrical energy consumption forecasting. Renewable and Sustainable Energy Reviews, 33, pp.102-109.
- Antonanzas, J., Osorio, N., Escobar, R., Urraca, R., Martinez-de-Pison, F.J. and Antonanzas-Torres, F., 2016. Review of photovoltaic power forecasting. Solar Energy, 136, pp.78-111.
- Hong, T. and Fan, S., 2016. Probabilistic electric load forecasting: A tutorial review. International Journal of Forecasting, 32(3), pp.914-938.
- Jain, R.K., Smith, K.M., Culligan, P.J. and Taylor, J.E., 2014. Forecasting energy consumption of multi-family residential buildings using support vector regression: Investigating the impact of temporal and spatial monitoring granularity on performance accuracy. Applied Energy, 123, pp.168-178.
- Chen, X.Y., Chau, K.W. and Busari, A.O., 2015. A comparative study of population-based optimization algorithms for downstream river flow forecasting by a hybrid neural network model. Engineering Applications of Artificial Intelligence, 46, pp.258-268.
- Eibe Frank, Mark A. Hall, and Ian H. Witten (2016). The WEKA Workbench. Online Appendix for "Data Mining: Practical Machine Learning Tools and Techniques", Morgan Kaufmann, Fourth Edition, 2016.
