Machine Learning-based Intrusion Detection Technique for IoT: Simulation with Cooja

Author: Ali H. Farea, Kerem Kucuk
Journal: International Journal of Computer Network and Information Security @ijcnis
Article in issue: 1 vol.16, 2024.
Free access
The Internet of Things (IoT) is one of the promising technologies of the future. It offers many attractive features that we depend on nowadays with less effort and faster in real-time. However, it is still vulnerable to various threats and attacks due to the obstacles of its heterogeneous ecosystem, adaptive protocols, and self-configurations. In this paper, three different 6LoWPAN attacks are implemented in the IoT via Contiki OS to generate the proposed dataset that reflects the 6LoWPAN features in IoT. For analyzed attacks, six scenarios have been implemented. Three of these are free of malicious nodes, and the others scenarios include malicious nodes. The typical scenarios are a benchmark for the malicious scenarios for comparison, extraction, and exploration of the features that are affected by attackers. These features are used as criteria input to train and test our proposed hybrid Intrusion Detection and Prevention System (IDPS) to detect and prevent 6LoWPAN attacks in the IoT ecosystem. The proposed hybrid IDPS has been trained and tested with improved accuracy on both KoU-6LoWPAN-IoT and Edge IIoT datasets. In the proposed hybrid IDPS for the detention phase, the Artificial Neural Network (ANN) classifier achieved the highest accuracy among the models in both the 2-class and N-class. Before the accuracy improved in our proposed dataset with the 4-class and 2-class mode, the ANN classifier achieved 95.65% and 99.95%, respectively, while after the accuracy optimization reached 99.84% and 99.97%, respectively. For the Edge IIoT dataset, before the accuracy improved with the 15-class and 2-class modes, the ANN classifier achieved 95.14% and 99.86%, respectively, while after the accuracy optimized up to 97.64% and 99.94%, respectively. Also, the decision tree-based models achieved lightweight models due to their lower computational complexity, so these have an appropriate edge computing deployment. Whereas other ML models reach heavyweight models and are required more computational complexity, these models have an appropriate deployment in cloud or fog computing in IoT networks.
Attacks Analysis, Hybrid IDPS, IoT, 6LoWPAN Attacks, Lightweight Models, Machine Learning, Models Deployment
Short address: https://sciup.org/15018817
IDR: 15018817 | DOI: 10.5815/ijcnis.2024.01.01
Text of the scientific article Machine Learning-based Intrusion Detection Technique for IoT: Simulation with Cooja
The "Internet of Things" (IoT) refers to wireless sensors that have the potential to connect to the internet and store data in the cloud. It includes intelligent gadgets with internet access, sensors, microprocessors, and actuators incorporated into their systems [1-3]. Real-world data is collected by the sensors, processed by the microcontroller, and then acted upon by the actuators to produce events. These devices are self-configuring and remotely controllable [4]. It is also a network made up of highly restricted nodes (limited CPU, memory, and power) [5]. It has become the de facto standard for creating smart homes and cities [6]. Typically, with IoT systems, we interact with heterogeneous devices and networks [7]. It may improve efficiency and productivity through remote administration, but it also raises the potential for attacks. Hence, the necessity to minimize risk and potential dangers to IoT systems.
The IoT is a systematic strategy to connect things to the internet to maximize utility [8]. It must have been crucial to find a mechanism to incorporate the IEEE 802.15.4 protocol for Low Power Wireless Personal Area Networks (LoWPANs) with IPv6 network protocols, support a wide address space and allow connections to many devices [9].
Therefore, the development of 6LoWPAN technology provided an appropriate solution to this challenge [8-9]. 6LoWPANs is a particular form of low-power and lossy networks (LLN) that transmits IP over IEEE 802.15.4 networks and is composed of objects that satisfy the IEEE 802.15.4 standard [10]. However, 6LoWPAN was the beginning of a series of security risks and threats that must be addressed [11-12]. Therefore, safety, such as confidentiality and integrity protection, is usually needed in IPv6 over LoWPAN systems [13]. So, the attacker can perform the attack at any network layer in the stack. Additionally, the adaptation layer of LoWPAN provides header compression, fragmentation, and reassembly services, allowing IPv6 connections to be given to highly connected devices in IoT networks to comply with the IEEE 802.15.4 standard [8,14].
Effective intrusion detection systems (IDSs) must be created for IoT applications. There is a lack of enough benchmark IoT datasets to train and evaluate specific IDS and ML-IDS in the IoT ecosystem [15]. due to a shortage of implementation and analysis of attacks in IoT environments. Many academic researchers may propose an IDS for 6LoWPAN devices without analyzing the attacks to know the parameters or features of the attack. Implementation and analysis of the attacks help the developers design IDS-based IoT features and produce benchmark IoT datasets that meet the requirements and are compatible with all attacks and devices. These criteria may be features used in IDS and ML techniques as input criteria to detect attacks. To identify IoT threats, many researchers are currently attempting to utilize the ML approach to overcome security challenges, making this strategy an intriguing resolution [2,16].
A fascinating technique that exists today integrates cloud computing with the IoT [5,17]. Cloud storage acts as a subtle intermediate layer between things and apps. The massive amounts of data generated by IoT devices, also known as "big data," are a product of interaction between connected devices and put significant demand on the internet's infrastructure [5,18]. Therefore, organizations have been forced to hunt for a resolution or replacement to decrease this load, and cloud computing has been introduced to address this issue by offering on-demand and virtual services like unlimited storage capacity [19-20]. These two technologies complement and work together to make daily tasks more effectively. But cloud computing security and privacy concerns are severe unless the service provider is trusted.
This paper implements three attacks to generate the proposed dataset based on 6LoWPAN features in the IoT. These attacks are a denial-of-service attack (DoS), a black hole attack (BHA), and an on-off attack (OOA). These attacks are analyzed to evaluate the features and parameters affected by the attacks and identify anomalies. In the analysis phase, six scenarios were implemented. Three are free of malicious nodes, and the others include malicious nodes. The typical scenarios are a benchmark for the malicious scenarios for comparison, tracking the behaviors, exploring the features that are affected by malicious nodes, and comparing them with malicious nodes. In normal cases and anomalies, the noticeable parameters/features are explored via radio message analysis and the power consumption due to being affected during implementation. These features are used as input to train our proposed hybrid IDPS to detect and prevent 6LoWPAN attacks in the IoT ecosystem and test them to evaluate the hybrid IDPS' accuracy. Therefore, due to these apparent parameters, our proposed hybrid IDPS may be able to identify and prevent attacks in the IoT ecosystem based on these parameters. The proposed hybrid IDPS is trained and tested on both the KOU-6LoWPAN-IoT dataset (Generated and offered by us via the Cooja simulator) and the Edge IoT dataset (Generated in a realistic environment [21]) in IoT. Also, in both 2-class and N-class to evaluate the accuracy. Also, this paper compared the ML models based on time complexity to find lightweight models and extract model accuracy results from several studies to find the optimal models. The deployment of the models on the IoT has been proposed for the edge, fog, and cloud computing based on light and heavy models.
The main contributions and goals of this paper related to 6LoWPAN in IoT security are represented in the following points:
• Implementing three different 6LoWPAN attacks in IoT via Contiki OS to generate the proposed dataset based on 6LoWPAN features.
• Analysing and exploring the features affected by attacks for DoS, BHA, and OOA to utilize as criteria input for our proposed IDPS or any ML models.
• Proposing a hybrid IDPS to detect and prevent the 6LoWPAN attacks in the IoT with tests on both KoU-6LoWPAN-IoT and Edge-IIoT datasets for both 2-class and N-class with optimize the accuracy.
• Investigating the lightweight and optimal models with deployment models in the IoT ecosystem based on time complexity and accuracy.
2. Related Works
The remaining sections are organized as follows: The second part is related to work and reviews attacks in the IoT environment. The third part illustrates the methodology of this work, which includes several phases, whereas the fourth section discusses the evaluation metrics of the proposed hybrid IDPS mechanism. The fifth section summarizes the conclusion of this work.
Increased the number of IoT devices connected to the internet leads to increased security and privacy concerns in the IoT. Therefore, updating the data about the security of IoT to date is significant. Current studies offer various security measures in the literature for IoT security concerns.
According to the authors from [22-36]. Each author has different proposed IDS to detect a specific attack. Also, their proposed IDS have other criteria as input to detect DoS, BHA, and OOA attacks, respectively. These different proposed IDS may be successful in a fashion manner to detect known attacks based on the rules that were identified previously to IDS. However, it will be impossible for new abnormalities to detect and adapt to recent attacks automatically, especially as technology advances and further attacks emerge. Moreover, it was difficult to implement more than one attack, analyze their behaviors, and extract comprehensive, clear parameters as inputs for their IDS. Special IDS for each attack might use system resources and prevent the gadget from being expanded to detect new attacks. Therefore, the specific IDS cannot assess the resource automatically and detect the anomaly for other attacks due to the limited features input that is only dependent on one attack feature. Hence, implementation, examination, and analysis of attacks mainly helpful to extract general and comprehensive criteria (features/ characteristics) for evaluating all attacks, as well as help developers develop an IDS based on criteria capable of detecting more than one attack that does not depend on the criteria for one attack features. Therefore, implementing and analyzing the attacks is the best way and the first point to find evaluation criteria before proposing an IDS.
Machine learning (ML) techniques have witnessed remarkable development in their ability to identify abnormal behaviors, detect new attacks, and adapt to them. Recently, many researchers have been directed to employ ML algorithms to detect anomalous behaviors in the IoT environment. ML techniques have proven effective in detecting and classifying attacks. The authors in [40-41] utilized ML approaches to detect attacks in IoT sensor networks, and they used Artificial Neural Network (ANN), Logistic Regression (LR), Random Forest (RF), support vector machine (SVM), and Decision Tree (DT) techniques. Also, they used the DS2OS dataset as input for their ML-IDS. The authors in [42-43] employed K Nearest Neighbors (KNN), SVM, DT, Naïve Bayes (NB), RF, ANN, and LR techniques in their experimental analysis of attack classification using ML in IoT networks. They used the Bot-IoT- UNSW dataset. The authors in [44-45] used supervised ML techniques in networks such as IDS to classify the IoT attack. They used the NSL-KDD and KDDCUP99 datasets. Furthermore, the authors in [46-47] use different machine-learning approaches to build classification models for the IoT ecosystem. Also, they employed other datasets as inputs in their models, the UNSW-NB15 and IoT-23 datasets, respectively.
Hence, ML techniques are among the promising dynamic technologies. One limitation encountered in [40-48] is the non-availability of datasets. These datasets need to be updated to keep up with new technologies and attacks. However, when they used ML techniques, the biggest problem was obtaining datasets that reflected the parameters of the IoT attacks. There is a shortage of real datasets and extracting the features that are affected via attacks in the IoT ecosystem [15]. Using datasets and extracting the features related to IoT reflects the real IoT. The reason behind this gap is the lack of implementation, examination, testing, and analysis of the attacks and produce an updated and up-to-date dataset containing various attacks that have the characteristics of the IoT [15,40,48]. However, the same ML techniques and the same set of data may be used, so the results will be the same as each other in more than one work. Also, some of these datasets do not contain IoT parameters to reflect IoT attack features. Also, some datasets do not include the network traffic of 6LoWPAN devices. Moreover, none of the datasets has power consumption. Large companies with IoT datasets are not shared or available with research communities [15]. The main reason for this is privacy concerns. Finding standard evaluation criteria that can be applied and analyzed for all attacks helps developers find appropriate and effective methods for automatically evaluating and detecting other attacks.
This paper uses generated and up-to-date datasets to reflect 6LoWPAN features in IoT. Therefore, three attacks in 6LoWPAN devices are implemented, analyzed, examined, and tested to produce a dataset. These three attacks are called DoS, BHA, and OOA. The main goal of implementation is to generate a dataset that reflects the 6LoWPAN feature in IoT. Furthermore, this work analyzes and explores clear parameters to be utilized as input in our proposed hybrid IDPS to detect and prevent attacks in IoT. As well as this paper address significant issues in IoT security, such as finding lightweight models based on time complexity and placement strategy of an IDS in IoT networks.
3. Methodology
This work consists of several phases to address some aspects of the security problems for 6LoWPAN in the IoT, as shown in Fig.1. During the selection phase, we chose the attacks that were implemented in our scenarios based on a set of criteria to address a variety of 6LoWPAN issues. In the implementation phase, we carried out the selected attacks: DoS, BHA, and OOA. Then, the attacks are analyzed in the analysis phase. After analyzing the attacks and scenarios, the data are collected, extracted, and saved in a dataset to be used as input in the proposed hybrid IDPS. The Hybrid-IDPS would detect and prevent IoT attacks during the detection and prevention phase.
01 SELECTION PHASE
PLACEMENT STRATEGY 03
PHASE

LIGHTWEIGHT
MODELS PHASE


DETECTION PHASE
COLLECT AND EXTRACT DATA
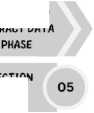
Fig.1. Our phases to address 6LoWPAN security
Lightweight IDS are required to detect attacks on tiny devices; these lightweight IDS-ML are explained in the lightweight model’s phase. The proposed IDPS placement in the network was investigated during the placement strategy phase.
-
3.1. Attack Selection Phase
-
3.2. Attack Implementation Phase
In this part, it is necessary to select various samples that cover most aspects of 6LoWPAN in the IoT. An attacker may exploit any network layer for any reason, either to steal data, modify it or deny it, or break any security requirement such as confidentiality, integrity, and data availability. Therefore, three carried out attacks involving most layers of the 6LoWPAN network. The attacks can be performed on any of the layers of the 6LoWPAN. Thus, DoS attacks are executed in the UDP. A DoS attack affects network traffic by overwhelming the network with many requests. Therefore, this attack breaks the most important security requirement, which is availability. Black hole attacks are carried out in the network layer. This type of attack affects the network topology by isolating many nodes. Also, the OOA was carried out in the transport layer, and some functions were controlled in the MAC/PHY layer. Because of its inconsistency, this type of attack undermines network trust. Therefore, OOA violates the integrity of the security requirements. It is a good idea to perform the various attacks in several layers to generate various data and samples to be tested on the detection system. The detection model's performance may be high when only one attack or several attacks are executed in a single layer, but executing it from multiple layers reveals the model's actual performance.
In the simulation phase, the Contiki OS [49] was utilized to implement the 6LoWPAN attacks in the IoT. Contiki OS is a powerful stimulator for next-generation IoT ecosystems. In each scenario, the network of the Cooja simulation is configured as in Table 1. All the scenarios are set up on the 6LoWPAN protocol, which contains UDP, IPv6, ICMP, RPL, 6LoWPAN, and IEEE 802.15.4. In each scenario, the total of nodes is eight. The server or sink is the root, and the node number of the root is 1. Nodes 2 through 7 are free from malicious nodes, while node eight includes the malicious code. A malicious node does have the color red in all scenarios. Both the nodes free of malicious code and those with malicious code seek services from the root, which either serves them or collects their data.
-
A. DoS Attack Implementation
DoS attacks are a major issue for constrained IoT devices. Therefore, DoS attacks are intended to prevent users from accessing network and system resources. A DoS occurs in the IoT when an attacker sends excessive requests to the primary server or host, preventing the intended users from accessing the service. To overwhelm the network with traffic and restrict normal requests and traffic from accessing the network, the attacker node is used to overflow either data or requests. The malicious node also prevents other nodes from directly connecting to the server. The malicious node will attempt to prevent any legitimate node from connecting to the targeted node because it is busy processing malicious nodes' requests. Fig. 2. illustrates the basic structure and concept of DoS attacks. The node in red is the attacking node, which sends many requests amounting to 60 requests every minute to the node in the middle, which is the victim node, while the node on the right side is the node that sends normal requests amounting to one request every minute.
Table 1. General configuration of scenarios in Cooja
|
Operating system and Simulator |
Contiki OS with Cooja simulator |
|
Type of protocol in the transport layer |
User Datagram Protocol (UDP) |
|
Type of protocol in the Network layer |
Internet Protocol version 6 (IPv6), Internet Control Message Protocol (ICMP), and IPv6 Routing protocol (RPL) |
|
Adaptation layer |
IPv6 over Low-Power Wireless Personal Area Networks (6LoWPAN) |
|
Physical and Data link layer |
IEEE 802.15.4 |
|
Distance of Network |
180 m2 |
|
Root |
Sink/Server per scenario |
|
Type of nodes (Hardware) |
Sky mote (MSP430F1611) |
|
Number of normal nodes |
Six nodes per scenario |
|
Number of malicious nodes |
One node per scenario |
In the DoS scenario, two timers are defined for sending requests to the server: one for malicious and the other for normal nodes. The timer in malicious nodes transmits their UDP requests (UDP packets) to the server per second. whereas the timer in normal nodes sends UDP requests to the server once per minute (This is considered a normal case). In other words, the timer is configured to send UDP packets to their target (server) within a predetermined 60-second period time, but in malicious nodes, the timer is set up to make requests within a preset one-second period time.
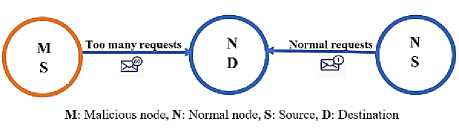
Fig.2. Basic structure of DoS attack
Due to the malicious node flooding many requests, there is an evident flood of radio traffic and data between the Sink/Server and the malicious node. This means that, compared to normal nodes, the malicious node produces a massive proportion of UDP packages. Therefore, after 45 minutes pass, the number of requests from the malicious node amounts to 2700 requests relative to the normal node 4, which up to 48 requests. This means the ratio of UDP requests from malicious nodes is greater than the ratio of UDP requests from normal nodes, and the rate of increase is 57 times. These parameters affected by malicious nodes will be considered in detail in the DoS attack analysis section.
-
B. BHA Attack Implementation
In the BHA, the data packages are not retransmitted or forwarded by the attacker node. The attacker node discards or drops the packets. It intentionally does that or wrongly configures packages to drop packets from neighboring nodes and not forward them to their intended destination. Fig.3. illustrates the basic structure and concept of BHA attacks. The node in red is the malicious node, which drops or discards any packages that are received from the left-side node and does not forward these packets to the target in the right-side node. Due to the multi-hop of nodes, the black hole is more eloquent, impacting the network topology as in Fig.4. In this case, we perfectly located the malicious node between several nodes that interact with the sink through the malicious node. The data packets from nodes 6 and 7 are routed through a malicious node on their path to the sink. In the BHA, we denoted the malicious node by its ID of 8. We configured global variables and reset them to zero to discard the packages. The values of global variables are typically greater than zero. Because these variables' values are updated and changed during each operation, we developed the drop function, and the global variable values are reset to zero by the drop statement to drop packages. The attacker node could or might not continue receiving and forwarding the data packets produced by other nodes. It drops all packages from their neighbors. The black hole is eloquent when the malicious node is intermediate between two groups of nodes, and these groups can't communicate just through the malicious node, which may lead to separated many nodes.
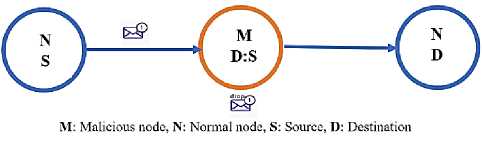
Fig.3. Basic structure and concept of BHA attack
Fig.4. The topology isolated in BHA attack
The network topology is isolated, as in Fig.4., and the transmit and receive data from nodes 6 and 7 is not reachable to the sink due to a malicious node not forwarding the packet to its destination. In BHA analysis section will consider these parameters affected by malicious nodes in detail.
-
C. OOA Attack Implementation
-
3.3. Attacks Analysis Phase
OOA attack is a selective attack that generates trusted and untrusted packages. The malicious node alternately fetches these packages and sends them to neighboring nodes. The malicious node makes normal neighboring nodes doubtful and unreliable. This type of attack has two cycle states: on cycle and off cycle. The on-status alternately fetches malicious and normal packets when the cycle status is ON, known as the attack status. But if the device's cycle is off, do nothing. Also, this is known as the "normal" status. It makes detecting the attack's behaviors difficult because of their inconsistent behavior of generating unstable packets and fetching them to neighboring nodes, which makes the harmful node suspect. The harmful node switches between two cycles of ON and OFF. Therefore, the harmful node has initiated the attack, is alternately fetching malicious and normal packets if the cycle is ON, and remains silent and does nothing if the status is OFF. The node in red is the malicious node, which alternately generates trusted and untrusted packets to their destinations. The middle node receives suspicious and unreliable packets due to receiving inconsistent packets from the malicious node, as shown in Fig.5. We developed a function to generate trusted and untrusted packages if the cycle is ON, and it fetches these packages alternately. Therefore, the parameters of malformed packets are completely different from the normal packets. The output of the malicious node alternately produces trusted and untrusted packages and sends them to neighboring nodes.
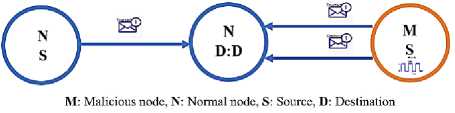
Fig.5. Basic structure and concept of OOA attack
In this paper, our analysis approaches for each attack consist of three-stage processes: The simulator stage, information aggregation, and results in extraction. In the simulation stage, six scenarios were implemented. In the aggregation stage: the tools needed to collect the data were used, such as the 6LoWPAN analyzer, Cooja.log, and power trace application. Data extraction stage: The stages in which the features affected by the attacks were extracted and compared with the attack-free scenarios. Therefore, we have implemented three normal and malicious scenarios: DoS, BHA, and OOA in 6LoWPAN. Therefore, these types of scenarios were created to record and compare the parameters/features for them. In a normal scenario, we implemented it free of malicious nodes and used it as a benchmark for comparison. The malicious scenario includes the malicious nodes. Therefore, the normal scenarios (NS) are free from the malicious node in each scenario, while the malicious scenarios (MS) include a malicious node in each attack.
In this study, the parameters/features used to evaluate attacks in the scenes are radio messages and power consumption parameters. The reason is that when implementing any scenario and following their behaviors, we noted that the power consumption of the harmful node is very high compared to normal nodes, as well as the features of radio message (6LoWPAN protocol stack) in malicious activities are affected due to the variation and update matrix/variables in each operation. Therefore, the radio messages and power consumption parameters are captured while the simulation runs in each scenario. The radio messages are captured via a 6LoWPAN analyzer tool and opened utilizing Wireshark where the power features are captured by calling the power trace application and displayed in the output of Cooja and saved as a file.csv for analysis. Thus, this is considered data aggregation. Fig.6. shows the analysis approach.
Cooja environment includes malicious and normal nodes
Output of Cooja
Normal
scenarios: it is free from malicious node
It produces the power computation features.
Malicious
scenarios: It includes malicious
Extraction the features
Benchmark
Comparison normal and malicious scenarios
Results
Fig.6. Analysis approach
The radio messages include all the parameters of the 6LoWPAN protocol stack. At the same time, the power trace includes all related features of power per node, like transceiver power consumption. In the extraction stage, some features that affect the network in each scenario are sorted, extracted, and compared to obtain the results. The goal of the analysis phase is to understand in depth the difference between normal and malicious scenarios and their impacts on some obvious parameters and features. As well as Attack analysis may give us a standard approach to extracting features that are affected by the attacks. These features may be used as features of the dataset used and tested by ML models or as input to the IDS to test its accuracy in detecting attacks, as we used them in the proposed hybrid IDPS as inputs.
-
A. DoS Attack Analysis
In these scenarios, the parameters under evaluation in the DoS situations are UDP packet sent/received and UDP packet delivery by sink node, as in Table 2. Packet delivery is the ratio of the number of data packets sent from all nodes to the number of packets received successfully at the sink. The Sink node does not release any data packets. We used a counter to count the requests from the clients to the server and traced them via the output window. Another option is to use Wireshark to provide details about the packets. Ideally, all normal nodes must produce one request every 1 minute and 45 requests over 45 minutes to the server unless there is a delay in the buffer queue. Because the normal nodes send their requests to the server every minute so in comparison to the normal scenario and malicious scenario in DoS, as shown in Table 2 and Table 3. Table 2 summarizes the statistics of the observed parameters in normal and malicious scenarios, while Table 3 summarizes the comparison between normal and malicious scenarios. The number of requests in the normal scenario was 311, while this number in the malicious scenario increased by a very high rate + 866 %, reaching 3007 requests. This increase in requests from malicious/client 8 increases the server load eight times over the normal scenario, and it can destroy the server or target in a few minutes. In the malicious Scenario As the overall number of requests received by the sink node from individual nodes decreased due to the number of dropped packets by malicious nodes and their delay in the buffer queue, where the number of packets dropped in the malicious Scenario amounted to 480 this is represented as a ratio of 18 % of the total packages. The number of requests from the malicious node represents the highest number, reaching 2704, while the number of requests from other nodes does not exceed 60 over 45 minutes. These unexpected requests released by the malicious node to the server indirectly prevent other nodes from gaining access to the server in the expected time. Additionally, delays occurred in receiving packages to the server node due to the improper performance of the node that has been attacked to work functions.
In Dos attacks, the malicious node consumes a lot of energy while in the transmission state (radio transmit), as in Fig.7., colored red, and the reason is that the transmission rate in the malicious node is excessively large compared to normal. For example, the malicious node in DoS attacks sends 60 packets over one minute, while the normal node may send only one packet or not if packets are delayed in the queue. In the malicious node, we noted that too little power is consumed while the radio is listening and from the processor. It colored yellow and green, respectively, as in Fig.7.
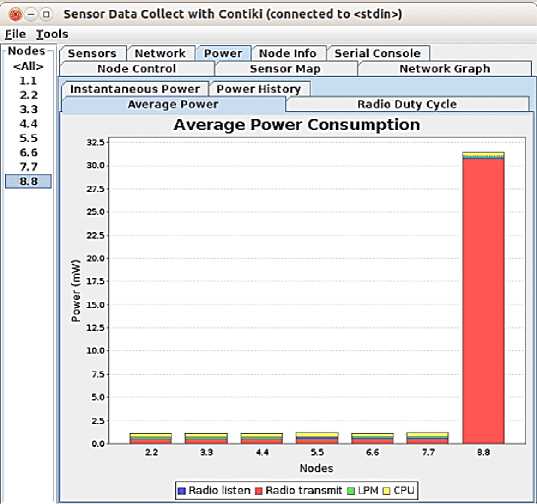
Fig.7. Power consumption in a DoS attack
Table 2. Comparison between the NS and MS nodes in a DoS attack
|
Scenarios |
Normal Scenario (NS) |
Malicious Scenario (MS) |
||
|
Message Type Clients ID |
UDP packets |
UDP packets |
||
|
Requests |
Received |
Requests |
Received |
|
|
ID:2 |
45 |
45 |
43 |
19 |
|
ID:3 |
44 |
43 |
44 |
44 |
|
ID:4 |
45 |
44 |
48 |
39 |
|
ID:5 |
45 |
45 |
58 |
41 |
|
ID:6 |
43 |
43 |
59 |
37 |
|
ID:7 |
44 |
43 |
51 |
43 |
|
ID:8 |
45 |
44 |
2704 |
1873 |
|
Total |
311 |
307 |
3007 |
2096 |
Table 3. Benchmark for increase and decrease between NS and MS in DoS
|
Scenarios |
NS |
MS |
NS |
MS |
NS |
MS |
|
Message type |
UDP packets Requests |
UDP packets Requests |
UDP packets Received |
UDP packets Received |
UDP packets drop |
UDP packets drop |
|
Total |
311 |
3007 |
307 |
2096 |
Four packets |
480 packets |
|
Increase /decrease |
Benchmark |
+ 866 % |
Benchmark |
+ 582 % |
0.64% |
18 % |
It consumes too much power if the radio is in a transmitting case.
-
B. BHA Attack Analysis
In RPL, various control messages are exchanged between the sender and sink nodes to form a topology. One important control message is a DODAG Information Object (DIO). The DODAG acronym for "Destination Oriented Directed Acyclic Graph" is the carrier of information regarding the RPL instance and its configurations. Increased DIO messages indicate network routing topology instability, whereas decreasing DIO messages indicate a stable network. Therefore, the parameters for evaluating the BHA attack are packet delivery fraction and rate of a specific control message known as the DIO message, as illustrated in Table 4, and the network's topology. These parameters are explicit about observing. The 6LoWPAN analyzer is used to capture the network traffic and inspect closely what is happening on the network. Table 4 shows the network analysis taken from Wireshark during the capture of the radio message in scenarios using a 6LoWPAN analyzer.
Table 5 compares the frequency of DIO messages released and UDP sent and received by each node between scenarios. Evaluating the rate and frequency of DIO messages issued by nodes, as well as the Packet Delivery Fraction in varying situations, it is clear that owing to malicious behavior brought by node 8, the rate and frequency of DIO messages published by nodes have increased. In the normal scenario, the network topology is regarded as stable, and the frequency of DIO messages reduces overall, but in the malicious scenario, the quantity of DIO messages increases overall due to all nodes experiencing an unstable network topology. In the normal scenario, the total number of DIO packages generated was 5159, but in the malicious scenario, this number expanded by 61 % up to 8326. Also, we noted that in the normal scenario, the total packet created was 397. However, in the malicious scenario, the total packet generated jumped by 162 %, up to 646. All nodes in the malicious scenarios except nodes 6 and 7 suffered a much higher delay than the normal scenario, and the reason behind the packet delay could be buffer queues. In the malicious scenario, nodes 6 and 7 generate higher UDP packets among nodes due to malicious activity introduced by node eight because it does not return the acknowledgment to the neighboring nodes. It drops all incoming packets but sends their packets until the acknowledgment is back to them. In the normal scenario, the number of packet deliveries at the sink was 392; in the malicious scenario, this number decreased by -57% and amounted to 166. While the sink node was creating and processing DIO packets and attempting to stabilize the network topology, packets may have been queued and waiting to be processed. The total number of packets received at the sink node is calculated in each case. The malicious scenario had a higher number of packets dropped by the malicious node; thus, a higher loss of 59%, as well as this rate, decreased in the normal scenario. Also, we noticed that the malicious node has only 1 UDP packet generated, and all nodes in a network are affected by the malicious activity, as we computed above. These nodes suffered the loss despite having idealistic conditions.
In black hole attacks, the malicious node and several nodes consume much power. For example, nodes 6 and 7 are very power-consuming, although they are normal nodes. Nevertheless, they are affected by a malicious node (Node 8) that drops packets without forwarding them to their destination (Node 1).
Generally, the malicious node and nodes 6 and 7 consume much power when the radio signal listens or transmits, as in Fig.8. We noted that nodes 6 and 7 consumed so much power due to the many packages that may be sent to form the topology and stability of the network. The malicious node consumes much power, and the rate of consumption power in listening radio signals is higher than in transmission radio signals because the dropped packages do not forward or transmit to their destination.
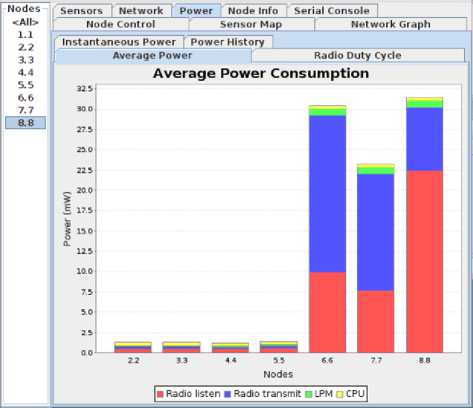
Fig.8. Power consumption in a BHA
Table 4. Comparison between the NS and MS nodes in BHA attack.
|
Scenarios |
Normal Scenario (NS) |
Malicious Scenario (MS) |
||||
|
Message Type Node ID |
DIO messages |
UDP packets |
DIO messages |
UDP packets |
||
|
Released |
Sent |
Received |
Released |
Sent |
Received |
|
|
ID:2 |
710 |
58 |
58 |
1044 |
47 |
40 |
|
ID:3 |
714 |
59 |
57 |
1044 |
49 |
44 |
|
ID:4 |
805 |
54 |
54 |
1073 |
49 |
41 |
|
ID:5 |
701 |
60 |
58 |
986 |
48 |
40 |
|
ID:6 |
742 |
53 |
53 |
1073 |
219 |
0 |
|
ID:7 |
783 |
54 |
53 |
1073 |
233 |
0 |
|
ID:8 |
704 |
59 |
59 |
1073 |
1 |
1 |
|
Total |
5159 |
397 |
392 |
8326 |
646 |
166 |
Table 5. Benchmark for increase and decrease between NS and MS in BHA
|
Scenarios |
NS |
MS |
NS |
MS |
NS |
MS |
NS |
MS |
|
Message type |
DIO Released |
DIO Released |
UDP packets Sent |
UDP packets Sent |
UDP packets Received |
UDP packets Received |
UDP packets drop |
UDP packets drop |
|
Total |
5159 |
8326 |
397 |
646 |
392 |
166 |
5 packets |
480 packets |
|
Increase /decrease |
Benchmark |
61% |
Benchmark |
62% |
Benchmark |
-57 % |
0.63% |
59% |
-
C. OOA Attack Analysis
In the OOA scenarios, the parameters under analysis are trusted packages, untrusted packages that were generated by malicious code, and the status of the radio, either ON or OFF. Table 6 details the features for evaluation. Table 7 shows the increases and decreases in values in the scenarios.
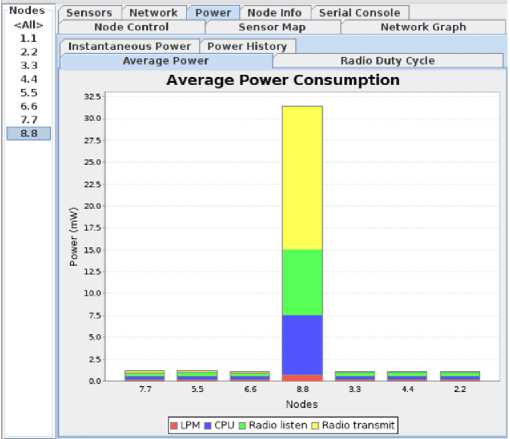
Fig.9. Power consumption in an OOA attack
Table 6. Comparison between the NS and MS nodes in an OOA attack
|
Scenarios |
Normal Scenario (NS) |
Malicious Scenario (MS) |
||||||||
|
Message Type Node ID |
UDP Sent |
Radio Average % |
UDP sent |
Radio Average % |
||||||
|
Trusted |
Untrusted |
ON |
TX |
RX |
Trusted |
Untrusted |
ON |
TX |
RX |
|
|
ID:1 |
0 |
0 |
1.22 |
0.11 |
0.94 |
0 |
0 |
100 |
1.28 |
10.08 |
|
ID:2 |
119 |
0 |
1.04 |
0.17 |
0.06 |
116 |
0 |
1.04 |
2.16 |
0.28 |
|
ID:3 |
112 |
0 |
1.04 |
0.17 |
0.07 |
111 |
0 |
1.04 |
1.13 |
0.40 |
|
ID:4 |
89 |
0 |
0.99 |
0.15 |
0.06 |
120 |
0 |
0.99 |
1.13 |
0.36 |
|
ID:5 |
117 |
0 |
0.98 |
0.13 |
0.04 |
113 |
0 |
0.98 |
2.17 |
0.44 |
|
ID:6 |
119 |
0 |
1.03 |
0.18 |
0.06 |
101 |
0 |
1.03 |
2.16 |
0.40 |
|
ID:7 |
120 |
0 |
1.53 |
0.55 |
0.03 |
119 |
0 |
1.53 |
1.02 |
0.29 |
|
ID:8 |
107 |
0 |
1.01 |
0.16 |
0.03 |
43 |
67 |
69.6 |
1.17 |
0.36 |
|
Total |
783 |
0 |
8.84 |
1.62 |
1.29 |
723 |
67 |
176.2 |
12.2 |
12.61 |
Table 7. Benchmark for increase and decrease between NS and MS in OOA
|
Scenarios |
NS |
MS |
NS |
MS |
NS |
MS |
NS |
MS |
NS |
MS |
|
Message type |
Trusted |
Trusted |
Untrusted |
Untrusted |
ON |
ON |
TX |
TX |
RX |
RX |
|
Total |
783 |
723 |
0 |
67 |
8.84 |
176.2 |
1.62 |
12.22 |
1.29 |
12.61 |
|
Increase /decrease |
Benchmark |
-7.6% |
Benchmark |
100% |
Benchmark |
1893% |
Benchmark |
654% |
Benchmark |
877.51% |
In a malicious scenario, the number of trusted packages decreases by -7.6 % while the number of untrusted packages increases to 100% because the normal network does not release any untrusted packages. In a malicious scenario, the number of radio averages in case the radio ON reaches 1893% due to the malicious node consuming the power, where the malicious node consumes 69% compared to peers at most 1.53 % as in node 5. This indicates that the malicious node either affects the features and characteristics of the tiny device or constantly updates and changes them. Because the analysis of the device's features makes it more reliable, and the analysis of the radio message makes it more secure.
The power consumption in OOA attacks is different from previous attacks. In OOA attacks, power is consumed when the radio transmits or listens to signals. Furthermore, the CPU consumes high power due to a change in status from ON to OF at an unusual period, as in Fig. 9. If the CPU consumes much power, it may increase the temperature of the device, which is considered a dangerous case because it may damage the device.
-
3.4. Collection and Extraction Data Phase
-
3.5. Attacks Detection and Prevention Phase
Due to the shortage of datasets in the 6LoWPAN devices in IoT. Therefore, the purpose of the implementation and analysis phases was to obtain and filter a proposed dataset to be able to use it in the proposed hybrid IDPS model for classification. According to the analysis phase, the parameter under evaluation or the features that were affected via attacks were radio messages and power consumption. The power consumption features are affected directly by any malicious activity. The malicious node consumes much power compared to peers. Therefore, we considered them as input for the proposed hybrid IDPS. The matrix of radio message variables changes and updates in each operation due to the harmful state. However, the power consumption and radio message were captured. To be utilized as input in the proposed system. as we saw in the previous section.
The proposed dataset is based on a simulation environment. Therefore, it includes 47680 records and 96 columns. These records were extracted from three attacks: BHA, DoS, and OOA. Within 45 minutes, 9912 records were captured from DoS. Also, 12696 records during one hour from BHA. In addition, 25072 records were captured from OOA over two hours. Eighty-four features were extracted from radio messages and 12 from power consumption features. The operation of capture was Concurrent. Therefore, the dataset is ready to fit in the proposed hybrid IDPS to classify the records according to their categories. Our proposed dataset will be available on as soon as possible.
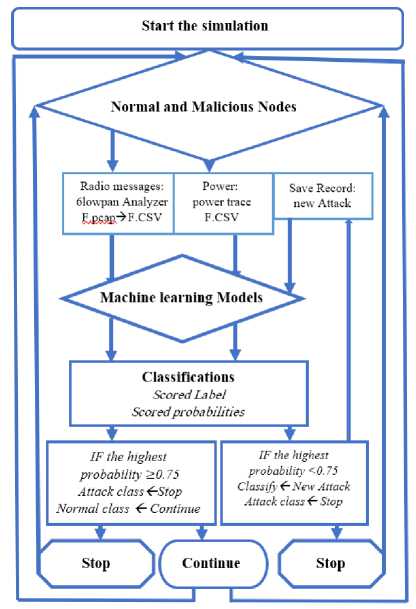
Fig.10. Proposed hybrid IDPS design
This section will investigate the proposed hybrid IDPS to detect and prevent attacks on 6LoWPAN in the IoT. The hybrid IDPS consists of two main functions: An Intrusion Detection System (IDS) to detect IoT attacks and an Intrusion Prevention System (IPS) to prevent them. Fig.10. shows the proposed Hybrid IDPS design and Fig.11. explains the proposed Hybrid IDPS implementation. Therefore, the proposed hybrid IDPS combines anomaly-based detection and rule-based prevention to detect and prevent attacks. In an IDS, dependencies are anomaly-based. Thus, this is mainly based on ML algorithms. An IPS depends on rule-based computing. Therefore, the IPS depends on anomaly-based results. So, the hybrid IDPS mixture of anomaly-based (IDS) and Rules-based (IPS). Our proposed hybrid IDPS includes several phases. The phase of simulating the attacks is the most difficult phase in which the attacks were carried out, and this phase is explained in detail in the implementation phase. Data pre-processing is an important phase through which we can select the features that will be trained and tested in the IDPS. In the proposed hybrid IDPS, all the dataset's features have been selected. This is for the good testing of the proposed hybrid IDPS to give the actual performance. Of course, we can choose a few features from the dataset, and the system's accuracy will increase. However, we preferred to select all the features because each attack affects certain ones so that hybrid IDPS can detect the largest possible number of attacks. Also, the missing data in the datasets are eliminated at this stage. Because some of the data generated by the simulation may not be clean, also at this point, the dataset was divided into a test set that represents 20% of samples, while the training samples represent 80%, to train and test the samples in hybrid IDPS. The experiment was implemented on the Azure Machine Learning Studio (AMLS) launched by Microsoft company, which provides the most function of ML and flexibility in dropping and dragging modules, as in Fig.11. illustrated in the Hybrid IDPS implementation., in addition to providing us with working on the Python and R languages to complete our work.
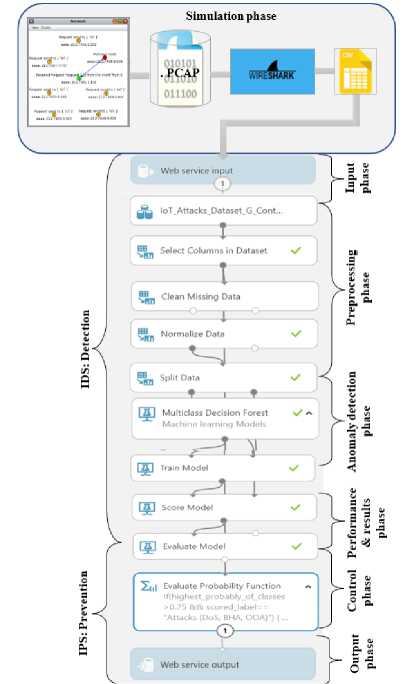
Fig.11. Proposed hybrid IDPS implementation
Several machine learning algorithms have been implemented to detect anomalies in the anomaly detection phase. Therefore, the proposed hybrid IDPS depends on machine-learning algorithms to identify the anomalies. The proposed algorithm for anomaly detection includes traditional ML and a modern algorithm from deep learning, which are DT, RF, Boosted Decision Tree (BDT), LR, KNN, ANN, SVM, Locally Deep Support Vector Machine (LDSVM), Average Perceptron (AP), and Bayes Point Machine (BPM). Traditional algorithms may have less computational time complexity than modern algorithms. Thus, if the accuracy is high, they may be preferable for small devices.
In the performance and results phase, the results of the matrix performance for each model will appear. Then, we filtered two important parameters in IDS (anomaly phase) to use them in IPS as input to control the 6LoWPAN attacks in IoT. These parameters are called "scored labels" and "scored probabilities." Based on the scored probabilities, The IPS decides to prevent and close the connections of malicious nodes. If the scored label with a probability greater than 0.75. The IPS controls the IoT devices and makes preventive decisions. The 0.75 number is the optimal number for our hybrid IDPS. Because if the threshold is greater than 0.75, it is difficult to detect many attacks. As well as if the threshold is less than 0.75. The hybrid IDPS will pass any attack. The remainder of this probability is 0.25, considered an error rate. The proposed hybrid IDPS provides input and output web service to test new samples of 6LoWPAN attacks and monitor them from anywhere and at any time. Through this service, we can connect to any simulator in which the attacks are carried out directly or any IoT device to detect the attacks. Furthermore, this new data will be saved in the dataset as a new label,
"Attack" or "Normal," to be used for training again in the hybrid IDPS and adaptive for new attacks.
-
3.6. Lightweight Models Phase
Most IoT devices are constrained in terms of (CPU, Power, and Memory). However, it is fundamental to seek a lightweight and optimal model for those devices. Modern ML algorithms may achieve impressive results in classifying attacks but at the expense of increased computational complexity, which makes them unsuitable for tiny devices. Therefore, we investigated to find lightweight and optimal models for the ML model based on time complexity. We compared the time complexity and accuracy of the most popular ML algorithms demonstrated in Table 8. Therefore, we need to calculate the time complexity for ML algorithms to find the lightweight model. In time complexity, we tried to find the worst case. The worst-case scenario is the best case for evaluating the algorithms or models. Results will be close to the actual performance. The optimal model is the model that achieves high accuracy in the worst case. The higher the degree of time complexity and the closer the model is to the exponential, the heavier the model needs more processing and consumes hardware resources. The devices may not be able to process data and need a device with large processing capabilities. If the computational complexity is low and close to constant, the model is light in weight, requires less processing, and does not consume hardware resources. We used a worst-case time complexity calculation through which we can evaluate ML algorithms and models. We neglected to calculate the time complexity of the best case through which the optimal solution can be reached quickly, and this does not give us the actual evaluation and results in all cases. We utilized the features of the KoÜ-6LoWPAN-IoT dataset that was generated by the Contiki OS, which contains 96 properties and 47680 observations. We can use another dataset to perform the mathematical calculations on time complexity, but overall, the results of the best algorithms and optimal models will be similar. The formulas were extracted from [50-52]. Time complexity determines the lightweight model, while accuracy determines the optimal model. In Table 8 the time complexity for training models for RF, DT, and BDT are 2.7863 s, 0.055727 s, and 2.7863 s, respectively.
-
3.7. Deployment Strategy Phase
Table 8. Computational complexity for the top ML algorithms with accuracy n=Number of training samples (38142), n#= Number of testing samples (9535), M= number of features (96), T= number of trees (50), D=depth of tree (96), L=layers (3), S= number of support vectors (4), K= number of neighbours (4), N=neurons (100)
|
ML algorithms |
Computa tional Complexity |
Accuracy |
Dataset |
Our Accuracy |
|||
|
Train Time Complexity(ns) |
Test Time Complexity(ns) |
Space Complexity (Kbit) |
Edge IIoT with 15-class |
6LoWPAN-IoT with 4-class |
|||
|
RF |
O(T*nLog(n)*M) |
O(M*T) |
O(T*D) |
0.99 [40] |
DS2OS |
90.91% |
99.11% |
|
0.99 [47] |
IoT-23 |
||||||
|
0.95 [42] |
Bot-IoT |
||||||
|
0.989 [2] |
KoU-6LoWPAN-IoT |
||||||
|
1 [53] |
IoT_botnet |
||||||
|
1 [46] |
UNSW-NB15 |
||||||
|
DT |
O(nLog(n)*M) |
O(M) |
O(D) |
0.96 [42] |
Bot-IoT |
74.07% |
93.75% |
|
0.96 [47] |
IoT-23 |
||||||
|
0.99 [40] |
DS2OS |
||||||
|
0.87 [2] |
KoU-6LoWPAN-IoT |
||||||
|
0.98 [44] |
NSL-KDD |
||||||
|
BDT |
O (T* nLog(n)*M) |
O(M*T) |
O(T*D) |
0.80 [2] |
KoU-6LoWPAN-IoT |
85.11% |
92.86% |
|
KNN |
O(K*n2*M) |
O(n#*M) |
O(n*M) |
0.99 [42] |
Bot-IoT |
83.33% |
92.98% |
|
1 [46] |
UNSW-NB15 |
||||||
|
0.96 [44] |
NSL-KDD |
||||||
|
SVM |
O(n3) |
O(S*M) |
O(n*M) |
0.98 [40] |
DS2OS |
80.00% |
97.37% |
|
0.79 [42] |
Bot-IoT |
||||||
|
0.99 [53] |
IoT_botnet |
||||||
|
0.99 [47] |
IoT-23 |
||||||
|
ANN |
O(n4) |
O(L*M*N) |
O(n) |
0.99 [40] |
DS2OS |
Edge IIoT with 15-class: 97.64% |
6LoWPAN-IoT with 4-class: 99.84% |
|
0.74 [42] |
Bot-IoT |
||||||
|
0.956 [54] |
NSL-KDDCUP99 |
Edge IIoT with 2-class: 99.94% |
6LoWPAN-IoT with 2-class: 99.97 % |
||||
This indicates that the time complexity for training these algorithms is very small in seconds compared to others. The others models' order is based on their time complexity which is KKN, SVM algorithms, and ANN respectively. Therefore, the time complexity for training models of Decision Tree Based has time complexity less than KNN, SVM, and ANN. The decision tree based includes RF, DT, and BDT, which has the structure of a tree and takes its decisions based on the output of the tree. Therefore, the decision tree-based models are more lightweight than KNN, SVM, and ANN. Also, the time complexity for testing models of the decision tree is a very lightweight model, which is 0.096 µs, and this means the shortest time between models compared to the KNN model, which is a very heavyweight model, which is 0.915 ms, which is the longest time between models. We noted that the DT occupies a space in memory up to 12 KB, the lowest value among the other models, followed by RF and BDT, occupying a space of 600 KB for both models. Therefore, the decision tree-based models (DT, RF, and BDT) are more lightweight than KNN, SVM, and ANN and occupy less space. Accuracy is the achievement of the optimal model. The accuracy was extracted from many previous studies on a different dataset. Therefore, we considered the results above 90 as achieving the optimal accuracy models, while the results ranging from 80 to 90 represent the moderate model's achievement. Otherwise, they are low models. Hence, most models' accuracy results range from high to moderate.
Generally, the decision tree-based algorithm has less computational complexity, and the model's accuracy ranges between high and moderate and they may be preferable for tiny devices. Therefore, this type of model achieves lightweight and optimal models, while other models in Table 8 have more computational complexity, and the accuracy ranges between high and moderate. Therefore, this type of model achieves heavyweight models and optimal models. However, finding lightweight and heavyweight models identifies deploying models that will detect attacks, which may be in cloud or fog, or edge computing.
In this section, we investigated to propose the models' deployment in the IoT ecosystem network. The models used to detect IoT attacks may be in the cloud, fog, or edge computing. Cloud computing is the most popular method of analytics and processing IoT data. Fog and edge computing have also been widely employed to speed up and improve data processing and bring intelligence closer to IoT devices that produce data and act on it. Cloud computing can process and store massive amounts of data. Hence, if the model is deployed in cloud computing, we can employ any ML model that achieves higher accuracy to analyze and detect the attacks in the IoT regardless of the time complexity and lightweight model. Unlike edge computing, it is necessary to consider the time complexity and lightweight model as well as an optimal model with the best accuracy due to device constraints. Hence, edge computing offers attractive features where the latency for the model is very low, and the privacy is very high, unlike cloud computing which a third-party monitor. The challenge for edge computing is to find a lightweight and optimal model. Table 9 illustrates edge, fog, and cloud computing features. Based on Table 8, the decision tree-based model requires less computational complexity, and its accuracy is high. Therefore, the decision tree-based model space will be suitable for edge computing, unlike models that require more computational complexity, like ANN and SVM. The model will be suitable for cloud computing or fog computing. It doesn't matter if resources are consumed. Any ML model implemented in edge computing can be implemented in fog and cloud computing, but the opposite is not always true because the edge requires a lightweight model that does not consume device resources. In the IoT security context, we tend and prefer to process the data internally on edge as much as possible, especially in the security of the IoT, to avoid disclosure of data privacy by a third party.
Table 9. The characteristics offered via edge, fog, and cloud
|
ML-Models Deployment |
Data Analysis |
Access Approaches |
Latency |
InternetBased |
Privacy |
|
Edge |
Process the data and decide in real-time (at the edge) |
TinyML or lightweight Model (Internal processing) |
Low |
No |
High |
|
Fog |
The fog is an intermediate layer between the cloud and the edge. It decides to process the data locally or send it to the cloud (network close to the edge). |
Nodes send Encrypted data to fog computing (External processing) |
Medium |
Yes |
Moderate |
|
Cloud |
less time-sensitive data processing (away from the edge) |
Nodes send Encrypted data to cloud computing (External processing) |
High |
Yes |
Low |
4. Evaluation Metrics of the Proposed Hybrid IDPS Mechanism
The proposed system tested and evaluated in several scenarios. First, it was tested on our proposed dataset. the proposed system tested before and after optimizing the accuracy with 4-class and 2-class modes. 4-class means the dependent variable output contains four labels for classification, such as " BHA, DoS, OOA, and normal". As well as 2-class, the dataset contains two labels for classification: "Normal" and "Malicious." The same scenario was applied to the Edge IoT dataset with 15-class and 2-class modes. The models tested on the default setting before improving the accuracy. Also, after optimizing the accuracy, the model's configuration changed to improve the accuracy of classification models.
-
4.1. Scenario 1: Evaluation Metrics Before the Accuracy Models are Optimized
-
A. KoU-6LoWPAN-IoT Dataset with 4-class
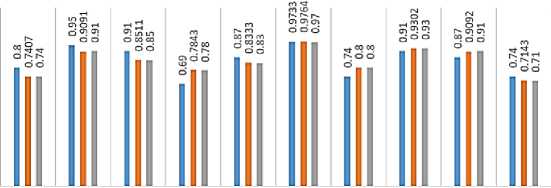
The proposed KoU-6LoWPAN-IoT dataset depends on the simulation ecosystem generated via the Contiki OS. This dataset includes data from 6LoWPAN devices in the IoT. The total number of attacks in the 6LoWPAN attacks dataset is three, which are BHA, OOA, and DoS attacks. The proposed dataset for anomaly detection phase includes 47680 records and 96 features. In this experiment, the dataset was split into 80% for training which is 38142 records, and 20 % for testing, which is 9535 records. In this section, the proposed KoU-6LoWPAN-IoT dataset is tested on 4-classes which are BHA, DoS, OOA, and Normal. The proposed hybrid IDSP has been tested in the detection phase on most of the traditional ML and modern deep learning algorithms, which are DT, RF, BDT, LR, KNN, ANN, SVM, LDSVM, AP, and BPM, as shown in Fig.12. These algorithms have been tested on the default configuration proposed via Microsoft in the Azure machine-learning platform as illustrated in Table 13. Performance parameters extracted from each model: Recall, Accuracy, and F1 Score, as drawn in Fig 12. Therefore, the ANN achieved the highest accuracy among the models, which is 95.65 %, followed by SVM, LDSVM, AP, BPM, RF, KNN, DT, BDT, and LR, which are 93.53%, 92.86%, 92.2%, 90.07%,89.92%, 89.36%, 86.23%, 84.78%, and 83.69% respectively. Table 10. displays the Confusion Matrix (CM) of the highest accuracy we obtained from ANN with the 4-classification mode, while Table 11. presents the highest accuracy of ANN in the 2-classification mode.
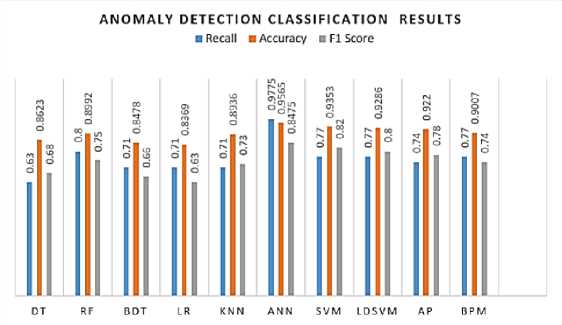
Fig.12. Results in the KoÜ-6LoWPAN-dataset with 4-class
-
B. KoU-6LoWPAN-IoT Dataset with 2-class
The accuracy of classes in the KoU-6LoWPAN dataset with 2-class classification was 99.95%, while precision and recall were 99.96% and 99.98%, respectively. Therefore, the results in 4 classes and 2 classes are different, although the used dataset is the same. Therefore, when the number of classes or labels increases, the accuracy of the models will decrease, and vice versa. So, this is one of the techniques used to improve the accuracy of models. In KoU-6LoWPANdataset with 4-class, the overall accuracy of classes was 95.64% while the average accuracy was 95.65%. Also, the average precision for classes achieved 84.75%, while the average recall for classes was 97.75%. Therefore, the performance of the detection model in terms of accuracy, recall, and F-score accuracy with ANN in the 2-classification mode is better than ANN in the 4-classification mode. Therefore, the fewer the classes, the higher the accuracy. For example, the highest accuracy was ANN in both modes:4-class and 2-class, which was 95.64% and 99.95%, respectively. The rate of increase in ANN with 4-class and 2-class is the difference between them which is 4.31 %.
Table 10. CM of ANN in the KoU-6LoWPAN-IoT dataset with 4-class
|
(Test samples) N=9535 |
Predicted Class |
||||
|
BHA |
DoS |
Normal |
OOA |
||
|
Actual Class |
BHA |
279 |
5 |
105 |
0 |
|
DoS |
1 |
479 |
119 |
3 |
|
|
Normal |
4 |
0 |
7193 |
0 |
|
|
OOA |
5 |
0 |
173 |
1169 |
|
Table 11. CM of ANN with 2-class in the KoU-6LoWPAN-IoT dataset
|
N=9535 |
Predicted Class |
||
|
Actual Class |
Class Label |
Normal |
Malicious |
|
Normal |
TP=7587 |
FN=1 |
|
|
Malicious |
FP =3 |
TN=1944 |
|
-
C. Edge IIoT Dataset with 15-class
The Edge-IIoT is a realistic testbed dataset in IoT attacks based on real environments (Hardware and Software). It is a heterogeneous dataset extracted from different IoT devices. This dataset is the most recent in 2022, proposed by
Mohamed Ferraget et al., reflecting heterogeneous IoT features. This dataset contains five categories. Each category contains a set of attack records. The total number of attacks in this group is 14 attacks that were generated on different layers and devices in the IoT. The attacks are Back Door, DDoS-HTTP, DDoS-ICMP, DDoS-TCP, DDoS-UDP, FingerPrinting, MITM, Password, Scanning, Ransomware, Injection, Uploading, Scanner, and XSS attack. The proposed dataset for ML algorithms includes 157801 records and 61 features. In this experiment, the Edge-IIoT dataset was split into 80% for training which is 126240 records, and 20 % for testing, which is 31561 records. Fig. 13. shows the accuracy of detection classification model. Of course, the ANN classification achieves high accuracy compared to peers, which were 95.14%, while other model classifications in order LDSVM, AP, RF, BDT, KNN, SVM, LR, DT, and BPM which are achieved 93.02 %, 88.89 %, 83.33%,81.63%, 80.00%, 78.43%,78.43 %,67.8%, and 65.57 % respectively. We compared the overall accuracy of the classification model tested in the 6LoWPAN dataset, as in Fig.12. with the overall accuracy of the classification model tested in the Edge IoT dataset, as in Fig 13. The accuracy of datasets based on the simulator is higher than that of real hardware and software. The confusion matrix indexes for ANN, which was the highest illustrated in Fig.14. In the edge IIoT dataset with 15 classes, the overall accuracy of classes was 95.14%, while the average accuracy was 99.43%. Also, the average precision for classes was 95.86%, while the average recall for classes was 95.96%.
ANOMALY DETECTION CLASSIFICATION RESULTS
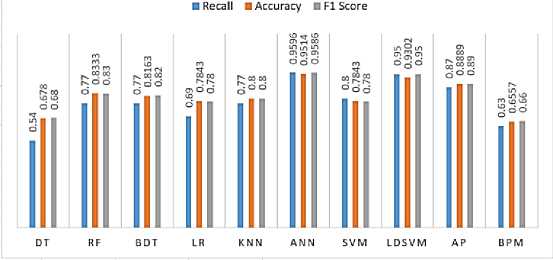
Fig.13. Results in the edge IIoT dataset with 15-class
-
D. Edge IIoT Dataset with 2-class
-
4.2. Scenario 2: Evaluation Metrics After the Accuracy Models are Optimized
The results in the 15 and 2 classes are different in the Edge IoT dataset. Therefore, when the number of classes or labels decreases, the accuracy of the models will increase, and vice versa. So, this is one of the techniques used to improve the accuracy of models by decreasing the number of classes as much as possible. Therefore, the performance of the detection model in terms of accuracy, Recall, and F- score accuracy of ANN in the 2-classification mode is better than the ANN classifier with the 15-classification. Table 12. shown the CM of ANN in the edge IIoT set with 2-class. Therefore, the accuracy of classes in the Edge IIoT dataset with 2-class classification was 99.86 %, while precision and recall were 99.25% and 99.39 %, respectively. Therefore, the fewer the classes, the higher the accuracy.
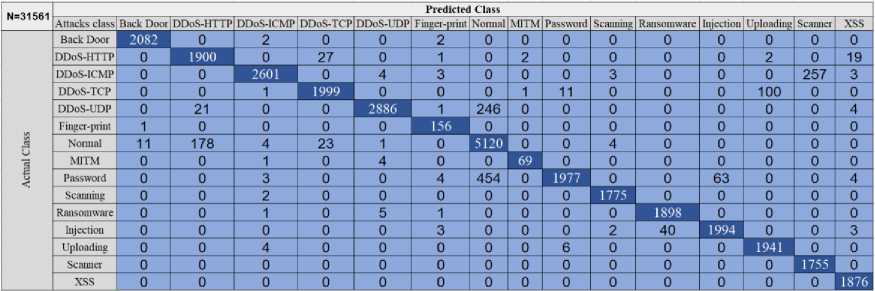
Fig.14. CM of ANN in the edge IIoT dataset with 15-class
Table 12. CM of ANN in the edge IIoT dataset with 2-class
|
N=31561 |
Predicted Class |
||
|
Actual C. |
Class Label |
Normal |
Malicious |
|
Normal |
TP=2799 |
FN=17 |
|
|
Malicious |
FP=21 |
TN=25724 |
|
In this section, we tested the datasets after we optimized the accuracy with N-class and 2-class modes. As we concluded in the previous section, one technique to improve the accuracy is by decreasing the classification model into two classes, "Normal" and "attack " Reduction is made by Labeling all attacks into one class called either "Attack" or "Malicious", and another class is ''Normal". As we have seen previously, our models have been tested on N-class with 2-class. Another technique to improve the accuracy is increasing the configuration of a classification model. Table 13. shows the default model classification configurations and improved model classification configurations.
Table 13. Configuration of anomaly detection classification for IDPS
|
ML classification models |
Default configuration of classification Models |
Optimized configuration of the classification Model |
|
RF |
Resampling method= Bagging; Create trainer mode=Single parameter; Number of decision trees=63; Maximum depth of the decision trees=100; Number of random splits per node=128; Minimum number of samples per leaf node=3; |
Resampling method= Bagging; Create trainer mode=Single parameter; Number of decision trees=100; Maximum depth of the decision trees=200; Number of random splits per node=132; Minimum number of samples per leaf node=2; |
|
BDT |
Create trainer mode= Single parameter; Maximum number of leaves per tree=20; Minimum number of samples per leaf node=6; Learning rate=0.2; Number of trees constructed=62; Random number seed=0; |
Create trainer mode= Single parameter; Maximum number of leaves per tree=20; Minimum number of samples per leaf node=6; Learning rate=0.02; Number of trees constructed=100; Random number seed=123; |
|
DT |
Resampling method= Bagging; Create trainer mode= Single parameter; Number of decisions DAGs= 20; Maximum depth of the decision DAGs=32; Maximum width of the decision DAGs= 128; Number of optimization steps per decision DAG layer=2048; |
Resampling method= Bagging; Create trainer mode= Single parameter; Number of decisions DAGs= 50; Maximum depth of the decision DAGs=100; Maximum width of the decision DAGs= 1208; Number of optimization steps per decision DAG layer=2998; |
|
LR |
Create trainer mode= Single parameter; Optimization tolerance=1E-07; L1 regularization weight=1; L2 =1; Memory size for L-BFGS=20; Random number seed=128; |
Create trainer mode= Single parameter; Optimization tolerance=1E-09; L1 regularization weight=0.01; L2 =0.1; Memory size for L-BFGS=20; Random number seed=132; |
|
KNN |
K=4 |
K=8 |
|
ANN |
Create trainer mode= Single parameter; Hidden layer specification= Fully-connected case; Number of hidden nodes=100; learning rate=0.1; Number of learning iterations=100; The initial learning weights diameter=0.1; The type of normalizer= Min-Max normalizer |
Create trainer mode= Single parameter; Hidden layer specification= Fully-connected case; Number of hidden nodes=300; learning rate=0.01; Number of learning iterations=300; The initial learning weights diameter=0.01; The type of normalizer= Min-Max normalizer |
|
SVM |
Create trainer mode= Single parameter; Number of iterations=10; Lambda=0.01. |
Create trainer mode= Single parameter; Number of iterations=30; Lambda=0.001. |
|
LDSVM |
Create trainer mode= Single parameter; Depth of the tree=50; Lambda W=0.1; Lambda Theta=0.01; Sigmoid sharpness=1; Number of iterations=70000; Feature normalizer= Min-Max normalizer. |
Create trainer mode= Single parameter; Depth of the tree=100; Lambda W=0.01; Lambda Theta=0.01; Sigmoid sharpness=1; Number of iterations=15000; Feature normalizer= Min-Max normalizer |
|
AP |
Create trainer mode= Single parameter; Learning rate=1; Maximum number of iterations=50; |
Create trainer mode= Single parameter; Learning rate=0.01; Maximum number of iterations=200; |
|
BPM |
Number of training iterations=100 |
Number of training iterations=400 |
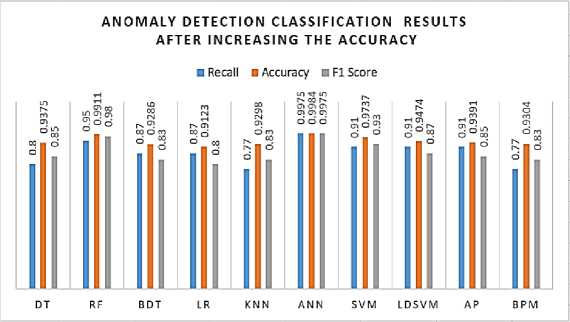
Fig.15. Results in the KoÜ-6LoWPAN-dataset with 4-class
-
A. KoU-6LoWPAN-IoT Dataset with 4-class
In this section, we demonstrated the performance of the classification model after we improved the accuracy by increasing the configuration of classification models. Generally, if we compared with the accuracy of results before and after improved as in Fig. 12 and Fig. 15 in 6LoWPAN dataset. We observed the results after improvement was increased.
The amount of increase is the difference between them which are 4.19%, 9.19%, 3.84%, 1.88%, 1.71%, 7.52%, 2.97%, 3.62%, 8.08%, and 8.14% for ANN, RF, SVM, LIBSVM, AP, DT, BPM, KNN, BDT, and LR respectively as illustrated in Fig 16. Table 14 shows the confusion matrix for the highest accuracy classification after the improvement of which KNN classifier. In the KoU-6LoWPAN dataset with 4-class after optimization, the overall accuracy of classes reached 99.91% while the average accuracy amounted to 99.84%. Also, the average precision for classes achieved 99.5%, while the average recall for classes was up to 99.75%.
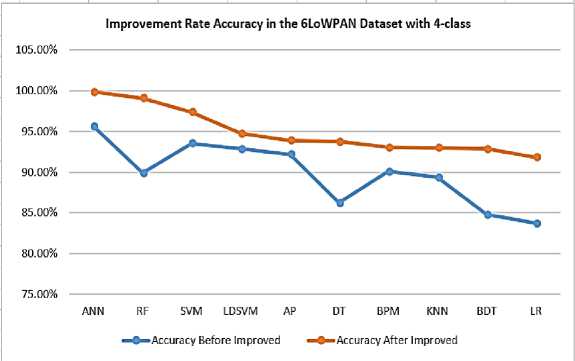
Fig.16. Improvement rate in the 6LoWPAN-IoT dataset with 4-class
Table 14. CM of ANN in the KoU-6LoWPAN-IoT dataset with 4-class
|
(Test samples) N=9535 |
Predicted Class |
||||
|
BHA |
DoS |
Normal |
OOA |
||
|
Actual Class |
BHA |
286 |
1 |
1 |
0 |
|
DoS |
1 |
483 |
1 |
1 |
|
|
Normal |
1 |
0 |
7587 |
0 |
|
|
OOA |
1 |
0 |
1 |
1171 |
|
B. KoU-6LoWPAN-IoT Dataset with 2-class
Table 15 shows the confusion matrix with 2-class mode after improvement. In the 6LoWPAN dataset with 4- and 2-classification modes, the KNN classifier accuracy is the highest among models. Therefore, the ANN accuracy is compared before and after the accuracy improved in both 4- and 2- classifications, as shown in Fig 18. we observed the accuracy of ANN with 4- the classification mode before the accuracy improved was 95.65%. This number increased to reach 99.84% after the accuracy was optimized. As well as the accuracy of ANN in 2- classification mode before the accuracy improved was 99.95%. This number increased amount up 99.97% after the accuracy was optimized. After optimized, the accuracy of classes in the KoU-6LoWPAN dataset with 2-class classification reached 99.97 %, while precision and recall amounted to 99.98% and 99.98 %, respectively. In this section, we illustrated the performance of the classification model after we improved the accuracy with 15-class modes in the Edge-IoT set dataset. The classification model settings were improved to increase the accuracy. Fig. 17 shows the results of classification models after optimization.
Table 15. CM of ANN in the KoU-6LoWPAN-IoT dataset with 2-class
|
N=9535 |
Predicted Class |
||
|
Actual Class |
Class Label |
Normal |
Malicious |
|
Normal |
TP=7589 |
FN=1 |
|
|
Malicious |
FP=1 |
TN=1944 |
|
-
C. Edge IIoT Dataset with 15-class
The ANN classifier, after improvement, achieves higher accuracy than other classification models which 97.64 %, followed by LDSVM, AP, RF, BDT, KNN, SVM LR, DT, and BPM, and which are 93.02%, 90.92%, 90.91%, 85.11%, 83.3%, 80.00%, 78.43%, 74.07%, and 71.43%, respectively as in Fig. 17. Generally, if we compared the results before and after improvement as in Fig. 13 and Fig. 17. In the Edge IIoT dataset with 15-class mode, we observed the results after improvement is increased. The amount of increase is the difference between them which are 2.50%, 7.58%, 1.57%, 0.00%, 2.03%, 6.27%, 5.86%, 3.33%,3.48%, and 0.00% for ANN, RF, SVM, LIBSVM, AP, DT, BPM, KNN, BDT, and LR respectively as illustrated in Fig. 19. In the Edge IIoT dataset with 15-class mode, the KNN classifier achieved the highest accuracy among models which is 97.64%. Therefore, the confusion matrix for the KNN classifier is illustrated in
Fig 20. In the edge IIoT dataset with 15 classes, the overall accuracy of classes was 97.64%, while the average accuracy was 99.68%. Also, the average precision for classes was 97.8%, while the average recall for classes was 97.33%.
ANOMALY DETECTION CLASSIFICATION RESULTS AFTER INCREASING THE ACCURACY
□ Recall ■ Accuracy □ Fl Score
DT RF BDT LR KNN ANN SVM LDSVM AP BPM
Fig.17. Edge IIoT dataset with 15-class
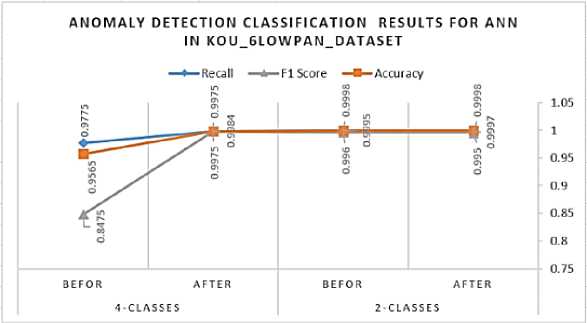
Fig.18. Results of ANN classifier in the 6LoWPAN-IoT dataset with 4-class and 2-class
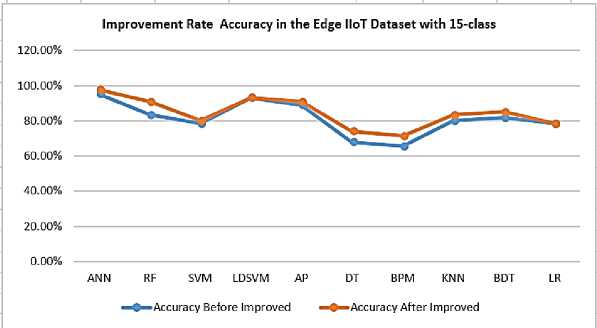
Fig.19. Improvement rate in the Edge IIoT dataset with 15-class
-
D. Edge IIoT Dataset with 2-class
In the Edge IIoT dataset with 15- and 2- classification modes, the KNN classifier accuracy is the highest among models. Therefore, the ANN accuracy is compared before and after the accuracy improved in both 15- and 2-classifications, as shown in Fig.21. we observed the accuracy of ANN in 15- the classification mode before the accuracy improved was 95.14%. This number increased to reach 97.64% after the accuracy was improved. As well as the accuracy of ANN in 2- classification mode before the accuracy improved was 99.86%. This number increased amount up 99.94% after the accuracy was improved. The confusion matrix for the KNN classifier in Edge-IIoT set with 2-class is illustrated in Table 16. The accuracy of classes in the Edge IIoT dataset with 2-class classification was 99.94 %, while precision and recall were 99.60% and 99.82 %, respectively.
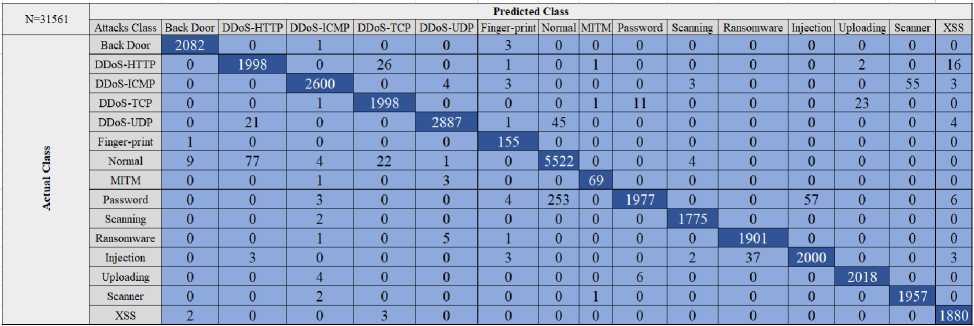
Fig.20. CM of ANN in the edge IIoT dataset with 15-class
As a summary for this section, several optimization approaches can be used to improve the accuracy of classification models. It may be possible to reduce the number of samples or features in the datasets to improve the accuracy of the models, but this doesn't give accurate results for prediction models for new instances. In addition, the number of features in the dataset may be reduced, but this may reduce the ability of the model to detect the largest possible number of attacks because the features of the attacks change from one attack to another. The greater the number of features, the greater the models' ability to detect the largest possible number of attacks, but at the expense of an overall decrease in the accuracy of the models. Also, the accuracy of the models may be better if a simulator generates them due to the consistency of the dataset. While it is less if the data is generated in a real environment and this is closer to realistic results. Moreover, the lower the number of "classes" in the dataset, the lower the accuracy, and vice versa.
Table 16. Edge IIoT dataset with 2-class
|
N=31561 |
Predicted Class |
||
|
Actual Class |
Class Label |
Normal |
Malicious |
|
Normal |
TP=2809 |
FN=5 |
|
|
Malicious |
FP=11 |
TN=25736 |
|
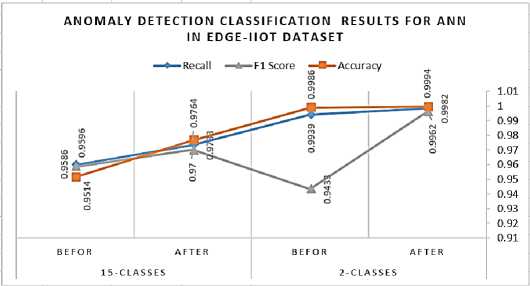
Fig.21. Results of ANN classifier in the Edge IIoT dataset with 15-class and 2-class
The models’ configuration also has a fundamental role in optimizing classification models, but not always. This may lead to negative results in the classification. Also, it may lead to the greater computational complexity of the models, and this is what we want to avoid, especially in light of restricted and limited devices.
5. Conclusions
This work proposes a hybrid IDPS to detect and prevent 6LoWPAN attacks in the IoT ecosystem. Therefore, three different 6LoWPAN attacks have been implemented in the IoT via the Cooja simulator, which generated the proposed dataset based on 6LoWPAN features (the KoU-6LoWPAN-IoT dataset). In the analyzed attacks phase, six scenarios have been implemented. Three of these have been free of malicious nodes; the other scenarios include malicious nodes. The normal scenarios have been a benchmark for the malicious scenarios for comparison, understanding, extraction, and exploration of the features that are affected by attackers and utilized as criteria input for our proposed IDPS or may for any ML models. The hybrid IDPS has been tested and evaluated in the detection phase on various machine-learning classifiers with and without optimization. The IDPS experimental have been implemented via AMLS to display the results in a visual and ideal manner. Also, the proposed hybrid IDPS has been tested on KoU-6LoWPAN-IoT and edge-IIoT datasets. In the classification phase, the ANN classifier achieved the highest accuracy among the models with both 2-class and N-class modes. In the proposed dataset with the 4-class and 2-class modes, the ANN classifier achieved 95.65% and 99.95%, while the accuracy was optimized and reached 99.84% and 99.97%, respectively. In the Edge IIoT dataset, before the accuracy was optimized with the 15-class and 2-class modes, the ANN classifier achieved 95.14% and 99.86%, while after the accuracy was optimized, it reached 97.64% and 99.94%, respectively. The results of the classifiers with optimization have been better, but it may increase the computational complexity of classification models in light of constrained devices. Also, the results of algorithms that require higher computational complexity have been better. Furthermore, the decision tree-based models have been lightweight due to their lower computational complexity as well as response time for training and testing via AMLS. Therefore, these models are appropriate for deployment in edge computing. While other ML models have been heavyweights and have required more computational complexity, these models have an appropriate deployment in cloud or fog computing in the IoT due to their ability for processing massive data.
References Machine Learning-based Intrusion Detection Technique for IoT: Simulation with Cooja
- I. Lee and K. Lee, “The Internet of Things (IoT): Applications, investments, and challenges for enterprises,” Bus. Horiz., vol. 58, no. 4, pp. 431–440, 2015, doi: 10.1016/j.bushor.2015.03.008.
- A. H. Farea and K. Küçük, “Detections of IoT Attacks via Machine Learning-Based Approaches with Cooja,” EAI Endorsed Trans. Internet Things, vol. 7, no. 28, pp. 1–12, 2022, doi: 10.4108/eetiot.v7i28.324.
- A. Gerodimos, L. Maglaras, M.A. Ferrag, N. Ayres, and I. Kantzavelou, "IoT: Communication protocols and security threats," Internet of Things and Cyber–Physical Systems, vol. 27, pp. 172–178, 2023. doi: 10.1016/j.iotcps.2022.12.003.
- D.-M. Ngo et al., “HH-NIDS: Heterogeneous Hardware-Based Network Intrusion Detection Framework for IoT Security,” Future Internet, vol. 15, no. 1, p. 9, Dec. 2022, doi: 10.3390/fi15010009.
- M. S. Mekala and P. Viswanathan, “A Survey: Smart agriculture IoT with cloud computing,” 2017 Int. Conf. Microelectron. Devices, Circuits Syst. ICMDCS 2017, vol. 2017-Janua, no. August 2017, pp. 1–7, 2017, doi: 10.1109/ICMDCS.2017.8211551.
- A. A. Laghari, K. Wu, R. A. Laghari, M. Ali, and A. A. Khan, “A Review and State of Art of Internet of Things (IoT),” Arch. Comput. Methods Eng., vol. 29, no. 3, pp. 1395–1413, 2022, doi: 10.1007/s11831-021-09622-6.
- F. T. Johnsen et al., “Application of IoT in military operations in a smart city,” 2018 Int. Conf. Mil. Commun. Inf. Syst. ICMCIS 2018, no. December, pp. 1–8, 2018, doi: 10.1109/ICMCIS.2018.8398690.
- G. Glissa and A. Meddeb, “6LowPSec: An end-to-end security protocol for 6LoWPAN,” Ad Hoc Networks, vol. 82, pp. 100–112, 2019, doi: 10.1016/j.adhoc.2018.01.013.
- J. Lu, D. Li, P. Wang, F. Zheng, and M. Wang, “Security-Aware Routing Protocol Based on Artificial Neural Network Algorithm and 6LoWPAN in the Internet of Things,” Wirel. Commun. Mob. Comput., vol. 2022, doi: 10.1155/2022/8374473.
- A. Verma and V. Ranga, “Security of RPL Based 6LoWPAN Networks in the Internet of Things: A Review,” IEEE Sens. J., vol. 20, no. 11, pp. 5666–5690, 2020, doi: 10.1109/JSEN.2020.2973677.
- S. Alyami, R. Alharbi, and F. Azzedin, “Fragmentation Attacks and Countermeasures on 6LoWPAN Internet of Things Networks: Survey and Simulation,” Sensors, vol. 22, no. 24, p. 9825, Dec. 2022, doi: 10.3390/s22249825.
- C. Miranda, G. Kaddoum, A. Boukhtouta, T. Madi, and H. A. Alameddine, “Intrusion Prevention Scheme Against Rank Attacks for Software-Defined Low Power IoT Networks,” IEEE Access, vol. 10, no. December, pp. 129970–129984, 2022, doi: 10.1109/ACCESS.2022.3228170.
- A. M. Pasikhani, J. A. Clark, P. Gope, and A. Alshahrani, “Intrusion Detection Systems in RPL-Based 6LoWPAN: A Systematic Literature Review,” IEEE Sens. J., vol. 21, no. 11, pp. 12940–12968, 2021, doi: 10.1109/JSEN.2021.3068240.
- T. A. Al-Amiedy, M. Anbar, B. Belaton, A. H. H. Kabla, I. H. Hasbullah, and Z. R. Alashhab, “A Systematic Literature Review on Machine and Deep Learning Approaches for Detecting Attacks in RPL-Based 6LoWPAN of Internet of Things,” Sensors, vol. 22, no. 9, 2022, doi: 10.3390/s22093400.
- A. Alsaedi, N. Moustafa, Z. Tari, A. Mahmood, and Adna N Anwar, “TON-IoT telemetry dataset: A new generation dataset of IoT and IIoT for data-driven intrusion detection systems,” IEEE Access, vol. 8, pp. 165130–165150, 2020, doi: 10.1109/ACCESS.2020.3022862.
- S. M. Tahsien, H. Karimipour, and P. Spachos, “Machine learning based solutions for security of Internet of Things (IoT): A survey,” J. Netw. Comput. Appl., vol. 161, no. March, 2020, doi: 10.1016/j.jnca.2020.102630.
- R. Sikarwar, P. Yadav, and A. Dubey, “9 th IEEE International Conference on Communication Systems and Network Technologies A Survey on IOT enabled cloud platforms,” pp. 120–124, 2020, doi: 10.1109/CSNT.2020.23.
- L. Minh Dang, M. J. Piran, D. Han, K. Min, and H. Moon, “A survey on internet of things and cloud computing for healthcare,” Electron., vol. 8, no. 7, pp. 1–49, 2019, doi: 10.3390/electronics8070768.
- N. M. Abdulkareem, S. R. Zeebaree, M. A. M. Sadeeq, Di. M. Ahmed, A. S. Sami, and R. R. Zebari, “IoT and Cloud Computing Issues, Challenges and Opportunities: A Review,” Qubahan Acad. J., pp. 1–7, 2021, doi: 10.48161/issn.2709-8206.
- T. Pflanzner and A. Kertesz, “A Taxonomy and Survey of IoT Cloud Applications,” EAI Endorsed Trans. Internet Things, vol. 3, no. 12, p. 154391, 2018, doi: 10.4108/eai.6-4-2018.154391.
- “Edge IIoTset.” https://www.kaggle.com/datasets/mohamedamineferrag/edgeiiotset-cyber-security-dataset-of-iot-iiot (accessed Dec. 17, 2020).
- A. K. Bediya and R. Kumar, “Real time DDoS intrusion detection and monitoring framework in 6LoWPAN for internet of things,” 2020 IEEE Int. Conf. Comput. Power Commun. Technol. GUCON 2020, pp. 824–828, 2020, doi: 10.1109/GUCON48875.2020.9231139.
- H. B. Patel and D. C. Jinwala, “6MID: Mircochain based intrusion detection for 6LoWPAN based IoT networks,” in Procedia Computer Science, 2021, vol. 184, pp. 929–934. doi: 10.1016/j.procs.2021.04.023.
- V. Adat and B. B. Gupta, "A DDoS attack mitigation framework for internet of things," 2017 International Conference on Communication and Signal Processing (ICCSP), Chennai, India, 2017, pp. 2036-2041, doi: 10.1109/ICCSP.2017.8286761.
- S. Sicari, A. Rizzardi, D. Miorandi, and A. Coen-Porisini, “REATO: REActing TO Denial of Service attacks in the Internet of Things,” Comput. Networks, vol. 137, no. March, pp. 37–48, 2018, doi: 10.1016/j.comnet.2018.03.020.
- H. Djuitcheu, M. Debes, M. Aumuller, and J. Seitz, “Recent review of Distributed Denial of Service Attacks in the Internet of Things,” 5th Conf. Cloud Internet Things, CIoT 2022, no. May, pp. 32–39, 2022, doi: 10.1109/CIoT53061.2022.9766655.
- G. Potrino, F. de Rango and A. F. Santamaria, "Modeling and evaluation of a new IoT security system for mitigating DoS attacks to the MQTT broker," 2019 IEEE Wireless Communications and Networking Conference (WCNC), Marrakesh, Morocco, 2019, pp. 1-6, doi: 10.1109/WCNC.2019.8885553.
- D. C. J. Himanshu B. Patel, “Trust and Strainer Based Approach for Mitigating Blackhole Attack in 6LoWPAN: A Hybrid Approach,” IAENG Int. J. Comput. Sci., vol. 48, no. 4, 2021.
- Kale and Bhosale, “Detection of blackhole attack in distributed wireless sensor networks,” vol. 9, no. 3, pp. 172–175, 2021.
- Sahay Rashmi, Geethakumari G., Mitra Barsha, and Thejas V., Exponential Smoothing based Approach for Detection of Blackhole Attacks in IoT. 2018.
- A. Ahmed, Firoz and K. Young-Bae, “Mitigation of black hole attacks in Routing Protocol for Low Power and Lossy Networks,” Secur. Commun. Networks, vol. 9, no. 18, pp. 5143–5154, Dec. 2016, doi: 10.1002/sec.1684.
- V. Neerugatti and A. R. M. Reddy, “Detection and prevention of black hole attack in RPL protocol based on the threshold value of nodes in the internet of things networks,” Int. J. Innov. Technol. Explor. Eng., vol. 8, no. 9 Special Issue 3, pp. 325–329, 2019, doi: 10.35940/ijitee.I3060.0789S319.
- S. Ali, M. A. Khan, J. Ahmad, A. W. Malik, and A. Ur Rehman, “Detection and prevention of Black Hole Attacks in IOT & WSN,” in 2018 3rd International Conference on Fog and Mobile Edge Computing, FMEC 2018, May 2018, pp. 217–226. doi: 10.1109/FMEC.2018.8364068.
- A. Nasution, V. Suryani, and A. Wardana, “IoT Object Security towards On-off Attack Using Trustworthiness Management,” 2020.
- N. Labraoui, M. Gueroui, and L. Sekhri, “On-Off Attacks Mitigation against Trust Systems in Wireless Sensor Networks To cite this version : HAL Id : hal-01789947 On-Off Attacks Mitigation against Trust Systems in Wireless Sensor Networks,” pp. 406–415, 2018.
- J. H. Mendoza, C. V. L., & Kleinschmidt, “Mitigating on-off attacks in the internet of things using a distributed trust management scheme,” Int. J. Distrib. Sens. Networks, vol. 2015, 2015, doi: 10.1155/2015/859731.
- F. Moradi, A. Sedaghatbaf, S. A. Asadollah, A. Čaušević, and M. Sirjani, “On-Off Attack on a Blockchain-based IoT System,” IEEE Int. Conf. Emerg. Technol. Fact. Autom. ETFA, vol. 2019-September, pp. 1768–1773, 2019, doi: 10.1109/ETFA.2019.8868238.
- F. Moradi, A. Sedaghatbaf, S. Asadollah, and M. Sirjani, “On-Off Attack on a Blockchain-based IoT System,” IEEE Int. Conf. Emerg. Technol. Fact. Autom. ETFA, vol. 2019-Septe, pp. 1768–1773, 2019, doi: 10.1109/ETFA.2019.8868238.
- V. Suryani, S. Sulistyo, and Widyawan, “The Detection of On-Off Attacks for the Internet of Things Objects,” Proc. - 2018 Int. Conf. Control. Electron. Renew. Energy Commun. ICCEREC 2018, pp. 1–5, 2018, doi: 10.1109/ICCEREC.2018.8712098.
- P. Bedi et al., “Detection of attacks in IoT sensors networks using machine learning algorithm,” Microprocess. Microsyst., vol. 82, Apr. 2021, doi: 10.1016/j.micpro.2020.103814.
- M. Hasan, M. Milon Islam, M. Ishrak Islam Zarif, and M. Hashem, “Attack and anomaly detection in IoT sensors in IoT sites using machine learning approaches,” 2019, doi: 10.1016/j.iot.2019.10.
- A. Churcher et al., “An experimental analysis of attack classification using machine learning in IoT networks,” Sensors (Switzerland), vol. 21, no. 2, pp. 1–32, 2021, doi: 10.3390/s21020446.
- I. Alrashdi, A. Alqazzaz, E. Aloufi, R. Alharthi, M. Zohdy, and H. Ming, “AD-IoT: Anomaly detection of IoT cyberattacks in smart city using machine learning,” 2019 IEEE 9th Annu. Comput. Commun. Work. Conf. CCWC 2019, pp. 305–310, 2019, doi: 10.1109/CCWC.2019.8666450.
- D. Rani and N. C. Kaushal, “Supervised Machine Learning Based Network Intrusion Detection System for Internet of Things,” 2020 11th Int. Conf. Comput. Commun. Netw. Technol. ICCCNT 2020, 2020, doi: 10.1109/ICCCNT49239.2020.9225340.
- A. A. Diro and N. Chilamkurti, “Distributed attack detection scheme using deep learning approach for Internet of Things,” Futur. Gener. Comput. Syst., vol. 82, pp. 761–768, May 2018, doi: 10.1016/j.future.2017.08.043.
- M. Al-Akhras, M. Alawairdhi, A. Alawairdhi, and S. Atawneh, “Using Machine Learning To Build A Classification Model For Iot Networks To Detect Attack Signatures,” Int. J. Comput. Networks Commun., vol. 12, no. 6, pp. 99–116, 2020, doi: 10.5121/ijcnc.2020.12607.
- D. R. Thamaraiselvi and S. Anitha Selva Mary, “Attack and Anomaly Detection in IoT Networks using Machine Learning,” Int. J. Comput. Sci. Mob. Comput., vol. 9, no. 10, pp. 95–103, 2020, doi: 10.47760/ijcsmc.2020.v09i10.012.
- A. A. Anitha and L. Arockiam, “A Review on Intrusion Detection Systems to Secure IoT Networks,” Int. J. Comput. Networks Appl., vol. 9, no. 1, p. 38, 2022, doi: 10.22247/ijcna/2022/211599.
- “Contiki OS.” https://anrg.usc.edu/contiki/index.php/Contiki_tutorials (accessed Jun. 12, 2022).
- “Computational Complexity of Machine Learning.” https://www.kaggle.com/general/263127 (accessed Jul. 17, 2022).
- “Computational Complexity of ML Models.” https://medium.com/analytics-vidhya/time-complexity-of-ml-models-4ec39fad2770 (accessed Jul. 17, 2022).
- “Computational Complexity of ML algorithms.” https://medium.com/analytics-vidhya/computational-complexity-of-ml-algorithms-1bdc88af1c7a (accessed Dec. 17, 2020).
- S. Bagui, X. Wang, and S. Bagui, “Machine Learning Based Intrusion Detection for IoT Botnet,” Int. J. Mach. Learn. Comput., vol. 11, no. 6, pp. 399–406, 2021, doi: 10.18178/ijmlc.2021.11.6.1068.
- M. Jeyaselvi, R. Kumar, M.S. Sathiskumar, and N.M.F. Qureshi, "A highly secured intrusion detection system for IoT using EXPSO-STFA feature selection for LAANN to detect attacks," Cluster Computing, vol. 25, pp. 1-18, 2023. doi: 10.1007/s10586-022-03303-x.
