Maintenance of Power Steam Turbine

Author: Boris E. Kapelovich, Solomon I. Khmelnik, David B. Kapelovich, Eugeny B. Benenson
Journal: Доклады независимых авторов @dna-izdatelstwo
Section: Power Engineering
Article in issue: 7, 2008.
Free access
The diagnostics system of the power steam turbine is offered. It can be executed also in the form of telediagnostic system. The system is presented on a site http://turbo.mic34.com/ System engineering can is ordered to authors.
Short address: https://sciup.org/148312137
IDR: 148312137
Text of the scientific article Maintenance of Power Steam Turbine
The diagnostics system of the power steam turbine is offered. It can be executed also in the form of telediagnostic system. The system is presented on a site System engineering can is ordered to authors.
Contents
-
1. Problem
-
2. Computer System of power Steam Turbine Efficiency Analysis in the Process of its
-
3. Effect of the System Realization
-
4. About the System Implementation
-
5. The System Implementation Variants
-
A. Automatic System
-
B. Non-automatic system
-
C. Telediagnostic System
-
6. Example
References
-
1. Problem
The modern level of power consumption demands constant increase of power of separate power blocks of heat stations and use of large amounts of fuel. In the conditions of the high market value of fuel, the preservation of the efficiency of power steam turbines (in abbreviated form - PST ) is of paramount importance as even minor deviations of the operational parameters from the rated ones can cause excessive consumption of fuel and large material losses.
Presently, power stations have at their disposal plenty of precise measuring equipment and computers for processing the measurement results. However, it is traditionally accepted to determine only general power and economic parameters of the operation of the station, its blocks and shops. It is impossible to analyze the sources of power losses at this approach with the purpose of their elimination. To solve this problem, it is necessary to rely on the expertise of the maintenance personnel. But only in rare cases is it possible to determine quickly and accurately the cause of the abnormal condition of the PST.
Thus, the PST maintenance is characterized by the following factors:
-
• the general deviation of the power parameters from the rated ones of the whole PST is not difficult to detect,
-
• but it is very difficult to disclose the faulty component that causes this deviation;
-
• it is very difficult to determine quickly and accurately the economic losses and damage.
In order to preserve the deviations within the rated values in the process of the maintenance of PSTs of various power it is necessary to change technologically the scheme of the functional efficiency control. It is necessary to be able to determine losses in separate components of the PST technological scheme with the purpose of analysis of the cause of their origin and their elimination.
This problem can be solved by the Computer System of the power steam turbines efficiency analysis developed by us (in abbreviated form - CS ). The CS
-
• formalizes the search for the faulty component of the PST,
-
• carries out continuous monitoring of the PST as a hole and each of its components,
-
• determines the power losses caused by the faulty equipment,
-
• gives the personnel recommendations on actions for elimination of the faults,
-
• assesses the effect of the realizations of these recommendations,
-
• collects the statistics of the components state changes for the optimal organization of repairs.
-
2. Computer System of power Steam TurbineEfficiency Analysis in the Process of its
The system uses a new method of analyzing power losses in all components of the PST by the results of current measurements. The results of the analysis are later used for location of the faulty component and formation of recommendations. Following is a more detailed description of the system.
The proposed system collects and processes information by the separate components and units of the PST with the purpose of determining local power losses. On the basis of the analysis of these losses, the system allows solving the following problems:
-
• Determination of the level and source of power losses in the steam cycle of the PST.
-
• Finding of the largest losses with the purpose of their prompt elimination.
-
• Analysis of the losses change in time. The investigation of the dynamics of various losses allows forecasting the further operation of the PST.
-
• The investigation of the local losses (especially in dynamics) allows correct planning of current and overall repairs, organizing rational preparation for these repairs.
-
• Analysis of local losses allows increasing interrepair time or, on the contrary, to make unplanned repairs to avoid emergency situations.
On the basis of the developed algorithms and mathematical models, it is possible to determine losses caused by the following factors:
-
• decrease of internal relative efficiency in the high pressure cylinder;
-
• decrease of internal relative efficiency in the medium pressure cylinder;
-
• clogging of the intermediate superheater;
-
• deterioration of vacuum in the condenser;
-
• overcooling of the condensate in the condenser;
-
• failure of performance of each regenerative heater of the feeding water.
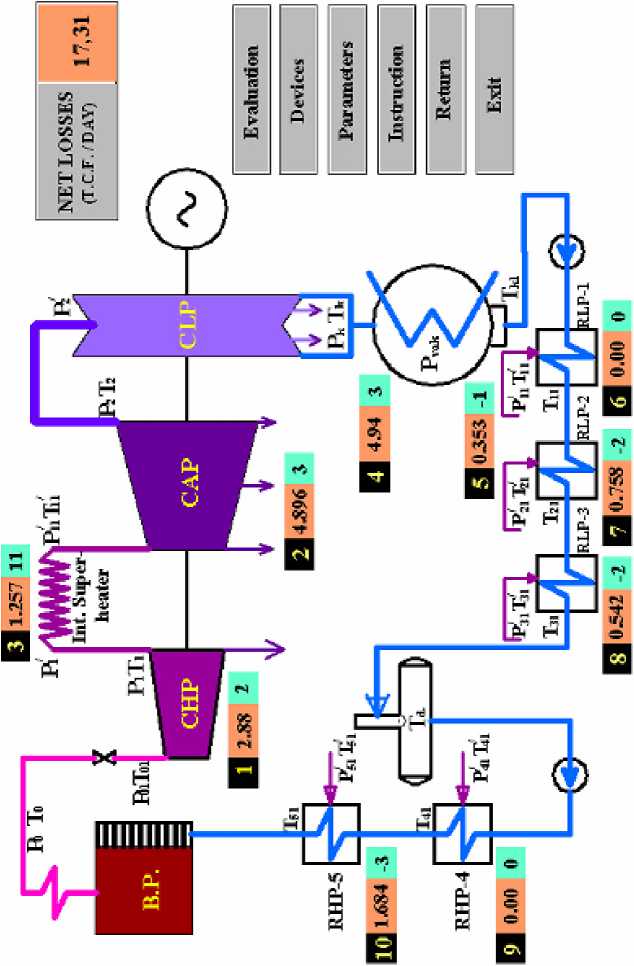
All these losses can be calculated over an hour, day, month and year of operation and expressed in terms of natural fuel, equivalent fuel and money. The amount of losses is shown on the display beside the corresponding component of the technological scheme. These parameters are then compared with the rated values specified by the manufacturer or with the results of heat tests.
The calculation of the local losses of the PST can be made by two methods:
-
• determination of daily fuel losses; measurements and calculations are made automatically during the day with the subsequent summation of all fuel losses;
-
• determination by one rated load.
The first method is more laborious and requires a great number of initial data received during a complex test of the PST in a wide range of loads. The second method does not require testing of the equipment and allows confining to the data of the manufacturer. However, the second method also allows making fairly good assessment of the equipment condition .
The following variants of the system are possible:
-
• analysis with the fixed power of the equipment;
-
• analysis with the variable power of the equipment;
-
• analysis with the formation of an archive and statistics.
The analysis is possible:
-
• with manual data input;
-
• with automatic data input.
-
3. Effect of the System Realization
The economic effect of the system realization depends on the turbine power, the heat scheme parameters, the operation mode and other factors characterizing the operation of each PST. The received measurements of a 228 MW operational Parson turbine were used for the evaluation of its characteristics (see below). Even with rather moderate parameter deviations from their rated values, the total overconsumption of equivalent fuel is 17.31 tons per day. If the faults are eliminated promptly and only basic losses are reduced, the fuel economy will be 2,854.3 tons a year, which in money terms will amount to $285,430 a year at the fuel price of $100 per ton. The implementation of the system makes it possible to save up to $1000 per 1 MW of the established power a year (depending on the fuel cost, the unit power and type).
-
4. About the System Implementation
The proposed system can find wide application in all power blocks of any power stations, as well as in large ship power installations. The system can be used in the turbine equipment of heat stations. But the greatest effect is reached in large power blocks condensing.
The implementation of the system does not require large capital spendings as it is based on the use of regular control devices of power stations. The basic expenditures fall to designing and introduction CS.
When first-priority objects for the system implementation are chosen, it is necessary to take into account the fact that its efficiency depends on the unit power and fuel cost. Therefore, large power blocks condensing, and stations using expensive fuel should be preferred.
The developed algorithm of determination of local losses is based on the project calculations of the manufacturer, the results of the heat tests of the PST (if available) and general principles of the thermodynamics and theory of steam turbine devices . Therefore, for the system realization on the chosen equipment, the following information should be provided:
-
1) the power block heat scheme with the designation of all rated parameters;
-
2) the results of the latest heat tests of the unit at the power station;
-
3) the following characteristics of the condenser:
-
- P k = f(D k ; T b ), N e = f(P k ) , where
-
- Pk is pressure in the condenser;
-
- Dk is steam consumption in the condenser;
-
- Tb is cooling water temperature at the condenser input;
-
- Ne is the steam turbine power;
-
4) specified power dependences of specific fuel consumption:
-
- B = f(Ne) , where
-
- B is fuel flow,
-
- Ne is the steam turbine power.
-
5. The System Implementation Variants
Any variant of the system implementation presupposes the input of the results of current measurements of the PST equipment parameter into the system (at certain intervals).
The system
-
• calculates the local and total losses in the PST equipment over the specified period,
-
• assesses the economic effect after the elimination of the losses,
-
• gives recommendations on the optimization of the equipment repairs.
The variants of the system implementation differ only in methods of measured parameters entering. However, these methods affect essentially the cost of the system and its operation. We propose the following options.
-
A. Automatic System.
The system software is installed in the power station computer net. The regular control devices should have terminals on the control board. Their accuracy is adequate for the assessment of losses. All the devices should have outlets for connecting to the computer net. The automatic system allows fixing the measured parameters automatically at specified intervals and provides the calculated deviations and losses at the same intervals.
-
B. Non-automatic System
This variant differs from the previous one in that it does not require additional electronic equipment for control devices. There is only one condition – the availability of software and a computer. The data are entered manually from the daily sheet by one rated load .
-
C. Telediagnostic System
This option is the simplest for the user. The maintenance is organized in the following way. The PST duty personnel (" the user ") sends the data from the daily sheet to the server by e-mail. The user sends certain data by one rated load only. In reply, the server returns the user
-
• the local and total losses of the PST over the specified period and in dynamics,
-
• recommendations on the repair and maintenance,
-
• the assessment of the economic effect after the realization of these recommendations.
-
6. Example
The proposed diagnostic system solves these problems on the basis of the local losses analysis. To make this analysis the daily sheet data are quite sufficient .
Below are the results of the computer system operation for a Parson PST with the following parameters: Ne = 228 MW; P0 = 14 MPa; t0/t01 = 538/538°C. The deviations from the nominal values are as follows:
|
steam temperature at the outlet of the high pressure cylinder ( T1 ) |
+2°C; |
|
steam temperature at the outlet of the medium pressure cylinder ( T2 ) |
+3°C; |
|
pressure in the intermediate superheater |
11%; |
|
steam temperature in the condenser ( tk ) |
+3°C; |
|
overcooling of the condensate ( tk1 ) |
-1°C. |
|
feeding water temperature after high-pressure heater 5 ( t 5 1 ) |
-3оС; |
|
condensate temperature after low-pressure heater 3 ( t31 ) |
-2оС; |
|
condensate temperature after low-pressure heater 2 ( t21 ) |
-2оС. |
The calculation results are shown in the PST scheme on the computer display while the following terms are used:
-
• losses – fuel losses due to the faulty equipment measured in tons of equivalent fuel per day;
-
• component – equipment that is part of the PST technological scheme;
-
• parameter – measured value;
-
• parameter deviation – the result of subtraction of the parameter measured value from the rated one.
On plan PST each component is accompanied by an information element of the following view:
1 2 3
In an information element are allocated
-
• field 1 – component number;
-
• field 2 – losses in the component (in tons of equivalent fuel per day);
-
• field 3 – the field for input of the parameter deviation.
The papers of independent authors 2007 volume 8
In addition, the operator can see information tables . The table " Losses " shows the losses in the components and the corresponding parameter deviations. For deviations, the physical limits of measurement are indicated, as well as the discreteness of their representation and their dependence on measured parameters. The measured parameters are indicated in the table " Measurements ".
Table " Measurements "
|
Denotation |
Parameter |
|
T11 |
Temperature after RLP-1 |
|
T21 |
Temperature after RLP-2 |
|
T31 |
Temperature after RLP-3 |
|
T41 |
Temperature after RHP-4 |
|
T51 |
Temperature after RHP-5 |
|
T1 |
Temperature after CHP |
|
T2 |
Temperature after CAP |
|
Tk |
Temperature after CLP (in the condenser) |
|
Tk1 |
Temperature after (in the collection of a condensate) |
|
P1 |
Pressure after CHP |
|
P11 |
Pressure before CAP |
|
C=2.57at |
Resistance of the intermediate over heater |
|
normX |
Norm of parameter X |
The measured parameters are entered into the system while the deviation value is calculated. It is also possible to enter the parameter deviations directly into the system. The value of the parameter deviation affects the losses in a component. The loss in the component can be determined as a certain function of the corresponding deviation. The determination of these functions is the main subject of the developed program . To calculate the losses, it is necessary to determine the values of all parameter deviations and press the button " Losses Calculation ".
When the measurements are entered automatically, the system program operates continuously, releasing the values of the losses in the on-line mode.
Table " Losses "
|
N |
Delta |
Min |
Max |
Deviation of parameter |
Unit |
Losses (ton cond. Fuel/day) |
|
1 |
1 |
1 |
10 |
dT=normT1-T1 |
oC |
2.88 from deterioration of efficiency in CHP |
|
2 |
1 |
1 |
10 |
dT=normT2-T2 |
o C |
4.896 from deterioration of efficiency in CAP |
|
3 |
1 |
11 |
13 |
dP=[(P11-P1)/C-1]*100 |
oC |
1.257 from pollution of the superheated |
|
4 |
1 |
1 |
10 |
dTk=normTk-Tk |
o C |
4.94 from deterioration of empty cpace |
|
5 |
1 |
-5 |
-1 |
dTp=Tk1-Tk |
oC |
0.353 from overcooling a condensate |
|
6 |
1 |
-5 |
-1 |
dT11=T11-T11 |
o C |
0.0 from underheating in RLP-1 |
|
7 |
1 |
-5 |
-1 |
dT21=T21-T21 |
oC |
0.758 from underheating in RLP-2 |
|
8 |
1 |
-5 |
-1 |
dT31=T31-T31 |
o C |
0.542 from underheating in RLP-3 |
|
9 |
1 |
-5 |
-1 |
dT41=T41-T41 |
oC |
0.0 from underheating in RHP-4 |
|
10 |
1 |
-5 |
-1 |
dT51=T51-T51 |
o C |
1.684 from underheating in RHP-5 |
