Maintenance reliability program as essential prerequisite of flight safety

Author: Bobomurodov S.K., Sagdiev T.A.
Journal: Теория и практика современной науки @modern-j
Section: Основной раздел
Article in issue: 2 (44), 2019.
Free access
This article is dealing with airline industry standards regarding to reliability reporting and with practical aspects of reliability program deployment within an operator’s organization. Reliability program is a tool for monitoring the effectiveness of aircraыft maintenance program. This work is outlining the existing airline industry standards and good practice in carrying out maintenance reliability program.
Maintenance reliability program, flight safety, upper control limit, ata
Short address: https://sciup.org/140274249
IDR: 140274249
Программа надежности обслуживания существенная предпосылка безопасности полетов
В этой статье рассматриваются отраслевые стандарты авиакомпаний, касающиеся отчетности по надежности, а также практические аспекты развертывания программ обеспечения надежности в организации. Надежность программы - это способ мониторинга эффективности программы технического обслуживания самолетов. В этой работе изложены действующие отраслевые стандарты авиакомпаний и передовой опыт реализации программы обеспечения технического обслуживания.
Text of the scientific article Maintenance reliability program as essential prerequisite of flight safety
Modern commercial aircraft maintenance programs are based on MSG-3 (Maintenance Steering Group) analysis. All operators in the initial phase of new aircraft type operation use generic maintenance program largely based on aircraft manufacturer’s recommendation. The manufacturer’s recommendation is featured in a manual called MPD - Maintenance Planning Document. While developing MPD, the manufacturer is assuming average operational conditions (climate, no geographical specifics, average annual utilization, average flight duration, standard operational procedures). During actual operation of the aircraft, it can be determined that the generic maintenance program as defined in MPD is not adequate in a large number of cases and consequently adjustments of the maintenance program are necessary to suit specific types of operation. Therefore, actual aircraft maintenance program should also reflect the relevant technical and operational environment which is specific to each operator. To facilitate this requirement, the operator’s maintenance reliability program should be established. The maintenance reliability program can be defined as a set of organizational procedures and responsibilities dealing with: obtaining and collecting data, statistical analysis of collected data, finding out negative statistical trends and definition of corrective actions to rectify negative trends – improve operation standards from primarily technical aspects, but also trigger changes in operational procedures as well as changes in aircraft system design.
The reliability program gives information about the reliability of each specific aircraft system and components as well as about the reliability of the aircraft type.
Such information can be further compared with the expected reliability data or, with such data collected for the world fleet of a certain aircraft type. The statistical analysis of the collected relevant data derives statistical trends in reliability which can be positive or negative. Negative trends indicate that some systems or component is not performing up to the expected standard and that the cause for this behavior has to be investigated, analyzed, determined and eliminated by proper corrective action.
Each reliability program should cover the following major steps:
-
a) collection of relevant maintenance data produced during aircraft operation, b) statistical analysis of data and identification of negative trends, followed by written reporting,
-
c) investigation of negative trends, finding root causes,
-
d) definition of corrective action that will correct negative trends,
-
e) performance of corrective action.
Constant application of the reliability program in the loop should give feedback information about the effectiveness of corrective actions.
Each step of the reliability program must be defined and specified in writing, thus creating a written program. Such program then defines responsibilities and procedures within the operator’s organization which have to be carried out in order to ensure successful functioning of the reliability program.
The essence of the reliability program is the statistical control over process. To establish such control, the statistical alert values (UCL) have to be defined for each monitored parameter. The alert value is used to determine the acceptable deviation from the mean value and to recognize and react to the significant deviations from statistically acceptable limits in reliability.
The repeated increase of the alert value represents a negative trend which has to be stopped by the application of appropriate corrective action. The repeated increase in three consecutive months is considered to be confirmed a negative trend and corrective action taken by the Reliability Control Board is mandated.
Upper control limit is based on the statistical calculation of the standard deviation covering the recent twelve-month period.
-
a) Calculation of the standard deviation:
a =
Z(x2)
M
(M2 — 1 1
M
—1
where:
x —monthly value of parameter in observed months, a —standard deviation,
M —number of observed months for which standard deviation is calculated.
-
b) Calculation of Upper Control Limit - UCL:
UCL = x + ka where:
x = ^x /M
-
k 2 : 3
k —deviation factor (normally between 2 and 3)
This calculation of upper control limit (UCL) should be repeated every 12 months. The upper control limit can be increased or decreased maximally by 10% compared to the previous UCL. Exceptionally, the Reliability Control Board can approve larger changes of UCL.
Upper control limits are established based on historical data (one year of operation). For new aircraft type in the fleet, such historical data are not available. In such situations there is a guideline for determining UCL within 15 months of operation.
– in the first six months of operation the reliability is monitored without the established UCL,
– at the end of the six-month period, a temporary UCL is established. This temporary UCL is used for next 9 months of operation,
– after 9 months (total 15 months since introduction of the aircraft type) new final UCL is calculated based on the last 12 months of operation.
Artificial UCL is used for certain aircraft components in the situation when there is no history on component removals available. This artificial UCL is maintained until enough historical data are accumulated to be able to establish normal UCL by calculation of standard deviation.
The following results show the monthly calculations of the electrical power system according to the ATA specification
|
Monthly rate (х) |
х — х |
(х — х)2 |
|
0.45 |
-0.25 |
0.0625 |
|
0.80 |
0.1 |
0.0100 |
|
0.67 |
-0.03 |
0.0009 |
|
0.93 |
0.23 |
0.0529 |
|
0.49 |
-0.21 |
0.0441 |
|
0.82 |
0.12 |
0.0144 |
|
0.51 |
-0.19 |
0.0361 |
|
0.33 |
-0.37 |
0.1369 |
|
0.97 |
0.27 |
0.0729 |
|
0.82 |
0.12 |
0.0144 |
|
0.95 |
0.25 |
0.0625 |
|
0.68 |
-0.02 |
0.0004 |
|
(!х)=8-42 |
1(х — х)2 = 0.508 |
The table above shows the defects rate of the aircraft every month. And on the basis of our information we can determine the Upper Control Limit line of air carrier.
The following formula is the process of determining the upper control limit line:
X = — = 8.42 = 0.70 n 12
a = /z(x X)2 /0.508 = 0.21
12 12
a = 0.21
UCL = x + ka UCL = 0.70 + 2 • 0.21 = 1.12
UCL2015 = 1.12 - the value of the upper control limit in according to the results in 2015 year.
According to the ATA specification, as a result of the defects of each system, the annual upper control limit is determined and the average value of the five-year observations and calculated on the basis of calculations the five-year UCL boundary.
|
UCL rate in years |
|
|
2014 |
1.17 |
|
2015 |
1.12 |
|
2016 |
1.11 |
|
2017 |
1.05 |
|
2018 |
0.9 |
|
UCLa = 1.07 |
|
UCL average rate within 5 years from 2014 to 2018
_ 1.17 + 1.12 + 1.11 + 1.05 + 0.9 _ a = 5 = 1-0'
UCLa = 1.07 - its upper control level average rate of last five years
As an example, as a result of the defect rate of the electrical power system, let's look at the situation where the defect and flight delay value exceeds the UCL line.
|
ATA chap ter |
SYST EM |
Mar. 18 |
Apr. 18 |
May. 18 |
Jun. 18 |
Jul. 18 |
Aug. 18 |
Sep. 18 |
Oct. 18 |
Nov. 18 |
Dec. 18 |
Jan. 19 |
Feb. 19 |
|
24 |
Electri cal power |
0.6 |
0.85 |
0.65 |
0.93 |
0.55 |
0.82 |
0.51 |
0.89 |
0.72 |
1.4 |
1.2 |
0.94 |
ATA 24
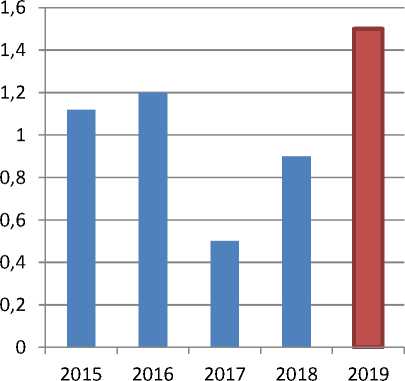
Figure 1: The upper limit of the ATA 24 system in 2015-2019 is diagrammatic
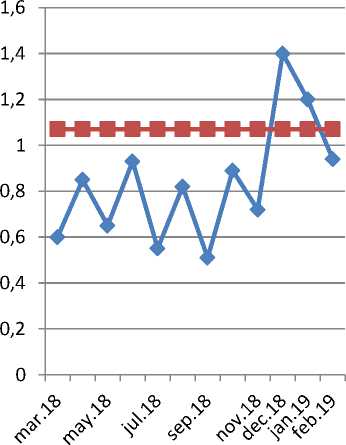
Figure 2: A line graph of the system's annual defects rate line showing that the UCL line crossed the line
Systems defects rate exceed from Alert level. Give special attention to systems Statistical Pre-Analysis:
* Source of Problem:
Dec 2018-Jan 2019:
20 cases (50%) "IDG fault" warning, resulting all in IDG replacement
10 cases (25%) cases of IDG high oil temperature
In summary, it should be noted that defects rate of a particular type of aircraft during the year will result in an annual upper control limit. This process also takes years to come, and according to our approach, the average value of the upper control limit for each five-year period is determined. As a result, if the fault line within the coming years exceeds the upper control limit, immediately the specialists responsible for the system will be set up by an inspection commission and malfunctions are immediately eliminated.
References Maintenance reliability program as essential prerequisite of flight safety
- Kinningson H., Aviation Maintenance Management, McGraw Hill, New York, 2014
- Maintenance Engineering Evaluation - Appendix F, Boeing, Seattle, 2005
- Zere, I., Appendices To Boeing Maintenance Engineering Evaluations. Seattle, Appendix F - Maintenance Reliability Program, 2005
